


You asked, now you have it – Options Trading 101: The Ultimate Beginners Guide to Options.
This guide took a month to write and contains over 12,000 words. It is designed to contain all the important information you need to go from absolute beginning to a confident trader.
Enjoy!
Contents
- What Are Options?
- Why Use Options?
- Option Features
- Use Cases of Options
- Option Pricing
- How To Read Option Quotes
- Margin Requirements
- Option Assignment and Exercise
- Option Volatility
- Option Greeks
- Payoff Diagrams
- Risks When Trading Options
- The Best Option Brokers
- Basic Option Strategies
- FAQ
- Option Definitions
What Are Options?
INTRODUCTION
Financial derivatives have been around for at least 200 hundred years since the Japanese introduced the first secondary market for derivatives related to commodities.
Nevertheless, they made their debut in the U.S. after the Chicago Board of Trade was founded, in 1848, to organize commodities trading activities.
These markets introduced futures and opened the doors for many new financial instruments including options.
In this section, we will explain the basics of how options work and how they are usually employed in today’s modern financial markets.
An option is a contract between two parties giving the taker (buyer) the right, but not the obligation, to buy or sell a security at a predetermined price on or before a predetermined date.
To acquire this right, the taker pays a premium to the writer (seller) of the contract.
CALL OPTIONS
A call option is a financial contract that gives the holder the right, but not the obligation, to purchase a certain underlying asset at a certain price, known as the strike price.
For example, ABC Corporation is trading at $120. A one-month call option is trading for $3.50.
The buyer of this call option has the right, but not the obligation to buy 100 shares of ABC for $120 per share at any time during the life of the contract. For this right, the buyer of the contract pays $3.50 to the seller.
The seller of the contract receives and keeps the $3.50 but is obligated to deliver 100 shares at $120 if called upon to do so.
PUT OPTIONS
In turn, a put option is a financial contract that gives the holder the right, but not the obligation, to sell a certain underlying asset at the strike price on or before expiry.
Using the example of ABC Corporation trading at $120, a one-month put option is trading at $4.00.
The buyer of this put option has the right, but not the obligation to sell 100 shares of ABC for $120 per share at any time during the life of the contract.
For this right, the buyer of the put contract pays $4.00 to the seller.
The seller of the contract receives and keeps the $4.00 but is obligated to buy 100 shares at $120 if called upon to do so.
RIGHTS AND OBLIGATIONS
The fact that the individual or institution who holds the option has the right and not the obligation to exercise the derivative means that if the result of the operation turns out to be unprofitable, the holder can abstain from completing the transaction and his sole loss would be the premium paid to purchase the option.
On the other hand, if the holder does exercise the option, the seller of the option must fulfill the contract.
Why Use Options?
Options can be used for four main purposes:
- Hedging/Risk Management
- Leverage
- Income
- Speculation
HEDGING / RISK MANAGEMENT
Options are a fantastic tool for hedging exposure to a certain asset. Let’s say an investor has a portfolio of S&P 500 stocks and is concerned about a drop in their value over the next few months.
Buying an SPX put option would give the investor some downside protection.
If the S&P500 falls, the value of the investors stock portfolio will drop, but he will have made some profits from the bought put which will help offset the losses.
This is a simple example and there are many different ways in which options can be used for hedging and risk management.
LEVERAGE
Since options cost only a small fraction of the price of the underlying asset an investor can gain a larger exposure to a certain security by buying put or call options instead of buying the underlying asset directly.
This particular feature of options is known as leverage.
Let’s say you want to invest in ABC Corporation stock, as you think the price of its shares will go up over the next 3 months. If you have $1,000 and the shares cost $50 you could only buy 20 shares.
Instead, you could buy 2 call option contracts for $500 that give you the right to buy 100 ABC Corporation shares at $50, 3 months from now.
If the price of ABC’s shares goes up to $60 you will earn a 20% return if you invested in the shares directly.
At expiry, the $50 call option would be worth $10 with the underlying stock trading at $50. In this case, the call option has achieved a 100% return.
However, leverage cuts both ways and if the stock doesn’t move as expected, the investor could lose 100% of their investment.
INCOME
Using options to generate income is a popular strategy with investors. Covered calls are a logical place for stock investors to start because it is an easy scenario to understand.
Investors who sell call options on shares they own, can produce an income in addition to any dividends earned.
By selling a call option, the investor gets to keep the option premium, but there is a possibility that the shares will get called away if the stock price rises above the strike price of the sold call.
Covered calls will be covered in more detail shortly.
Other investors will use options to generate income on shares they have no ownership of via more advanced strategies such as vertical spreads, iron condors, calendar spreads and butterflies.
SPECULATION
Many investors and traders will use options to speculate on the market. Those expecting the market to rise might buy call options in the hope of making a large potential return.
Those expecting the market to drop might buy put options.
Other traders may opt for income generating strategies.
The great thing about options is that there are many strategies that can be used, no matter what your market outlook or opinion.
Option Features
In this section, we’ll take a look at the seven basic characteristics of all option contracts:
- Underlying Asset
- Call vs Put
- Contract Size
- Expiration Date
- Strike Price
- Premium
- American Vs European
UNDERLYING ASSET
As we know, the definition of an option is that it is a contract giving the owner (buyer) of the option the right (but not the obligation) to buy or sell a defined quantity of a defined asset.
This asset is called the underlying asset or sometimes just underlying.
Options can be traded on many different underlying assets, particularly in the United States and the universe of underlying assets has expanded rapidly in the last five to ten years.
The most common underlying assets are common stocks (shares in companies trading on the stock exchange).
Other popular assets for option traders include indexes such as the S&P 500, Nasdaq and Russell 2000.
The Russell 2000 is a particular favorite with option traders because of the high volatility, high liquidity and 10 point strikes.
Options can also be traded on futures, bonds, interest rates, currencies and ETF’s.
CALL VS PUT
There are two basic types of options – call options and put options. As a reminder
A call option gives you the right, but not obligation, to buy the underlying asset.
A put option gives you the right, but not obligation, to sell the underlying asset.
CONTRACT SIZE
An options contract represents exposure to a number of underlying shares. The standard contract size is generally 100.
This can occasionally change if there is a corporate action such as a reorganization or a new issuance of shares.
In the case of an index option, the contract value is fixed at a certain number of dollars per index point.
The size of the contract is equal to the index level x the dollar value per index point.
For example, S&P500 (SPX) options have a value of $100, so for an option contract with a strike price of 2,800, one contract would be 2,800 x 100 = 280,000.
EXPIRATION DATE
Options have a limited life span and expire on a certain date. The expiration date is the day on which all unexercised options expire and can no longer be traded.
The expiration date is fixed during the life of an option and will not change. Any options that are not exercised before expiration become worthless.
The expiration date for listed stock options in the United States is normally the third Friday of the contract month or the month that the contract expires.
On months that the Friday falls on a holiday, the expiration date is on the Thursday immediately before the third Friday[1].
Some brokers will automatically exercise any options that are in-the-money by more than $0.01.
If a trader doesn’t want the option to be exercised, they should close out the position prior to expiration.
European style monthly Index options also expire on a third Friday of the month, however the last trading day for Index options is the Thursday.
This can result in a significantly different settlement price than the Thursday closing price. You can read here for more details.
In the last few years there has been an explosion in the number of weekly options available. In some underlying instruments like SPX, there are options expiring every few days.
STRIKE PRICE
The strike price is the predetermined price for buying or selling the underlying asset.
The strike price does not change through the life of the option unless there is a corporation action such as a reorganization.
Depending on the underlying asset, there are usually many different strike prices available.
Taking a quick look at SPY options for the next month’s expiration date shows strike prices available from $140 to $225 in 5-point intervals then from $225 to $325 in 1-point intervals, then again from $325 to $400 in 5-point intervals.
Compare that to a less popular underlying asset like IYT and we have $155 to $175 in 5-point intervals, then $175 to $200 in 1-point intervals and $200 to $220 in 5-point intervals.
PREMIUM
The premium is the price of the option which is determined by the buyer and seller of the option.
Option premium is determined by market participants with market makers playing a huge role in determining the price of options.
You can read more about the role of market makers here.
Option premiums are quoted in cents per share. To calculate the total premium cost, traders need to take the price in cents times the multiplier.
An option contract quoted at $1.20 would cost $120 to buy ($1.20 x 100).
Option premiums are higher for high volatility stocks which reflects the chance of higher movement in the underlying over the course of the options life.
For example, an at-the-money call option on a high volatility stock like ROKU trades for around $14.00 whereas a similar call on a low volatility stock like JNJ trades for around $4.00.
Option premium will also depend on the price of the underlying stock. A stock like AMZN which is currently trading at $1720 has at-the-money options trading around $65.
Compare that to a low-price stock like GE which is trading at $8.30 where at-the-money options trade for only $0.20 – $0.30.
AMERICAN VS EUROPEAN
The difference between American and European options relates to when the owner of the option can exercise the option.
American style options can be exercised at any point during the options life, but a European style option can only be exercised at a single point in its life – the moment it expires.
Exercising an option has nothing to do with trading an option and both style of options trade exactly the same way during their lifetime.
The terms American and European have nothing to do with geographic locations.
Both types of options trade in many places. European style options are very common on American exchanges (SPX, RUT and NDX are all European style options).
Use Cases of Options
Let’s look at some practical examples of how you can make options work for you.
INCOME GENERATION
Selling call options against shares already owned is one of the simplest and most rewarding ways to trade options. It’s a great way to get started for those that are new to options.
It’s a logical place to start if you’re familiar with share ownership.
Selling options over shares you own, generates income in additional to any dividends earned while holding the shares.
The risk of course, is that your shares might get called away if they rise strongly.
You are also limited your upside because any gains the stock makes above the strike price are not captured.
Let’s look at a couple of examples:
SCENARIO 1: SELLING OPTIONS ON SHARES YOU ALREADY OWN
Assume you already hold 100 shares of ABC Corporation as part of a diversified long-term retirement portfolio.
The current price is $60 and you would be happy to sell your shares if the price reached $62.50.
You look in your brokerage account and see that a 3-month $62.50 call option is trading with a bid price of $0.98 and an ask price of $1.02.
You place an order to sell the $62.50 call option for $1.00 which is the mid-point of the bid-ask spread.
Assuming your order gets filled, you will receive $100 in premium ($1.00 x 100 shares in the contract) which is yours to keep.
As an option seller, you now have the obligation to sell your shares for $62.50 if called upon to do so at any time during the life of the option.
If ABC Corporation is trading above $62.50 at expiry, your shares will be called away and you will have made a nice profit.
IF ABC Corporation is trading below $62.50 at expiry, you get to keep your shares, and the $100 option income. You can now continue to hold the shares or sell a new call option.
SCENARIO 2: SELLING A PUT OPTION ON A STOCK YOU ARE HAPPY TO OWN
In this example, you don’t own any ABC Corporation shares, but would be happy to buy them for $57.50.
Upon checking the option quotes, you see that a 3-month $57.50 put option on ABC Corporation is trading with a bid price of $1.12 and an ask price of $1.16.
You place an order to sell the $57.50 put option for $1.14.
Assuming your order is filled, you receive $114 in premium.
You now have the obligation to buy 100 shares of ABC Corporation at $57.50 if called upon to do so during the life of the option.
If ABC Corporation is trading above $57.50 at expiry, your put option expires worthless and you have generated $114 in income.
If ABC Corporation is trading below $57.50, your put option will be assigned and you will be required to buy 100 shares at $57.50.
The net cost of the purchase is $56.36 which is calculated as the strike price less the premium received ($57.50 – $1.14).
Selling put options is a great way to take ownership of shares you want to buy for a lower cost price.
The downside is that $114 is the maximum profit you can make, no matter how high ABC Corporation’s shares go.
PORTFOLIO PROTECTION
Options are a fantastic way to protect against a short-term fall in a stock’s price without having to sell your shares.
Selling call options was covered under income generation and does give some small protection against a drop in a stock’s price, but the protection is limited to the amount of premium received.
Any further falls are not protected.
A way to obtain more protection is by buying a put option.
Using ABC Corporation again, the stock is trading at $60 and you are worried about a sharp decline. You want to lock in a sale price in case things get really bad.
Instead of selling the 3-month $57.50 put option as in the previous example, this time we buy the put option.
The put option costs $1.14 or $114 in total and we have a guaranteed sale price of $57.50, no matter how low the stock goes.
Even if the company goes bankrupt and the share price goes to $0, you can still sell you shares for $57.50.
You can see why options are such a great tool for portfolio protection!
Think of buying a put like buying an insurance contract. You pay a premium and receive coverage in the event of a disaster.
If the disaster doesn’t happen, you lose the premium that you paid, but you don’t mind because you were able to sleep at night knowing that you had protection against the worst-case scenario.
LEVERAGED EXPOSURE
Speculators can choose to try and profit by predicting movements in the underlying shares. Traders can achieve far greater returns using options as opposed to just buying or selling shares.
Buying call options allows traders to profit from an increase in the price of the underlying asset.
Buying 100 shares can be prohibitively expensive for some investors but buying call options allows traders to leverage their capital to potentially achieve higher returns.
The flip side with leverage of course is the higher risk and when buying call options, there is always a chance that the investor will lose 100% of their investment.
Here’s a table comparing the potential returns from share ownership and call options.
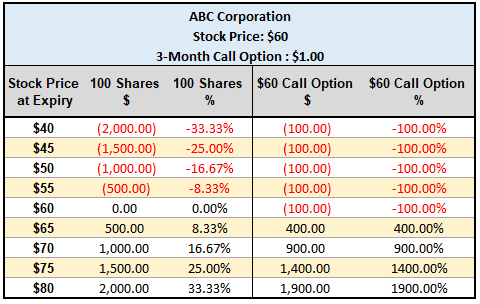
Notice that the gains in dollar terms are similar, but the percentage returns are much higher for the call option.
Buying call options can also be thought of in terms of buying time to decide if you want to buy the shares.
You pay the premium which is only a fraction of the price of the underlying shares. The option then locks in a buying price for the shares if you decide to exercise your option.
ADVANCED STRATEGIES
Selling call options and buying calls and puts are simple strategies to get started in options trading.
However, the possibilities are almost endless and there are many ways to trade different market opinions.
This includes advanced strategies such as:
- Iron Condors
- Ratio Spreads
- Calendar Spreads
- Diagonal Spreads
- Poor Man’s Covered Call
- Wheel Trade
- Strangles and Straddles
- Risk Reversal
- Double Diagonals
- Jade Lizard
- Trapdoor
Once you understand the basics, the wonderful world of options starts to open all new possibilities.
Option Pricing
Option prices are determined by mathematical models such as the Black-Scholes or Binomial pricing models.
Most traders do not have a thorough understanding of these models and to be honest, they don’t need to. The main thing to understand is that there are six key factors that determine an options price:
- Current price of the underlying asset
- The time to expiration
- The strike price of the option
- The level of implied volatility
- Interest rates
- Any dividends payable during the life of the option
Before we look at the six factors, let’s discuss Intrinsic Value and Extrinsic Value (Time Value).
INTRINSIC VALUE
Intrinsic value is the difference between the strike price of the options and the current price of the underlying asset.
It is the portion of an option’s price that is not lost due to the passage of time.
CALL OPTION INTRINSIC VALUE
The intrinsic value of a call option can be calculated as the underlying asset price minus the call strike price.
Let’s say ABC Corporation is trading at $105 and a $100 call option is trading for $7. This call option has intrinsic value of $5, calculated at $105 – $100. The remaining $2 is time value or extrinsic value.
If we had a $110 call option trading for $0.50, it would have $0 intrinsic value because the call option is out-of-the-money. $105 minus $110 is less than zero so there is zero intrinsic value and the option price is made up entirely of time value.
PUT OPTION INTRINSIC VALUE
For a put option the intrinsic value is calculated as the put strike price minus the price of the underlying asset.
In our ABC example, a put with a strike price of $110 would have $5 of intrinsic value ($110 – $105) and a put with a strike price of $95 would have zero intrinsic value and be made up entirely of time value.
TIME VALUE OF OPTIONS
Time value of an option is the amount of the option premium that is not made up of intrinsic value.
Time value is calculated as the option price minus the intrinsic value.
The longer in time until an options expiry, the greater the time value.
Time value represents the amount you are prepared to pay for the possibility of the market moving in your favour during the life of the option.
Time value will vary between in-the-money, at-the-money and out-of-the-money options and is highest for at-the-money options.
Out-of-the-money options are comprised entirely of time value.
Deep in-the-money options will be made up of mostly intrinsic value and will have very little time value.
As time draws closer to expiry, the chance of a favourable movement in the underlying asset declines and therefore the time value declines.
This erosion of time value is called time decay. Time decay picks up speed as expiration approaches. Some of you may have seen a similar chart to this:
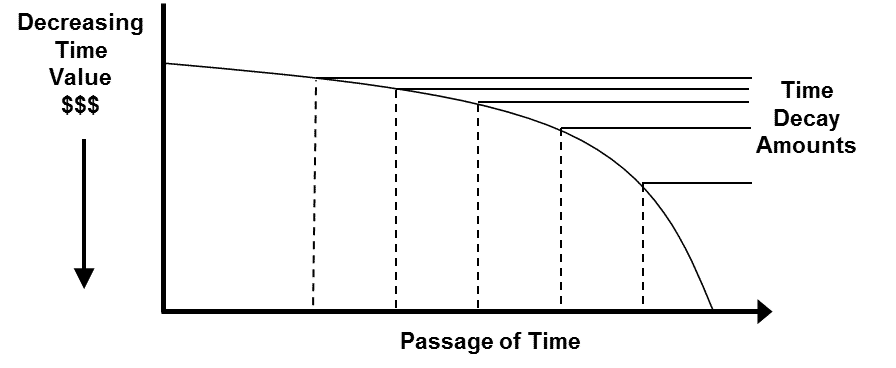
Image Credit: CME Group
TIME VALUE AND VOLATILITY
Time value is very much impacted by the anticipated level of volatility during the options life. A highly volatility stock will have much larger time value than a low volatility stock.
This represents the increased chance that the volatile stock will make a big move during the options life.
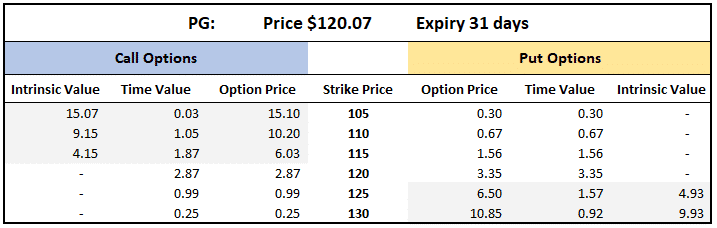
At the time of writing ROKU, a high-flying tech stock with high volatility was trading around the same price as Proctor and Gamble a stable low volatility stock in the consumer goods sector.
ROKU implied volatility is around 88% and PG implied volatility is at 22%, as a result we would expect ROKU options to be MUCH more expensive.
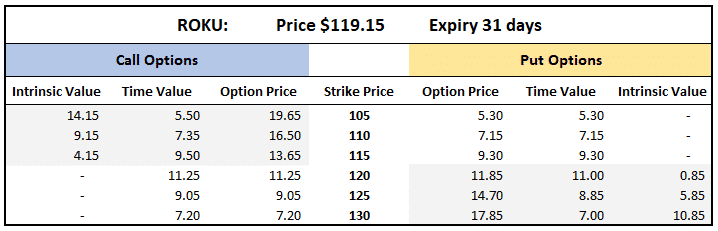
From the two tables below, it’s clear to see that ROKU options have much higher time value across the board.
As ROKU is a much more volatile underlying asset than PG, there is a much greater chance that the stock will make a big move during the next 31 days and this is reflected in the option prices.
For example, the $105 strike puts are almost worthless at only $0.30 for PG, this reflects the fact that market participants think there is very little chance of PG reaching this level before expiry.
The ROKU $105 put on the other hand is valued at $5.30 showing that the market thinks there is a good chance that ROKU might reach that level before expiry.
OPTION PRICING AND VOLATILITY
As we have seen above, the level of volatility can have a big impact on the prices of options, but how do we know the volatility of an underlying asset?
There are two different types of volatility – historical volatility and implied volatility.
Historical Volatility is calculated by measuring an assets stocks past price movements. It is a known figure as it is based on past data.
The data is readily available, so there is no need to calculate it yourself.
The main point you need to know here is that in general, stocks that have had large price swings in the past will have high levels of Historical Volatility.
As options traders, we are more interested in how volatile a stock is likely to be during the duration of our trade.
Historical Volatility will give some guide to how volatile a stock has been, but there is no way to predict future volatility.
The best we can do is estimate it and this is where implied volatility comes in.
Implied volatility is an estimate, made by professional traders and market makers of the future volatility of a stock.
It is the only unknown factor in the options pricing model, because there is no way to know for certain how volatile a stock will be in the future.
The best we can do is estimate it based on past behaviour and current market events.
Implied Volatility takes into account any events that are known to be occurring during the lifetime of the option which may have an impact on the price of the underlying stock.
This could include an earnings announcement or the release of drug trial results for a pharmaceutical company.
The current state of the general market is also incorporated into implied volatility estimates.
If markets are calm, volatility estimates are low, but during times of market stress volatility estimates will be raised.
One very simple way to keep an eye on the general market levels of volatility is to monitor the VIX Index.
OPTION PRICING AND INTEREST RATES
Interest rates also have an impact on option prices, however the impact is minimal and certainly much less than the impact of volatility.
Shorter-term options are also less impacted by changes in interest rates.
When interest rates rise, call option prices will increase while put option prices will decrease.
The logic behind this is as follows. Assume an investor wants to take an exposure to a particular stock.
Instead of buying the shares which might cost say $10,000, the investor buys call options total for $1,000.
Buying the call options gives a similar exposure and the remaining $9,000 can be invested to earn some interest.
Higher interest rates mean higher income on the $9,000.
This makes the call option more attractive and therefore more expensive.
The opposite is true for put options. With high interest rates, put options are less attractive.
This is because rather than holding the asset and buying a put option, the investor would be better off simply selling the asset and investing the proceeds at the higher interest rate.
OPTION PRICING AND DIVIDENDS
Cash dividends affect option prices through their effect on the underlying stock price.
Because the stock price is expected to drop by the amount of the dividend on the ex-dividend date, high cash dividends imply lower call premiums and higher put premiums.
Options prices will anticipate the dividend amounts weeks and months in advance.
Dividends are an important factor when deciding whether to exercise options early.
Whoever owns the stock on the ex-dividend date receives the dividend, so call option holders may exercise the option early in order to capture the dividend.
How To Read Option Quotes
All online brokers will have all options quotes you’ll need to trade. Most will provide free real-time quotes, but some may charge a small fee for real-time prices.
If you haven’t started trading yet and are looking for free option quotes then Yahoo, CBOE and Nasdaq all provide 20-minute delayed prices.
If you want to learn more about free quotes you can do so here. You will also find details of how to read options quotes provided by Interactive Brokers which is who I use for my trading.
In terms of reading option quotes generally, there are a few things to be aware of:
- Open interest and volume
- The Bid-Ask Spread
- Implied Volatility
- Expiration Dates
OPEN INTEREST AND VOLUME
Volume and Open Interest are related but also decidedly different. Volume is the number of contracts traded during the day’s session and that balance is wiped clean every day.
Whether a trader is opening (buy to open or sell to open) or closing (buy to close or sell to close), it counts towards that day’s option volume for that particular expiry and strike price.
Open interest on the other hand is a tally of the total number of option contracts open and active at each strike.
This represents all trades that have not been closed or exercised. The number is only updated at the end of the trading day once all trades have been tallied.
An interesting quirk is that volume can actually be higher in any given day than open interest.
For example, consider this case:
Day 1: Trader A buys 5 contracts to open. We have daily volume of 5 and have 5 open contracts.
Day 2: Trade A sells his 5 contracts and Trader B buys 20 contracts to open.
On day 2, volume would be 25 and open interest would be 20.
The important thing to note is that traders should focus on options with high volume (liquidity) and open interest.
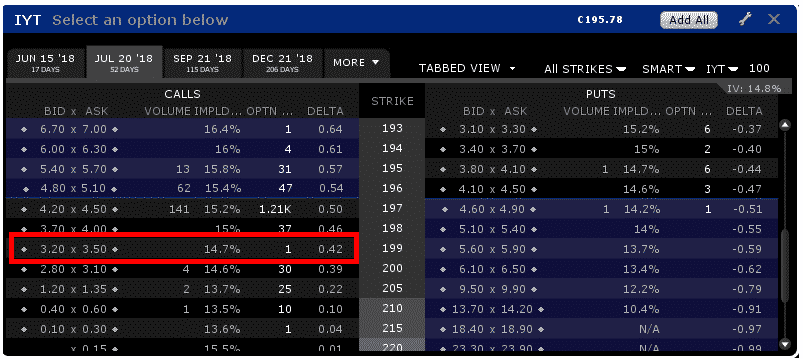
For example, take this option table on IYT, the Transportation ETF.
It wouldn’t be wise for a trader to open 20 contracts in the 199 calls. Firstly, because the bid-ask spread is quite wide and there is no volume.
But also because this would represent basically all of the open interest in this strike. In this case, the market makers will take advantage of you if you need to close the position in a hurry.
Good luck getting filled at the mid-point on those!
THE BID-ASK SPREAD
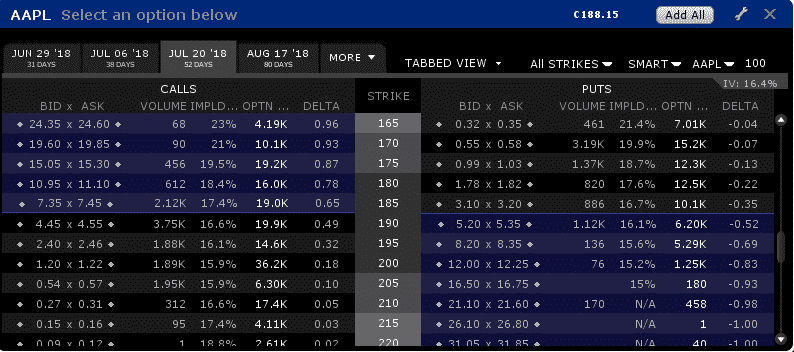
Below you will find a standard options table, this one being from Interactive Brokers showing AAPL options.

First and foremost, we have the calls on the left and the puts on the right. Looking at the calls we have the bid price and the ask price.
Hopefully you know what a bid-ask spread is, but for those that don’t here’s a quick explanation:
The bid price is the highest price the market will currently pay to buy the option. The ask price is the lowest price the market will currently sell the option.
Usually when trading options, you can receive a price close to the mid-point of the spread, but sometimes the market makers will make you pay a little extra or receive a little less.
For example, the July $195 call has a spread of $2.40 – $2.46. The mid-point would be $2.43 but we may not be able to get filled at this price.
If we were buying the call, we might have to pay $2.44 or $2.45 and if we were selling the call, we might only get $2.42 or $2.41.
AAPL is a highly liquid stock, so our chances of getting filled near the mid-point is much higher than if we were trading options on a less liquid stock.
IMPLIED VOLATILITY
Implied volatility is a very important metric for option traders. Implied volatility is the only unknown element in the options pricing model, because we cannot know in advance how much a stock will move between now and expiration.
This value is an estimate, but the key thing to remember is that, just like a stock, we want to buy low and sell high.
We want to be a net buyer of options when implied volatility is low (options are cheap) and be a net seller of options when implied volatility is high (options are expensive).
Another important thing to learn about implied volatility is skew. We can see below that each individual option has its own implied volatility and they are not all the same.
For example, the $165 puts have implied volatility of 21.4% while the $200 puts have implied volatility of 15.2%.
This is known as skew. Some people refer to is as an implied volatility smile.
EXPIRATION DATES
Expiration dates are fairly self-explanatory, so I won’t go in to too much detail here. But basically, there are three common cycles to which the stocks are assigned:
- January, April, July and October
- February, May, August and November
- March, June, September and December
Stocks will generally always have options for the current month and the next month in addition to whichever cycle it falls in from above.
In recent years, there has been a proliferation of weekly options, and some popular instruments like SPY have options expiring every few days.
Margin Requirements For Options
Margins are designed to protect the financial security of the market.
If a trader sells an option contract, he has a potential obligation to the market because the buyer of the option may exercise their position.
WHAT IS OPTION MARGIN?
Option margin is cash or securities that must be posted with the broker to cover collateral requirements.
Margin requirements are set by FINRA and the options exchanges, however some brokers may add to the minimum requirements set by the regulators.
Options strategies that involve naked options such as strangles and straddles require significant amounts of margin.
Other option strategies such as covered calls and covered puts require no margin as the stock is used as collateral.
Likewise, debit spreads do not require margin because the obligation of the short option is offset by the long option.
Most traders with small accounts will fall under Reg T margin requirements.
Those with larger accounts may be eligible for Portfolio margin which is much more favorable for option traders.
Portfolio margin is a policy of offsetting or consolidating option positions in order to account for a portfolio’s overall risk.
This can result in substantially lower margin requirements if traders have uncorrelated positions.
Option Assignment and Exercise
It’s not sexy, but option assignment and exercising is something you should have a basic understanding of before trading options.
Remember that with options transactions there are two parties involved, a buyer and a seller.
The term exercise is used when the owner of a call or put “exercises” his or her right to buy or sell the stock.
They buy shares if the option is a call and they sell shares if they held a put.
The term assignment is used when someone has a short position in a call or put and is called upon to fulfil their obligation by someone who is exercising their rights.
Unlike exercising the option, assignment means they must sell if it is a call and they must buy it if it is a put.
You can read more about option assignment and exercise here.
Option Volatility
Option volatility is a key concept for option traders and even if you are a beginner, you should try to have at least a basic understanding.
Option volatility is reflected by the Greek symbol Vega which is defined as the amount that the price of an option changes compared to a 1% change in volatility.
In other words, an options Vega is a measure of the impact of changes in the underlying volatility on the option price.
All else being equal (no movement in share price, interest rates and no passage of time), option prices will increase if there is an increase in volatility and decrease if there is a decrease in volatility.
Therefore, it stands to reason that buyers of options (those that are long either calls or puts), will benefit from increased volatility and sellers will benefit from decreased volatility.
The same can be said for spreads, debit spreads (trades where you pay to place the trade) will benefit from increased volatility while credit spreads (you receive money after placing the trade) will benefit from decreased volatility.
Here is a theoretical example to demonstrate the idea. Let’s look at a stock priced at 50. Consider a 6-month call option with a strike price of 50:
If the implied volatility is 90, the option price is $12.50
If the implied volatility is 50, the option price is $7.25
If the implied volatility is 30, the option price is $4.50
This shows you that, the higher the implied volatility, the higher the option price.
WHY IS VOLATILITY IMPORTANT
One of the main reasons for needing to understand option volatility, is that it will allow you to evaluate whether options are cheap or expensive by comparing Implied Volatility (IV) to Historical Volatility (HV).
As option traders, implied volatility is where we can gain an edge. As the only unknown piece of the option pricing puzzle, if our estimate of volatility over the course of our trade is better than the market estimate, we win. Simple as that.
For this reason, we want to be buying implied volatility when it is low in comparison to recent history, and selling implied volatility when it’s high. Just like we would with a stock.
Buy low, sell high. Or sell high, buy low.
Below is a graphical view of implied volatility and historical volatility on AAPL stock. Implied volatility is in gold and historical volatility is in blue.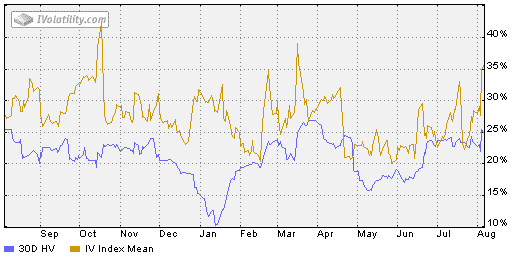
There are a couple of important things to note here:
- Implied volatility is generally always higher than historical volatility. This is important because it shows us that the market over estimates the amount of volatility in the stock. Think about it this way, if we sell volatility when it is at 40%, and if it ends up being only 20% through the life of our trade, we win.
- Secondly, focusing just on the yellow line (IV), notice that sometimes it is high (35%-40%) and sometimes it is low (20%-25%). We want to be buying volatility when it is in the 20%-25% range and selling volatility when it is in the 35%-40% range.
VOLATILITY SKEW
A stock has a general level of implied volatility as we saw above, but every single option in the options chain also has its own implied volatility.
The volatility is not always the same for different options. This is known as volatility skew.
For example, puts generally trade with higher implied volatility than calls. This is because markets tend to fall faster than they rise and option sellers want to be compensated for that risk.
There are two other types of skew to be aware of as well – vertical skew and horizontal skew
VERTICAL SKEW
Vertical skew refers to differences in implied volatility within a particular option expiration.
Below we have a table showing the implied volatility for 1-month put options in AAPL stock.
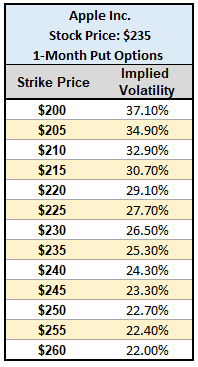
Notice that each strike price has its own level of implied volatility and that the level rises as we move further out-of-the-money.
The reason for this is the same as above, traders are willing to pay more for “crash protection”. This skew is known as vertical skew and is fairly common across most stocks and indexes.
HORIZONTAL SKEW
Another type of skew occurs across expiry dates and is known as horizontal skew.
Generally speaking, the further out in time you go the higher the implied volatility. This is because with more time, there is more of a chance something can go wrong in the markets.
This is a normal situation called Contango (more on that in a minute).
Another reason why horizontal skew can occur is because of earnings reports.
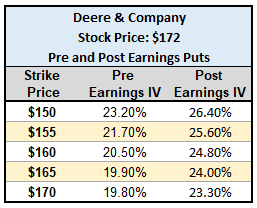
Let’s use DE as an example this time.
In the table below, you can see that the options that expire before the earnings announcement have lower volatility than the options that expire after the earnings announcement. The is much more risk of a big move in the stock due to the unknown financial results, hence the implied volatility is larger.
Here’s an even better example to demonstrate the point, using a highly volatility stock – Roku, Inc.
The options that expire before earnings are all around 63% implied volatility. The options that will be exposed to the earnings result have a whopping 92% implied volatility!
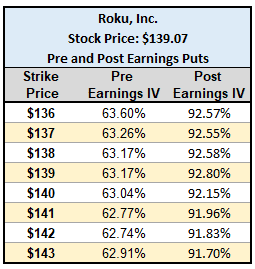
Taking a $140 strike, the front week put is trading for $7.65 and the back week put is $12.59, even though they are only one week apart. You can see that implied volatility has such a big impact on options prices and now you’ll know to keep an eye out for it.
VIX TERM STRUCTURE
VIX Term Structure is an important concept for option traders, but it’s an advanced topic for new traders to grasp, so I’ll break it down into the key points.
- What is VIX Term Structure
- Key terms such as Contango and Backwardation
- How to use VIX Term Structure in your trading
- Examples of how the Term Structure is impacted during volatility spikes
WHAT IS VIX TERM STRUCTURE?
VIX Term Structure is the term used by CBOE for a set of expected S&P500 Index volatilities based on S&P500 options of different time to maturity.
The VIX Index refers to a Volatility Index created by the Chicago Board Options Exchance (CBOE) that represents the market’s expectations of price movements in the S&P 500 over the next 30 days.
VIX is one number whereas the VIX Term Structure refers to a set of several numbers measuring expected volatility for different option expiry periods.
A great source for looking at the current and past VIX Term Structure is www.vixcentral.com
I look at this site almost daily to see what the market’s expectation of future volatility looks like. Below you can see an example of the VIX Term Structure. I’ll explain more about this later in the article.
CONTANGO AND BACKWARDATION
Before diving into the Term Structure we need to understand these two key terms.
Contango and backwardation are key terms that come from the futures market. Contango refers to a situation where the price of a commodity is higher in the future compared to the current spot price.
The main reason for this is what’s called the cost of carry. If you think about it; it makes perfect sense.
Let’s say I know that I need 100 barrels of oil in 3 months’ time. I could buy the barrels today for $50, but then I have to pay storage costs for 3 months until I need it (cost of carry).
In this example, I might be willing to pay $51 to take delivery in 3 months rather than today, so that I don’t need to pay for storage.
Contango is the most common scenario for futures.
The opposite of Contango is Backwardation which occurs when the spot price is higher than the futures price.
In the commodities market, this situation might occur when there is a perceived shortage of a commodity and companies are willing to pay a premium to take delivery today in order to keep their production lines running.
While the terms Contango and Backwardation originated in the commodity futures market, they also apply to financial instruments.
Like commodities, there is a cost of carry with financial instruments. Rather than storage costs, the cost of carry on financial instruments is the interest rate paid to purchase and hold the instrument.
Most of the time financial futures, such as VIX Futures, are in Contango. However, when there is a market panic, they can flip into Backwardation pretty quickly.
Using VIX as an example, during a panic the spot price of VIX shoots higher, but the future price of VIX may not go up by as much.
This is because the market knows that panics usually die down within a few weeks and things return to normal.
You’ll see two great examples of this at the bottom of this section.
WHY IS THE VIX TERM STRUCTURE IMPORTANT?
VIX Term Structure is important because it tells us a lot about the current state of the market.
When the Term Structure is in Contango, markets are in a calm state and are behaving normally.
When we shift to Backwardation, markets are in panic mode.
Sometimes panics can reverse quickly such as during Brexit, but other times the market can remain in Backwardation for an extended period such as during the financial crisis of 2008.
Yes, taking a contrarian view can be profitable when markets panic, but we also need to be aware that some of the worst market declines in history have come AFTER the VIX Futures market moved into Backwardation.
TRADING STRATEGY FOR WHEN VIX IS IN CONTANGO
In this article, I discuss a strategy for trading VXX. The key premise is to:
- Wait for the market to move from Backwardation to Contango (likely means the panic is over)
- Buy VXX puts far out in time, usually that means at least 4-5 months for me. This gives the trade plenty of time to work out.
- Takes profits systematically as the trade moves in your favor.
VIX TERM STRUCTURE EXAMPLES
When traders talk about a “volatility spike”, it’s important to realize that not all months on the Curve are impacted equally.
Spot VIX may have had a big rise, but future months likely were not impacted as much.
As mentioned earlier in the article, I want to use a couple of examples to illustrate this point and talk about why it’s important when trading options.
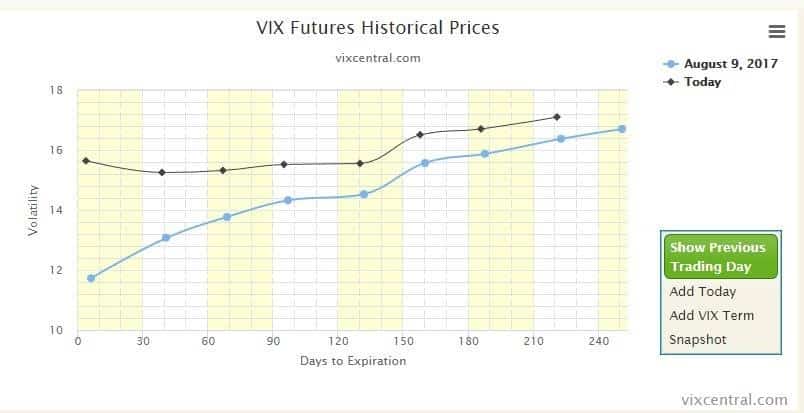
AUGUST 2017
2017 was a very quiet time in the markets and volatility was incredibly low for most of the year. The VIX got as low as 8.84 on July 26th!!
On August 9th, 2017 VIX closed at 11.11, and the next day spiked 44% to 16.04. In percentage terms, this was one of the biggest spikes in history.
The chart below shows the VIX Term Structure on August 9th (blue) and August 10th (black).
Notice that on August 10th we flipped from Contango to Backwardation.
Also notice that the spike was the most pronounced in the front months of the curve.
This is VERY important to understand as option traders.
Anyone who was short volatility in those front month (short-term) options, would have been hit pretty hard.
The move was much less pronounced going out 90 days and further.
This is a key reason why I tend to focus on longer term trades these days, they are much less impacted by volatility spikes and P&L moves much slower allowing me more time to react.
FEBRUARY 2018
Here’s another example from February 2018, commonly referred to as the “volpocalype”.
On February 5th, VIX spike an almighty 115.6% from 17.31 to 37.32.
The previous biggest spike (excluding the 1987 crash because VIX didn’t exist then) was 64.20% in February 2007.
Just let that sink in for a minute.
The spike was nearly twice as big as the previous biggest spike. It literally wiped out traders by the thousands and even saw the collapse of a few volatility ETF’s.
Below, you can see what happened to the VIX Term Structure on that day.
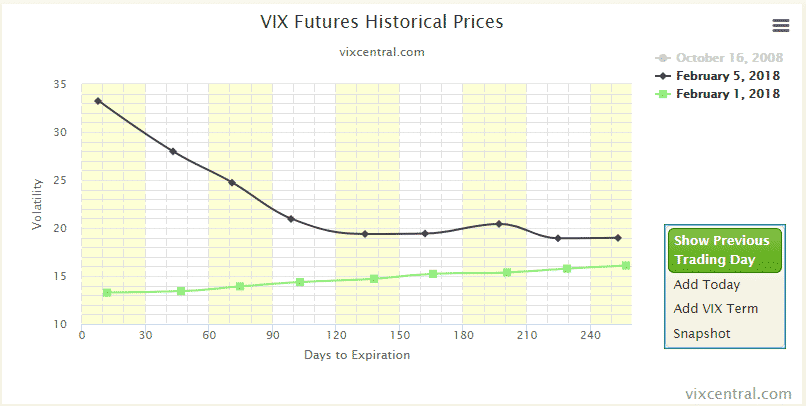
Similar to August 2017, not all months on the curve were impacted and most of the damage was concentrated in the front 3-4 months.
VOLATILITY PRODUCTS
Volatility products and trading volatility as an asset class has exploded in recent years. Popular products for trading volatility include:
- VIX options
- VIX futures
- VXX
- UVXY
- SVXY
- VXST
- TVIX
- ZIV
- VXZ
- VIXY
These volatility products should ABSOLUTELY NOT be traded by beginners. They are complex instruments and until you understand them, it is best to avoid them.
You can read this article if you want to understand how SVXY works. Most of the others will be similar, I won’t go into detail here because the products are not appropriate for beginners.
SVXY famously dropped around 95% in one day during the “volpocalypse” so that’s one thing to keep in mind. XIV was another product that actually went bust on that same day, so the risks are definitely there.
Option Greeks
Option Greeks are risk assessment metrics commonly employed in the options market to analyze different types of risk related to such securities.
They are known as ‘The Greeks’ since each of the metrics is named after a particular Greek word.
There are five main Greeks and in this section, we will help you in understanding which kind of risk each of them measure.
Delta (Δ)
Delta tracks the degree in which an option price changes in relation to the price of its underlying asset.
The calculation of Delta results in a range of 0 to 1 or -1 to 0 depending on the type of option (put or call) and it indicates the expected variation in the price of the option if the price of the underlying asset changes by 1%.
For example, a Delta of 0.3 indicates that if the price of the underlying asset increases by 1%, the price of the option will increase by 0.3%.
RELATED ARTICLES
OIH Sold Puts With Delta Hedging
EWZ Short Straddle With Delta Hedging Pays Off Nicely
Why Delta Dollars Will Change Your Option Trading Forever
How to Hedge Option Delta With Futures
A Quick and Easy Way to Cut Your Exposure in Falling Markets
Gamma (Γ)
Gamma can be understood as a Delta-related calculation, as it measures the degree in which the Delta of a particular option will change if the price of the underlying asset varies by 1%.
It is, therefore, an estimation of how sensitive the Delta of the option is.
If Gamma is high, it means that the Delta of the option is highly volatile and therefore it can’t be relied on as a sound indicator of its potential behavior.
RELATED ARTICLES
What Happens To Iron Condors When The Market Tanks
Vega (v)
Vega measures the response of an option’s price to a change in the implied volatility of its underlying security.
The implied volatility is understood as the estimated potential variation of the price of a security.
In this context, Vega indicates the potential variation in the option’s price if the implied volatility varies by 1%.
For example, a Vega of 0.7 is saying that if the implied volatility of the underlying asset changes by 1% the price of the option will vary by 0.7%.
Therefore, a security that is becoming highly volatile will increase the premium paid on the option.
RELATED ARTICLES
Why Calendar Spreads Are An Oxymoron
How To Trade Volatility Using The VIX Index
Understanding Implied Volatility
Do Buyers of Options Benefit From High Volatility
Volatility Trader Makes Gigantic Bet for December
How To Trade Volatility – Chuck Norris Style!
Theta (Θ)
Theta measures the change in the price of an option as time passes and the expiration date approaches.
Theta is commonly expressed in absolute values and an option could have a negative or positive Theta.
A negative Theta of say -0.30 indicates that each day that passes the option’s price will decrease by $0.30.
RELATED ARTICLES
Do Options Lose Value Over The Weekend?
The Ultimate Guide To The Bear Call Spread
Rho (ρ)
Rho measures the price sensitivity of the option in relation to a change in interest rates.
The higher the Rho the more sensitive it is to potential fluctuations in interest rates.
A positive Rho means that the option will behave in the same direction as the interest rate.
If rates increase the option’s price will increase, while a negative Rho indicates that the option’s price will behave in the opposite direction of interest rates.
A Rho of 0.04 means that a 1% increase in interest rates will add $0.04 to the price of the option.
RELATED ARTICLES
Payoff Diagrams
Payoff diagrams are something you will become intimately familiar with as you progress on your option trading journey.
A payoff or break-even diagram shows the potential profit or loss on the strategy at different
stock prices at expiry. Payoff diagrams can be drawn for any option or combination of options in the one class.
Let’s take a simple example of a call option. There will be a different payoff diagram for the buyer and the seller.
CALL OPTION BUYER
Assume ABC Corporation is trading at $105 and a $100 call option is trading for $7.
Looking at the below payoff diagram, we can see that the maximum loss on the trade is $700 which occurs at $100 and below.
The breakeven price on the trade is $107 which is equal to the strike price plus the price of the call.
The potential profits are unlimited.

CALL OPTION SELLER
Compare that with the seller of the call option.
The maximum loss for the call option seller is theoretically unlimited.
The maximum gain is $700 which is the premium the seller would receive. The breakeven price is also $107.
PUT OPTION BUYER
Let’s now look at the payoff diagrams for put options.
Using our theoretical ABC options again, let’s assume a $110 put is trading for $8 with ABC trading at $105.
The buyer of the put option pays $800 and this is the maximum they can lose on the trade. This occurs if ABC finished at $110 or above.
The maximum gain is unlimited until the stock hits $0, in which case the put would be worth $11,000, so the profit would be $11,000 less the $800 premium paid, so $10,200.
The breakeven price on the trade is $102 which is equal to the strike price of $110 less the $8 premium paid.
PUT OPTION SELLER
The maximum gain for the put option seller is limited to the amount of premium received which is $800.
The maximum loss is unlimited up until the point the stock reaches $0, in which case the loss would be $10,200.
The breakeven price is $102.
These four pay-off diagrams are the basis for more advanced option strategies.
By combining these positions, more elaborate and complex strategies can be created, but it’s important to have a solid understanding of these four diagrams before moving on to more complex strategies.
Risks When Trading Options
Options are not suitable for all investors.
In light of the risks associated with trading options, you should use them only if you are confident that you understand them and the risks.
Before you invest, you should carefully assess your experience, investment objectives, financial resources and all other relevant considerations, and of course consult your financial advisor.
Let’s take a quick look at some of the key risks when trading options:
MARKET RISKS
The market value of options is affected by a range of factors.
They may fall in price or become worthless on or before expiry.
Changes in the price of the underlying may result in changes to the price of an option, but the change can sometimes be in a different direction or of a different magnitude to the change in the price of the underlying.
LIQUIDITY RISK
Market Makers play an important role in the liquidity of the options market.
However, their obligations to provide quotes are not unqualified and your ability to trade out of a strategy may depend on you being able to obtain a quote from a Market Maker.
When markets become volatile, bid-ask spreads can widen and it can be difficult to close positions.
OPTIONS ARE A WASTING ASSET
Options have an expiry date and therefore a limited life. An option’s time value erodes over its life and this accelerates as an option nears expiry.
Buyers of options have limited time to for their view to be fulfilled.
LEVERAGE
The initial outlay of capital may be small relative to the total contract value with the result that options transactions are ‘leveraged’ or ‘geared’.
A relatively small market movement may have a proportionately larger impact on the value of the option.
This can work against you as well as for you. The use of leverage can lead to large losses as well as large gains.
OPTION SELLERS FACE POTENTIALLY UNLIMITED LOSSES
Writing (selling) options can involve considerably greater risks than buying options. The premium received by the writer (seller) is fixed and limited, however the writer may incur losses greater than that amount.
The writer who does not own the underlying shares or does not have offsetting positions potentially faces unlimited losses.
MARGIN CALLS
A trader’s liability in relation to a sold option contract is not limited to the amount of margin paid.
If the market moves against the position or margins are increased, the trader may be called upon to pay substantial additional funds on short notice to maintain the position.
If they fail to comply with a broker request for additional funds within the time prescribed, the broker may close out the position and the trader will be liable for any loss that might result.
The Best Options Brokers
There are dozens of options brokers to choose from. But which option broker is most suitable for you?
We will review three top rated brokers in this section to help you decide the one that best meets your needs.
The three brokers that we will discuss include Interactive Brokers, Thinkorswim and Tastyworks.
INTERACTIVE BROKERS REVIEW
Interactive brokers is a world renown broker that was founded in 1977.
They use a variable commission structure that is quite a bit different than many other Options brokers.
Based on their fee schedule, a client’s commission rate is calculated based on their trade size and value of each option.
As an example of this, the commission to buy a single call or put option priced between $.05 to $.10 would be $0.50 per contract with a minimum $1.00 fee.
The same minimum would apply for options priced below $.05 and those priced above $.10, however the per contract pricing for options priced over $0.10 would be $0.70, while the per contract fee would $0.25 for those under $0.05.
This variable commission schedule can be quite attractive for those that are trading multiple contracts and frequently utilizing far out of the money options.
One notable feature of IB’s pricing structure is that is does not charge a fee when options are exercised or assigned.
One of the biggest obstacles for many traders that wish to trade with Interactive brokers is their relatively high $10,000 minimum opening deposit.
Recently, however, they have lowered that amount to $3,000 for individual clients who are under the age of 25.
Additionally, if you are planning to trade using your IRA account, you will be able to do so with a minimum account of $5,000.
For the most part, Interactive Brokers has traditionally tried to cater to more experienced traders that have at least a few years of experience under their belt.
If you are an active options trader, that doesn’t require too much hand holding, and have a reasonable sized stake to fund an account, then Interactive Brokers should be at the top of your list of option brokers to consider.
I use Interactive Brokers and have put together some videos on how to use their platform if you want to check them out:
THINKORSWIM REVIEW
Thinkorswim is a free trading platform offered by TD Ameritrade.
It is a robust, professional grade platform for Options traders. It has a rich set of features that is second to none.
Serious traders and investors will enjoy advanced charting, real time data streaming, a wide range of technical indicators, and of course a full set of option trading tools.
For those that are interested in trying out the platform, they offer a paper trading program for users as a way to demo the platform.
They are an excellent choice for active traders who need to keep their transaction costs down.
Currently, TD Ameritrade does not charge commissions to trade stocks, ETFs or options.
The current option trading fees is based on a fixed $0.65 / contract basis. Additionally, there is no account minimum to open an account.
Here are a two key advantages of using thinkorswim:
Advanced trading tools – If you like to use technical indicators, or advanced charting tools such as Fibonacci or Regression channels, you will find these types of visual tools in abundance on the platform.
Additionally, as a thinkorswim user, you will have access to thousands of economic data points for both domestic and international markets.
Systematic traders can create their very own trading algorithms using thinkscript.
Low trading costs – Thinkorswim is a low cost leader in the options trading industry. They offer $0 per trade pricing on all stock and options trades.
You will only pay a small per contract fee for trading options. That fee currently is $0.65 / contract.
While there are many reasons to trade with thinkorswim, one might wonder if there are any downsides.
The main drawback that users experience when trading with thinkorswim is the following:
Learning the platform – There is a steep learning curve for beginning traders who want to start using the thinkorswim platform.
With all the advanced tools and bells and whistles that come with the platform, it can sometimes overwhelm newer traders at times.
Having said that, there is a very helpful learning center dashboard, where those new to the platform, can watch videos and review training manuals to help get up to speed with the platform.
TASTYWORKS REVIEW
Tastyworks is a fairly new broker within the industry.
They are affiliated with Tastytrade, a very popular online trading community, which was founded by Tom Sosnoff.
He was a key figure in the development of the Thinkorswim platform which he eventually sold to TD Ameritrade.
Regarding the fee structure for option trades, Tastyworks is quite competitive.
They offer a price of $ 1 per contract on equity options which is charged on the open side only.
Essentially that would equate to $0.50 per contract, if you were comparing their fee to other completing brokers.
In addition to this, multi leg option traders will be glad to hear that they offer a commission cap of $10 per leg.
The opening account minimum at Tastyworks depends on the type of account that a client opens.
For a Cash account, there is no minimum deposit required for opening an account. On the other hand, if you would like to open a margin account, then you will need to deposit $2,000 to open an account.
One of the biggest advantages of trading options through Tastyworks is their user friendly trading platform.
The platform is very intuitive and visually appealing. It has a rich set of features including a proprietary liquidity rating, and volatility rankings.
You will also find a list of notable stocks to watch based on various pre-defined parameters.
Their advanced platform technologies extends to their mobile app as well.
You can quickly and easily navigate through the mobile app without having to fumble around looking for what you need.
Tastyworks is an excellent choice for both novice and experienced option traders alike.
The platform has a relatively short learning curve, and is well suited for active options traders.
Each of the brokers on our list above are very reputable and most traders would do fine trading with either three.
However, generally speaking if you are new to the Options market, then you may find that Tastyworks suits you a bit better.
You may do well to start with them, and possibly move your way up to Thinkorswim or Interactive Brokers after gaining some experience.
Basic Option Strategies
Once you learn option trading, a whole new world will open up. A world where you can profit in any market condition.
The four trades that form the basis of all option strategies are – Long Call, Short Call, Long Put, Short Put.
I would also class Covered Calls as a “basic” option strategy as it is very easy for beginners to grasp and a logical place to start for those that are familiar with stock ownership.
Let take a look at the basic options strategies:
LONG CALL
The long call strategy is the most basic strategy where traders will buy call options with the belief that the underlying security will rise in price significantly before the expiration date.
Long calls can produce outsized returns in percentage terms when compared with owning the stock because of the inherent leverage within the option.
However, if the expected move does not eventuate before expiry, a 100% loss can occur.
The long call strategy has unlimited profit potential and the losses are limited to the amount of premium paid.
The breakeven price on the trade is equal to the strike price plus the premium paid.
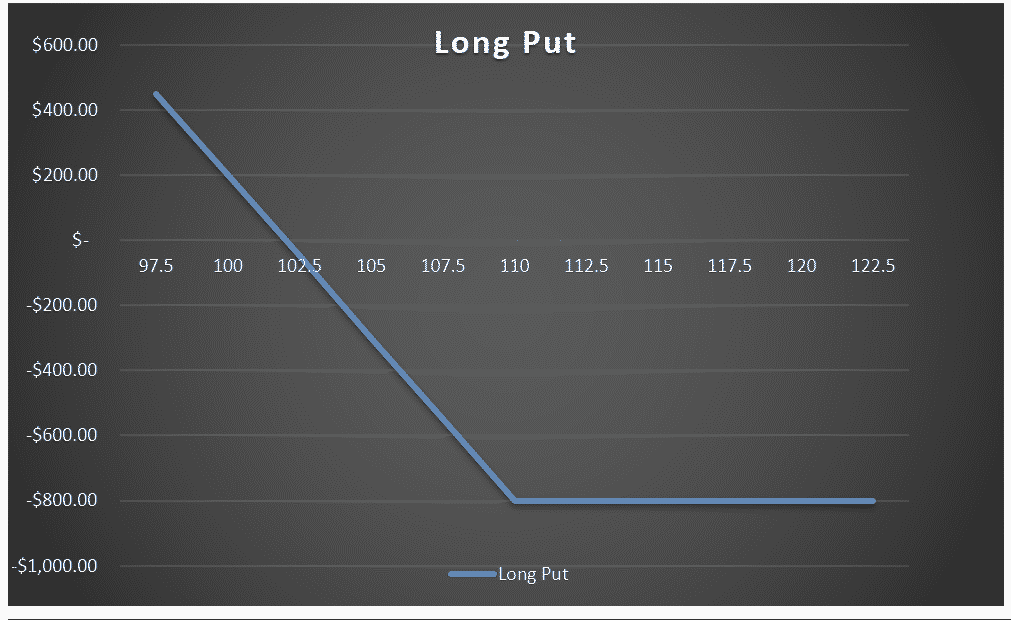
LONG PUT
The long put strategy is the opposite to a long call where traders are betting that the underlying stock will drop significantly before expiration.
Buying a put can be a more convenient way to short a stock compared with short selling where the trader has to borrow the stock to sell it short.
The profit potential is unlimited up to the point of the stock going to $0.
Risk are limited to the premium paid for the put. Compare that with short selling the stock where the losses are potentially unlimited.
The breakeven price is the strikes price minus the premium paid.
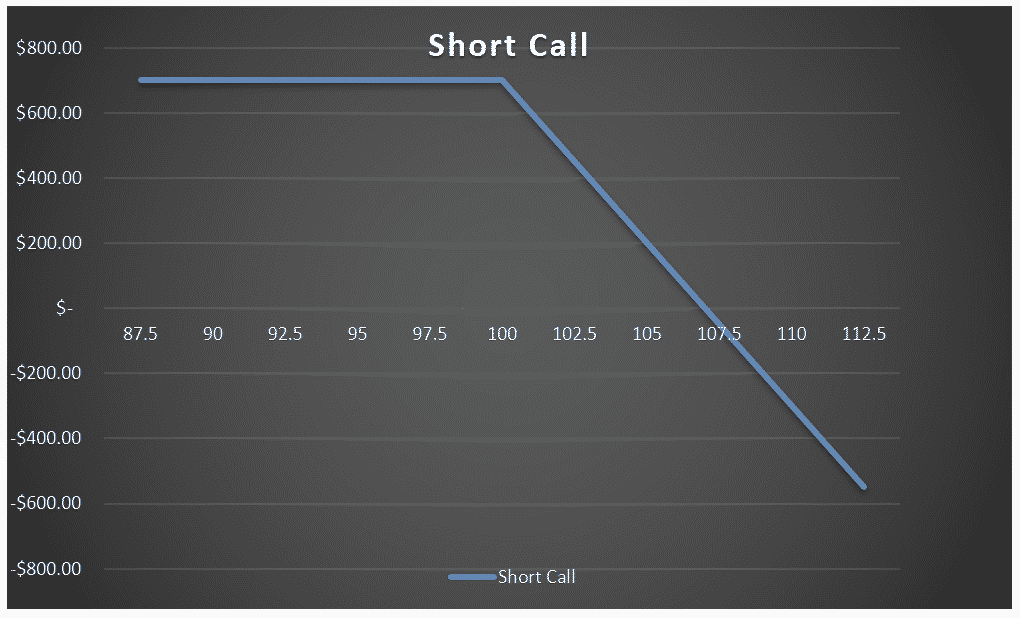
SHORT CALL
Instead of buying a call option, traders can sell them. This may be part of a Covered Call strategy which we’ll cover in a minute, but if the short call is not covered by either stock or a long call, then it is a naked position.
Selling a naked call can be very risky. The gains are limited to the premium received but the losses are potentially unlimited if the stock continues to rise.
For this reason, some brokers will not allow new traders to sell naked calls.
The breakeven price on the trade is the strike price plus the premium received.
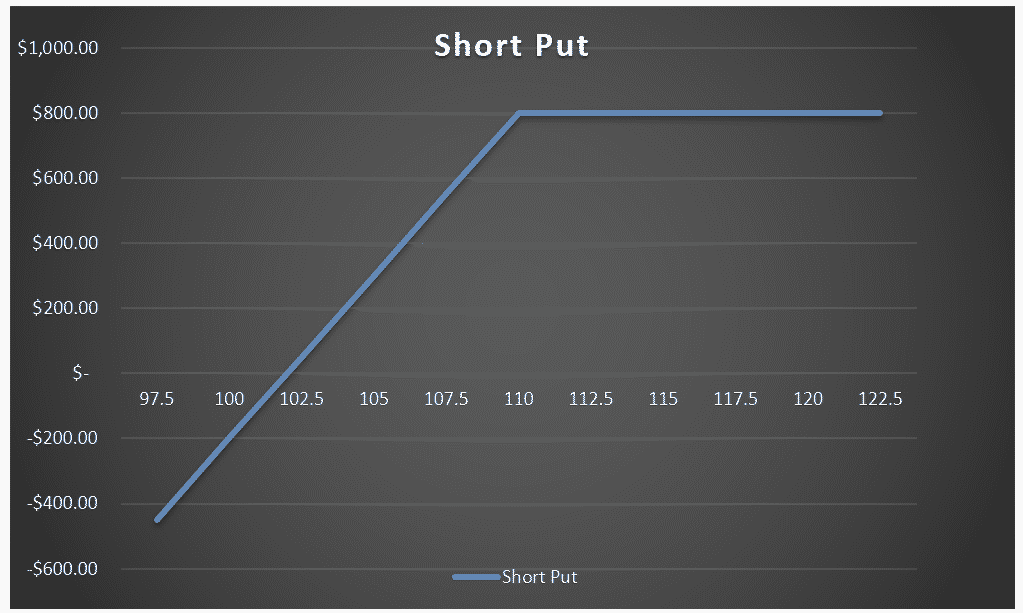
SHORT PUT
A short put strategy involves selling a put option which, similar to a short call, can either be covered or naked.
A covered put strategy is when a trader sells a put option and also holds a short position in the underlying shares.
This is not an overly common strategy because of the costs involved with holding the short stock position.
Naked puts and cash secured puts are much more common.
Selling a put option is a great way to take ownership of a stock at a price lower than it is trading on that day.
If the stock drops and the trader is assigned the shares, they can then hold the shares, collect the dividend and sell call options. This is a very powerful strategy that I call The Wheel.
The maximum profit on a short put is limited to the premium received and the potential losses are unlimited up to the point where the stock reaches $0.
COVERED CALL
I could talk for hours on Covered Calls. In fact, I’ve done just that in my Free Covered Call Course which you may want to check out.
The covered call is a strategy where calls are sold against a holding of the underlying security. For doing this, the investor is paid a premium which is theirs to keep.
They get to hold their shares and enjoy all the benefits including dividends and voting rights, unless the call option is exercised, and the shares are called away.
Covered calls are an income strategy where investors are aiming to increase the yield from holding stock.
Depending on the investors outlook they may place the call at-the-money to generate the most amount of income, or they may place the call out-of-the-money in order to maintain some capital appreciation potential.
FAQ
What Is Options Trading?
Options trading is a type of financial trading that involves buying and selling options contracts, which give the buyer the right (but not the obligation) to buy or sell an underlying asset at a specified price within a certain time frame.
It can be used to speculate on market movements or to hedge against potential losses.
What Are The Different Types Of Options?
The two main types of options are call options and put options.
A call option gives the buyer the right to buy an underlying asset at a specified price within a certain time frame, while a put option gives the buyer the right to sell an underlying asset at a specified price within a certain time frame.”
What Are Some Common Options Trading Strategies?
Some common options trading strategies include buying call options, buying put options, selling call options (also known as writing call options), selling put options (also known as writing put options), and using spreads (such as bull spreads or bear spreads).”
What Are Some Risks Associated With Options Trading?
Options trading can be risky and may result in significant losses.
Some of the risks associated with options trading include the potential for high volatility, the possibility of losing the entire premium paid for an option contract, and the risk of not being able to execute a trade at the desired price.
How Can I Get Started With Options Trading?
To get started with options trading, you can open a brokerage account with a reputable online broker that offers options trading.
You should also educate yourself on the basics of options trading, such as the different types of options, common options trading strategies, and the risks involved.
Option Definitions
American Style Option – An option contract that may be exercised at any time between the date of entry and the expiry. Most US and ASX options are American style.
Ask Price – The price at which a seller is offering to sell an option or stock.
Assignment – The receipt of an exercise notice by an option seller that obligates him to honour the option contact at the specified strike price.
At-the-money – The strike price of the option is equal to the current price of the underlying share.
Automatic Exercise – A protection procedure whereby there is an exercise of the option if it is in the money on expiry on behalf on the holder
Backwardation – The opposite of contango. Occurs when near month volatility is higher than far month volatility
Bid Price – The price at which a buyer is willing to buy an option or stock.
Black Scholes – A formula commonly used to determine the fair price of an option taking into account underlying price, time and volatility
Break-even – The price point at which the cost of a position is offset by the growth in its Value
Buy to open – Buy an option to open a new contract
Buy to close – Buy an option to close an existing sold contract
Buy-write – Covered call approach that involves buying stock and immediately selling a call
CBOE – The Chicago Board Options Exchange
Clearing House – A regulated body that ensure an orderly options market. The source of cash margin for uncovered sold options positions
Collateral – The loan value of marginable securities. These may offset the necessity for a “cash-margin” in uncovered sold options positions
Combination – A general term for any position involving two or more option legs e.g. Spreads/butterfly
Contango – A term originating from the oil market that indicates normal market conditions. This is when further month implied volatility is higher than nearer month
Contingent order – An order which can be executed only if another event occurs e.g. If the stock price is $x then buy option y
Contract size – The amount of underlying asset covered by the option contract. This is generally 100.
Cover – To buy to close a previously sold option.
Credit Spread –An option spread in which the premium received from the sold leg is larger than the premium paid for the bought leg, so bringing money into the account. Such positions are usually subject to a cash margin requirement
Day order – An order that expires at the end of the trading day if not executed
Debit Spread – An option spread in which the premium received from the sold leg is less than the premium paid for the bought leg, thereby bringing money into the account
Delta – The amount the value of an option will change for a 1c change in price in the underlying share.
Early Exercise (Assignment) – The exercise of an option contract before its expiry date (Only possible with American style options).
European Style Option – An option contract that may be exercised only during a specified period of time just prior to its expiration.
Exercise – To follow through on the rights of holding of an option, to buy (in the case of a call) or sell (in the case of a put) the underlying security.
Exercise Price – The price at which the option holder may buy or sell the underlying security. (see also strike price)
Expiration Date – The day at which after close of trading an option contract becomes void. In the US the third Friday in the month. On the ASX the Thursday before the last Friday in the month.
Extrinsic Value – Also known as “Premium Value” or “Time Value”. It is the difference between an option’s price and the intrinsic value
Fair Value – Normally, a term used to describe the worth of an option or futures contract as determined by a mathematical model. Also sometimes used to indicate intrinsic value. See also Intrinsic Value and Model.
Gamma – The rate of change in an option’s delta for a one cent change in the price of the underlying security.
Good Until Cancelled – An order that remains on the market until it is either filled or cancelled.
Greeks – A set of mathematical variables involved in the calculation of stock option prices e.g. Delta, Theta (time)
Historical Volatility – Volatility of past price movement of the underlying asset
Holder – The option buyer
Implied Volatility – A measure of the volatility of the underlying stock, it is determined by using option prices currently existing in the market at the time rather than using historical data on the price changes of the underlying stock. See also Volatility.
Index Option – An option whose underlying entity is an index. Most index options are cash-based.
In-the-money – An option that has some intrinsic value (i.e. Will have some value if today was the expiry day). E.g. in a call option – the strike price is lower than the current share price
Intrinsic Value – The value of an option if it were to expire immediately with the underlying stock at its current price; the amount by which an option is in-the-money. For call options, this is the difference between the stock price and the striking price, if that difference is a positive number, or zero otherwise. For put options it is the difference between the striking price and the stock price, if that difference is positive, and zero otherwise. See also In-the-Money, Time Value Premium and Parity.
Leg – In an option strategy involving one than one particular option, each option is known as a leg
Legging In – Entering/Exiting each leg of a combination options trading position separately.
Limit Order – An order to buy or sell at a specified price (the limit).
Liquidity –A reflection of the numbers of buyers and sellers and so the ease of getting in and out of a position at a close to fair value price. As a general rule the greater the liquidity the tighter the options spread
Margin – Buying by borrowing funds. The margin requirement – the maximum percentage of the investment that can be loaned by the broker
Margin Requirement – The amount an uncovered (naked) option seller is required to deposit. The margin requirement is calculated daily as so will change
Market Marker –An exchange member whose function is to aid in the making of a market through creating a spread where one may not already exist
Market Order – An order to buy or sell at the current market price e.g. If you are selling you will pay the bid price.
Mark To Market – An accounting process by which the price of securities held in account are valued each day to reflect the last sale price or market quote.
Naked Option – An option which has been sold that is not covered by the underlying security or another option contract.
Offer – the price at which the seller is willing to sell
Open Interest –The number of existing option contracts in a particular series. Together with daily traded volume is an indication of liquidity.
Options Clearing Corporation (OCC) – Provides clearing and settlement services for option trades. The largest equity derivatives clearing organization in the world.
Out-of-the-money –An option where the strike price is greater than the current price of the underlying security (call option), or visa versa with a put option
Position Delta – The sum of all positive and negative deltas in a hedged position
Premium – The price of an option contract, determined in the competitive marketplace, which the buyer of the option pays to the option writer for the rights conveyed by the option contract.
Rho – The expected change in the value of an option for a 1 percent change in interest rates.
Roll Down – Close out an initial option position at one strike and simultaneously open another in the same underlying stock at a lower strike.
Roll Out – Close-out an initial option position with a near-term expiry date and open the position with a longer-term expiry date.
Roll Up – Close out an initial option position at one strike and simultaneously open another in the same underlying stock at a higher strike.
Strike Price – The specific price per share for which the underlying security may be purchased (in the case of a call) or sold (in the case of a put) by the option buyer if exercised.
Theta – A measure of the rate of change in an option value for a one-day change in time left to expiry.
Time Decay – General term used to describe how the theoretical value of an option decreases as the expiry date draws nearer. Calculated using theta.
Vega – A measure of the rate of change in an option’s theoretical value for a one-unit change in the volatility assumption.
Volatility – A measure of how much a stock generally fluctuates in price. Some sectors are historically more volatile than others e.g. Materials V health care
Disclaimer: The information above is for educational purposes only and should not be treated as investment advice. The strategy presented would not be suitable for investors who are not familiar with exchange traded options. Any readers interested in this strategy should do their own research and seek advice from a licensed financial adviser.

[1] Investopedia: https://www.investopedia.com/terms/e/expirationdate.asp


