
Contents
- What Is The Expected Move?
- Determining the Expected Move
- An Easier Method
- A Word On Delta
- When To Use The Expected Move
- FAQ
- Conclusion
As major events such as earnings announcements, political events, etc., occur in the market, investors and traders begin to speculate on the future direction and price of assets.
Every day there are events transpiring around the world which can cause downstream impacts to markets and stock prices.
From local events such as company earnings reports through to global macro events such as Brexit, wars and terrorist attacks, these events generate significant volatility in asset prices as investors and traders hedge their portfolios and make directional bets on the future price of stocks.
These moves by investors and traders serve to drive changes in implied volatility, which in turn, affect options premiums.
Implied volatility is a prediction of the future movement of the stock.
When market participants expect price moves to be high, implied volatility will increase.
Once an event has occurred, such as an earnings announcement, the uncertainty around the short-term movement of the stock has been removed.
As a result, changes become priced in, the stock moves accordingly and there is a corresponding drop in volatility and option premiums.
This drop is sometimes referred to as the implied volatility crush.
For traders seeking to make profits from events, having a model to predict the possible range of market prices would be an invaluable tool.
Fortunately a model does exist and it is called the Expected Move.
What Is The Expected Move?
The Expected Move represents the expected market movement range for an underlying, for the future. More specifically, it is the future range of a stock’s price at one standard deviation.
Standard deviation is a statistical measure. By using probabilities, mathematicians can calculate the likelihood of an outcome relative to the average possible outcome.
As an example, if we had a stock price range of $60 – $80 for 1 standard deviation, this would mean that the stock would have a 68% chance of falling within the $60 – $80 range.
Why 68%? Mathematicians have determined that 1 standard deviation represents approximately 68% of all outcomes, 2 standard deviations represent approximately 95% of all outcomes and 3 standard deviations represent approximately 99% of outcomes.
What this means for traders is that it allows them to look at an entire range of possible values and determine the likelihood of a certain range being achieved.
This can be useful for sanity checking a position, providing price targets and managing your risk.
Now that we understand what the Expected Move is, we will turn our attention to how it is determined.
Determining the Expected Move
The simplest way to determine the Expected Move is to get it from the option chain on your broker platform.
If it’s not available there, you have two other options. The first is a simple calculation using the option chain while the second is a detailed manual calculation.
For the simpler calculation, you can use what’s called the At-The-Money-Straddle.
Look up the option chain and simply add together the price of the At-The-Money Put option with the At-The-Money Call option. While this approach isn’t as accurate as the detailed calculation, it does serve as a reasonably accurate estimate.
For a more accurate value, use the detailed formula. There are three variables that are used to calculate the Expected Move. These are:
- The stock price
- Implied Volatility
- Days to Expiration
Once you have values for these variables, use the following equation:
Expected Move = Stock Price x (Implied Volatility / 100) x square root of (Days to Expiration / 365)
When using this formula, pay careful attention to which implied volatility value you use. The reason being is that a stock can have multiple implied volatilities as there are multiple expiration cycles.
Always use the implied volatility value in the expiration cycle that is closest to the days to expiration you are using.
For example, say you had a 7 day implied volatility value and a 40 day implied volatility and you wanted to determine the Expected Move of the stock over the next 42 days.
In this case you should use the 40 day implied volatility value in your calculation.
An Easier Method for Calculating the Expected Move
There is another method that I find much easier than the above.
Simply take the price of the at-the-money call and at-the-money put for the expiration date you are interested in.
Add them together and that is the expected move.
You can divide this number by the stock price to get the percentage expected move.
Let’s look at an example:
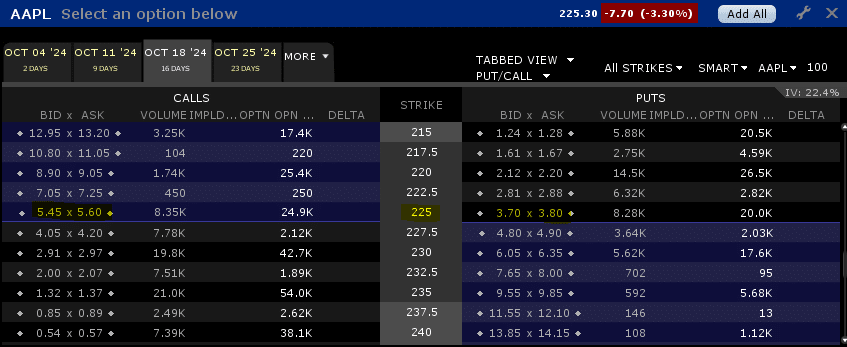
Date: October 2nd, 2024
AAPL Stock Price: 225.30
October ATM Options: (5.525 + 3.75) = $9.275

Now we know that the options market is pricing in a $9.275 move in either direction between now and October 18th.
In percentage terms, that is a move of 4.12% up or down.
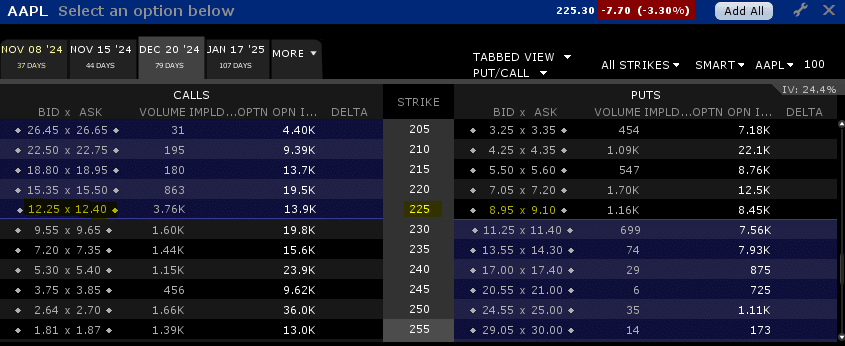
If we use a longer time period, the expected move will be higher.
December ATM Options: (12.325 + 9.025) = $21.35 or 9.48%

A Word On Delta
Another clever way that traders can work out the expected market range of a stock is through the use of Delta, one of the main option Greeks.
The Delta value can be found on the option chain and represents how much the price of the option will change based on the change in price of the underlying stock.
For example, if the option chain shows 0.30 delta, it means that for every $1 move in the underlying stock price, the price of the option will move by $0.30.
Depending on the type of option, the delta will be positive or negative. For call options, delta is always positive, while for put options, delta is always negative.
Now that you know what the Expected Move is and how to determine it, we can now turn our attention to when to use it.
When To Use The Expected Move
The primary benefit of knowing the Expected Move is to aid in risk management.
By knowing the Expected Move, traders can have a useful data point that can influence the level of risk they’re willing to accept.
Say for example you’ve entered a trade that is having a large bull move. How do you know when it’s time to take profits?
One way could be by looking at the Expected Move, knowing that the further it is above the range, the less likely the trend will continue.
In this way you remove emotion and instead focus on the use of statistics and probabilistic outcomes.
FAQ
What Is The Expected Move Of A Stock?
The expected move of a stock is the amount the stock price is expected to move up or down during a specified period of time.
This can be calculated using options pricing models and can help traders anticipate potential price movements.
How Is The Expected Move Of A Stock Calculated?
The expected move of a stock can be calculated using options pricing models such as the Black-Scholes model or the binomial model.
These models take into account factors such as the stock price, the option strike price, the time until expiration, and the implied volatility of the options.
What Is Implied Volatility?
Implied volatility is a measure of the market’s expectations for how much a stock’s price is likely to fluctuate in the future.
It is derived from the price of options and reflects the degree of uncertainty or risk in the market regarding the future price movements of the stock.
How Can I Use The Expected Move Of A Stock In My Trading?
Knowing the expected move of a stock can help you make more informed trading decisions. For example, if the expected move is large, you may want to use options strategies that benefit from high volatility.
If the expected move is small, you may want to use options strategies that benefit from low volatility.
Are There Any Limitations To Using The Expected Move Of A Stock?
While the expected move of a stock can be a useful tool for traders, it is important to remember that it is only an estimate based on options pricing models.
Actual price movements may differ from the expected move, and unexpected events or news can cause significant price movements in the stock.
Conclusion
The Expected Move gives traders the opportunity to calculate the expected market movement range for an underlying.
No prediction is every 100% accurate but alongside Delta, when used wisely, it forms a useful measure for supporting risk management and hedging in a portfolio through a quantitative method.
Trade safe!
Disclaimer: The information above is for educational purposes only and should not be treated as investment advice. The strategy presented would not be suitable for investors who are not familiar with exchange traded options. Any readers interested in this strategy should do their own research and seek advice from a licensed financial adviser.


thanks for the blog. the actual calculation also has a 0.8 in it. because the exact formiula is sqrt(2/pi) * vol * S * sqrt(t/365)