


Butterfly spreads are one of the most popular trades among professional traders, second only to Iron Condors.
The are amazingly versatile and unlike Condors, they have a favorable risk/reward ratio.
You’re going to learn more today about Butterflies than you thought possible, so grab a coffee and strap in.
Contents
- The Basics – What Is A Butterfly Spread?
- Why Trade Butterflies
- Things To Keep In Mind When Trading Butterflies
- Entering Trades In Your Brokerage Account
- How To Set Profit Targets and Stop Losses
- How to Choose Strike Widths
- How To Successfully Leg Into A Butterfly
- Butterfly Trading Rules
- Adjusting Butterfly Trades
- Butterfly Spread Greeks
- Using Directional Butterflies
- Protecting Against Fast Moves
- Broken Wing Butterflies
- Bearish Butterflies
- Butterflies As Part of a Combination Strategy
- Butterflies As a Hedge
- Weekly Double Butterflies
- Reverse Butterflies
- FAQ
- Conclusion
The Basics – What Is A Butterfly Spread?
A butterfly is a neutral (generally), income-oriented strategy. It is a limited risk and limited profit trade, but on a typical butterfly trade, the profit potential is higher than the potential loss.
Butterfly spreads involve 3 different option strike prices, all within the same expiration date, and can be created using either calls or puts. A typical butterfly would be constructed as follows:
Buy 1 in-the-money call
Sell 2 at-the-money calls
Buy 1 out-of-the-money call
The in-the-money and out-of-the-money calls are placed at an equal distance from the short strike. A butterfly trade is entered for a net debit which means money will be deducted from your account once the trade is placed.
This is the maximum amount that you can lose from the trade. The maximum profit is calculated as the difference between the short and long calls less the premium that you paid for the spread.
For example if you had the following butterfly spread:
Long 1 June $95 call @ $5.00
Short 2 June $100 calls @ $2.50
Long 1 June $105 call @ $1.00
The total net debit to enter this trade is $1, which means the maximum profit is $4. This is calculated as the difference in the strike prices from the short to long strikes ($5) less the premium paid ($1).
The potential return on investment is 400% and this would occur if the stock closed exactly at $100 at expiration. You should be aware the achieving the full 400% return is extremely unlikely, but more on that later.
The breakeven points for a butterfly are calculated as follows:
Downside breakeven = lower call PLUS premium paid ($95 + $1) = $96
Upside breakeven = higher call LESS premium paid ($105 – $1) = $104
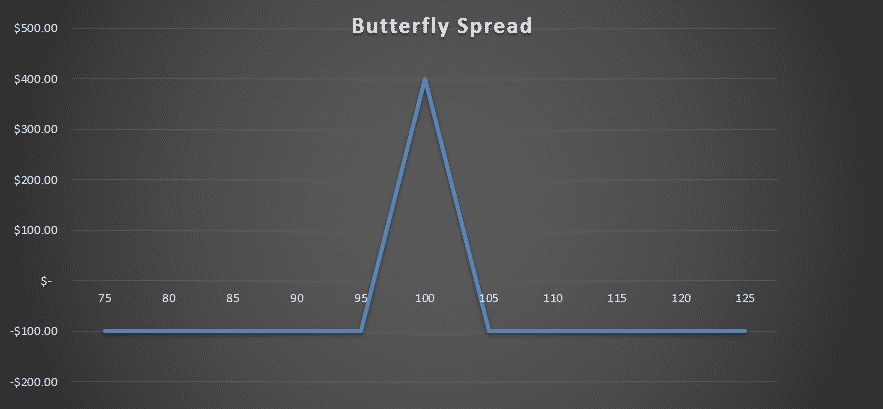
In this example, the maximum loss will be incurred if the stock closes at $96 or below and at $104 or above. You can see this on the diagram below.
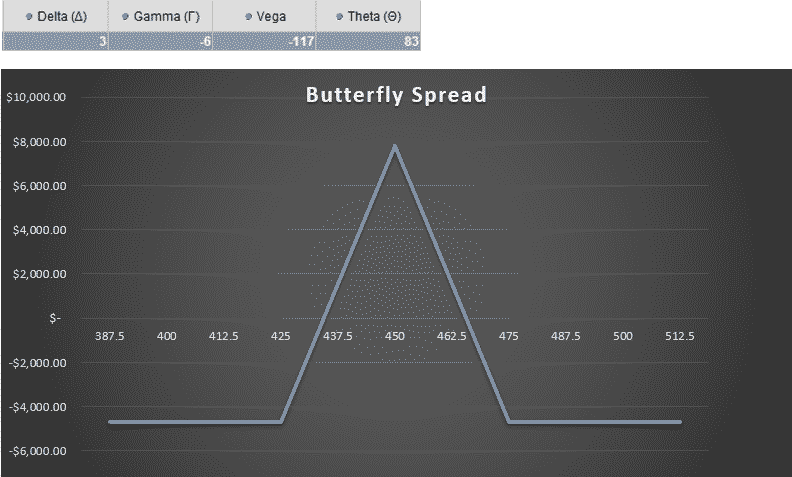
THE BUTTERFLY PAYOFF DIAGRAM
As you can see above the butterfly payoff diagram, or expiration graph, has a tent-like shape with the potential for very large profits around the short strike. It’s important to keep in mind that it’s unlikely you would ever achieve the maximum profit.
In fact, some traders say that you should basically ignore the top one-third of the butterfly expiration graph, as it unlikely and unrealistic that your trade will finish in that area.
The other problem with the top third of the butterfly graph is that profits will fluctuate wildly, even with only small movements in the underlying due to the high level of short gamma.
The closer you get to expiry, the higher the gamma will become, and the more your profits will fluctuate.
A good aim for a butterfly trade is to make a 15-20% return on capital at risk.
SHOULD YOU USE CALLS OR PUTS?
Butterflies can be traded with either calls or puts, it doesn’t really matter. You can also trade an iron butterfly, which uses BOTH calls and puts. An iron butterfly is basically a combination of a bear call spread and a bull puts spread.
Generally speaking, traders will use calls for neutral and bullish butterflies and puts for bearish butterflies but there is no real hard and fast rule. Iron condor traders may prefer to trade iron butterflies.
Advanced traders might look at the relative skews of calls to puts.
If puts are much more expensive due to significantly higher levels of implied volatility, they may prefer to use puts, but generally speaking the payoff is going to be very similar whether you use calls, puts or both.
Why Trade Butterflies?
Unlike other options strategies such as iron condors and credit spreads, butterflies are very dynamic and can be traded for a variety of different reasons with different goals in mind. Some reasons to trade butterflies include:
Income – Butterflies are a great way to generate income from stocks you think are going nowhere in the short term. This can contribute to overall portfolio returns in flat markets.
Non-Directional – In their simplest form, butterflies are delta neutral or non-directional trades. Trying to pick the direction of stocks or the overall market can be stressful and expensive.
Delta neutral butterflies can be set up with strict rules to take the guesswork out of trading.
Hedging – Market makers and advanced traders often use directional butterflies as a short term hedge on positions that are moving against them.
Centering the profit tent of a butterfly around a strike that is under pressure in another trade (such as a credit spread) can be a great way to control risk and allow you to keep the original position open for a few more days.
Sometimes that is all you need for a trade to move back in your favor.
At that point you can then remove the butterfly hedge and stick with your original trade. Long-term out-of-the-money put butterflies can also be a much cheaper method of portfolio protection than pure long puts.
Low Maintenance – Butterflies are sometimes called “vacation trades” due to their low risk and need for only very infrequent monitoring. Butterfly trades are generally very slow moving early on in the trade.
They can get a little exciting and volatile when you get closer to expiry and are within the profit tent though.
Things To Keep In Mind When Trading Butterflies
Butterflies are a commission intensive strategy as you are trading 4 contracts each time you enter a trade, and 4 contracts when you exit a trade.
As most brokers charge transactions fees on a per contract basis, this can soon add up and should be taken into account when evaluating whether butterfly spreads are right for you.
The greeks will be discussed in detail shortly, but basically butterflies are short volatility, short gamma and long theta.
Gamma is a very important aspect to be aware of when trading butterflies, particularly as you get closer to expiry.
When trading multi-legged options strategies as one order, the bid-ask spreads can be significant and therefore make it difficult to initiate a trade for a decent price.
If you choose to enter the 3 legs individually, you run the risk of the market moving against you before having the entire position opened.
You can move the center strike of a butterfly slightly in-the-money or out-of-the-money to reduce the cost, however this gives the trade a directional bias.
Sometimes this can be a good thing and we will discuss directional butterflies in detail shortly.
Entering Trades In Your Brokerage Account
The easiest way for beginners to enter a butterfly is to create a single order in your broker’s option trader module.
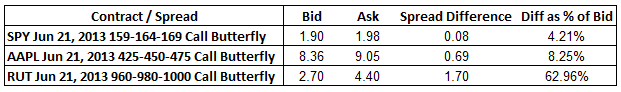
However, butterflies can be tricky to get filled on when entered as one order. In addition, the bid-ask spreads can be quite wide depending on the underlying stock that you are trading. You can see below, 3 separate butterfly spreads.
SPY being the most liquid of the 3, has the tightest of the 3 spreads with only $0.08 between the bid and the ask. AAPL is has a slightly higher spread on both a dollar and percentage basis with a spread of $0.69.
RUT is the least liquid of all with a massive difference between the bid and ask prices, on both a percentage and dollar basis.
The dollar spread of $1.70 is very high; you might be able to get filled close to the mid-point, but you run the risk of some slippage here if you are looking to trade butterflies on RUT. Definitely something to keep in mind.
Entering Butterflies As A Debit Spread And A Credit Spread
If you’re having trouble getting filled on your single butterfly order, or you don’t like the look of those bid-ask spreads, another way to enter your butterfly is as a debit spread and a credit spread.
After all, that’s all a butterfly is – a combination of a debit spread and credit spread.
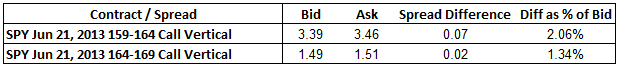
Looking at our AAPL example, you would buy 1 AAPL June 21 $425 – $450 debit call spread and sell 1 AAPL June 21 $450 – $475 credit call spread.
You’re looking at a bid-ask spread of $0.40 on the debit spread and $0.16 on the credit spread.
The total spread is less than our butterfly trade ($0.56 v $0.69). You will also find it easier to get filled on two vertical spreads rather than one butterfly spread.

The SPY spreads are fairly similar which makes sense given the huge levels of liquidity. Trading the two vertical spreads has a total bid-ask spread of $0.09 compared to the single butterfly order at $0.08.
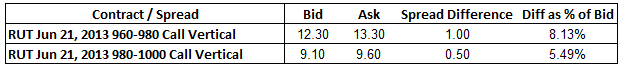
The bid-ask spread on RUT is similar to AAPL in that it is slightly lower when entering at two vertical spreads – $1.50 v $1.70. So for RUT you will find it easier getting filled using the two vertical spread method.
When starting out with butterfly trades, it is prudent to start trading highly liquid stocks and ETF’s. SPY is one of the most liquid instruments in the world, so this would be a good place to start for your butterfly trades.
Try entering your trades via the two methods presented above and see which method is easier to get filled.
Once you become familiar and confident with entering the trades and getting filled, you can then move on to trading other instruments and trading different variations of the butterfly which we will discuss shortly.
How To Set Profit Targets And Stop Losses
When trading butterflies it is easy to get caught up in the hope (a very dangerous word in the stock market) of achieving the full profit as shown in the payoff diagram.
As mentioned previously, it is extremely unlikely that you will achieve the full profit potential on a butterfly trade. A good aim for a butterfly trade is a 15-20% return on capital at risk and the maximum acceptable loss should also be around the 15-20% level.
As with most income strategies, you need to make sure when you have a losing trade, you are not losing much more than the typical gain you are making from your winning trades.
Typically you should set a hard stop loss at 1.5 times the average gain. So if you are generally making 15% on your butterflies, your maximum loss on any trade should be around 20-25%.
When taking profits, you can also set time-based rules for taking profits. For example, if you have made 10% within 10 days of opening a 35 day trade, that might be a really good place to take profits even though your initial target was 15%.
Achieving a healthy 10% return that early in a trade is a great thing and sometimes it’s best to just say “thank you very much” and wait for the next opportunity.
How To Choose Strike Widths
Where you place your wings (which are the bought options in a butterfly spread) is a matter of personal preference and will also depend on which instrument you are trading.
How far apart you place the wings will determine how “fat” or “skinny” your butterfly payoff diagram looks.
Spreading the strikes out a long way can increase the profit potential and move the breakeven points in your favor, but it comes with the cost of having to allocate more capital to the trade.
Let’s take AAPL for example. In the following three diagrams, you will see three different butterfly trades for the same expiration date, all centered around the at-the-money strike of $450. First we’ll look at a trade with 10 point wide wings, then 25 points and then 50 points.
AAPL 10 POINT WIDE BUTTERFLY
Date: June 4, 2013
Current Price: $446
Trade Set Up:
Buy 5 AAPL June 20th, 440 calls @ $16.00
Sell 10 AAPL June 20th, 450 calls @ $10.25
Buy 5 AAPL June 20th, 460 calls @ $6.05
Premium: $775 Net Debit.

AAPL 25 POINT WIDE BUTTERFLY
Date: June 4, 2013
Current Price: $446
Trade Set Up:
Buy 5 AAPL June 20th, 425 calls @ $27.50
Sell 10 AAPL June 20th, 450 calls @ $10.25
Buy 5 AAPL June 20th, 475 calls @ $2.44
Premium: $4,720 Net Debit.
AAPL 50 POINT WIDE BUTTERFLY
Date: June 4, 2013
Current Price: $446
Trade Set Up:
Buy 5 AAPL June 20th, 400 calls @ $50.90
Sell 10 AAPL June 20th, 450 calls @ $10.25
Buy 5 AAPL June 20th, 500 calls @ $0.49
Premium: $15,445 Net Debit.

Rather than discuss the three variations individually, I feel it’s best to present some of the key information in table format so we can compare.
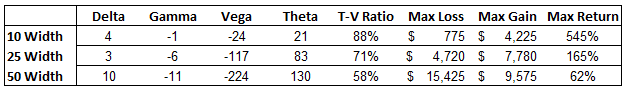
Looking at the above table, you can see that there are some obvious differences between the three variations.
All of them are more or less delta neutral, the 50 width butterfly has a slightly higher delta, but it’s still fairly neutral.
The big differences come in when you look at the capital at risk (max loss), the potential return and the Theta-Vega exposure.
The narrower butterflies require much less capital and therefore have a lower maximum loss.
The potential maximum gain compared to the maximum loss is much higher for the narrow butterflies. The trade-off with this is that the wider butterflies have a much higher range and therefore likelihood of profit.
The Vega exposure is another key difference; you can see that the 50 width butterfly has a Vega exposure that is 10 times higher than the 10 width butterfly.
If you have a strong view that implied volatility is going to fall, you are better off trading the 50 width butterfly.
The Theta to Vega ratio for the 10 width butterfly is almost one-to-one whereas the ratio for the 50 width butterfly is just over 50%. A higher Theta to Vega ratio gives you more capacity to withstand rising volatility.
An as example, if volatility increases 1 percent on day one of the trade, the 10 width butterfly with lose around $24, but will gain around $21 in Theta decay which basically offsets the loss from increased volatility.
The 50 width butterfly will lose $224 dollars from Vega and only gain $130 from Theta decay.
Based on the all of the information presented above, I think the 25 width butterfly presents the best scenario.
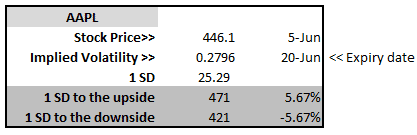
USING STANDARD DEVIATION TO SELECT WINGS
Another consideration on where to place the wings is to see what a one standard deviation move in the underlying instrument would look like.
To calculate one standard deviation you take price x volatility x the square root of the days to expiry / 365.
If that formula seems complex, don’t worry, I’ve created a simple to use spreadsheet which you can download from https://optionstradingiq.com/standard-deviation-calculator/.
While the stock market is filled with statistical anomalies, generally a stock will stay with a range of plus or minus one standard deviation about 68% of the time.
So if you place your wings around one standard deviation away from the current price, you will have a winning trade roughly 2 times out of every 3. Of course, nothing is guaranteed in the stock market!
Using the AAPL example above and my standard deviation calculator, you can see that a one standard deviation move over the course of this trade would put AAPL at either $472 or $420, so our 25 point wide butterfly looks like a good option, or we could even stretch that out to 30 points in order to get our strikes around the one standard deviation mark.
How To Successfully Leg Into A Butterfly
Legging into a butterfly spread should only be attempted by advanced traders or those with at least one years’ experience of trading butterflies.
Legging into trades involves more risk because you are basically taking a directional view prior to implementing the full butterfly spread. If that directional view turns out to be wrong, you are behind the 8-ball from the start, and it’s a struggle to work your way back.
That being said, if your directional opinion is correct, you can end up with a substantial profit or even risk free trade that you can ride into expiration.
We’ll take a look at a couple of different ways to leg into a butterfly – using a long call, using a debit spread and using a credit spread.
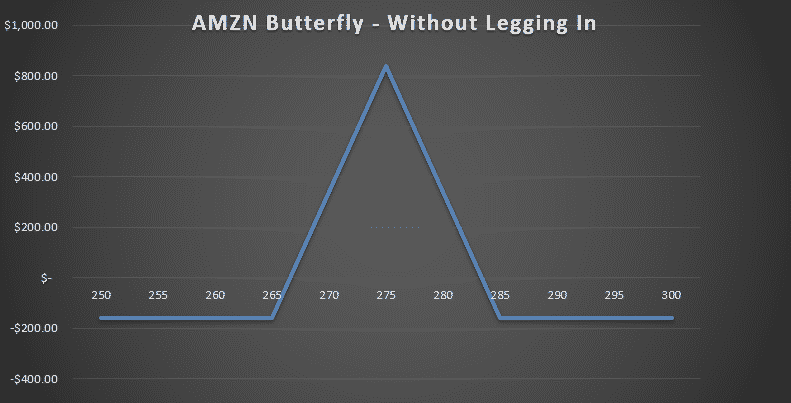
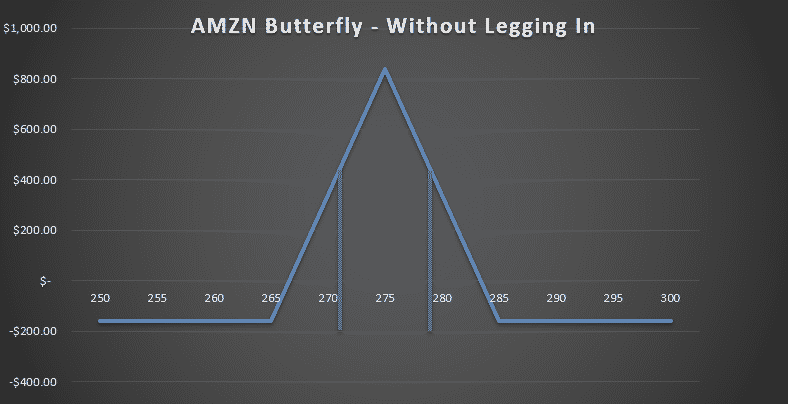
First, let’s look at a standard butterfly so we can compare:
Date: June 4th 2013,
Current Price: $265
Trade Details: AMZN Butterfly Spread
Buy 1 AMZN July 19th $265 call @ $10.00
Sell 2 AMZN July 19th $275 calls @ $5.75
Buy 1 AMZN July 19th $285 call @ $3.10
Premium: $160 Net debit
LEGGING IN WITH A LONG CALL
Suppose you were bullish on AMZN and decided to leg in using a long call. On June 4th, with AMZN trading around $265, you buy a July 20th $265 call option for $10.00.
Two days later, AMZN has rallied to $275. You then sell two July $275 calls and buy one July $285 call. Here are the details of the trade:
Date: June 4th 2013,
Current Price: $265
Trade Details: Legging in to a butterfly with a long call
Buy 1 AMZN July 19th $265 call @ $10.00
Two days later, AMZN has risen to $275.
Date: June 6th 2013,
Current Price: $275
Trade Details: Completing the butterfly
Sell 2 AMZN July 19th $275 calls @ $11.10
Buy 1 AMZN July 19th $285 call @ $6.70
Premium: $550 Total Net Credit
You now have a riskless butterfly where you will make at least $550. Even though you are selling more options than you are buying with the second trade, your broker will realize you already have one long call, so this will not be considered a naked trade.
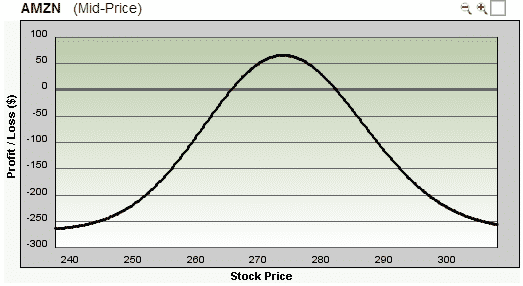
Here’s how the payoff diagram looks, you can see that this trade will make at least $550 no matter where AMZN finished at expiry.
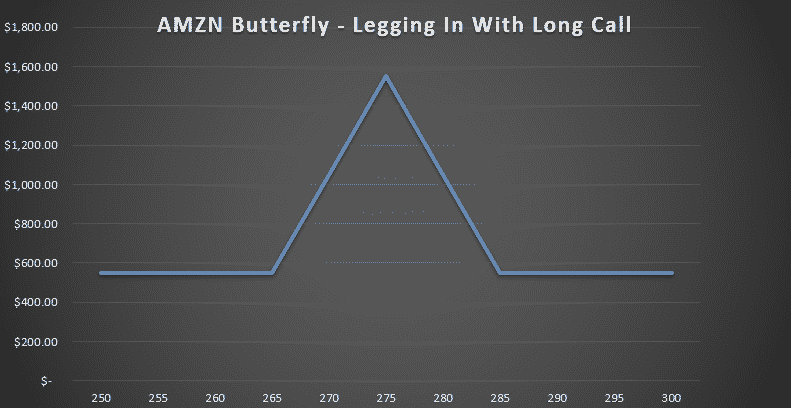
Of course, this is all very easy in hindsight and much harder to do in practice, but you can see that legging in to butterflies can be very lucrative if you can get your timing right.
Imagine for example, that you were legging in to this trade, but AMZN dropped $10 rather than rising $10.
At that point you would either have to close out your long call for a loss, or if you complete the butterfly, you would have a position where the majority of the profit tent is below the profit line.
LEGGING IN WITH A DEBIT SPREAD
Legging in to a butterfly with a debit spread follows a similar logic to using a long call, but the risk and delta exposure are much lower. Taking our previous AMZN example, let’s take a look at how this might work.
Date: June 4th 2013,
Current Price: $265
Trade Details: Legging in to a butterfly with a bull call debit spread
Buy 1 AMZN July 19th $265 call @ $10.00
Sell 1 AMZN July 19th $275 call @ $5.75
Date: June 6th 2013,
Current Price: $275
Trade Details: Completing the butterfly with a bear call credit spread
Sell 1 AMZN July 19th $275 call @ $11.10
Buy 1 AMZN July 19th $285 call @ $6.70
Premium: $15 Net Credit
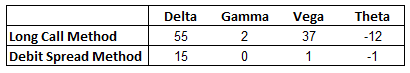
By legging in to the butterfly with a debit spread, we have still managed to create a risk free trade, although our profit will be smaller than legging in with just a long call. Keep in mind though that our risk on the second trade is lower.
We only had to use $425 to create the second position rather than $1,000.

Let’s also compare the greeks of the two methods. You can see that there is a much larger exposure to both Delta and Vega when using the long call method.
A slightly less significant consideration is the faster Theta decay, but considering you would only hold the long call for 1-2 days before completing the butterfly, this should not be your primary concern.
The long call method of legging in has higher potential profits, but as you would expect, along with that come higher risks.
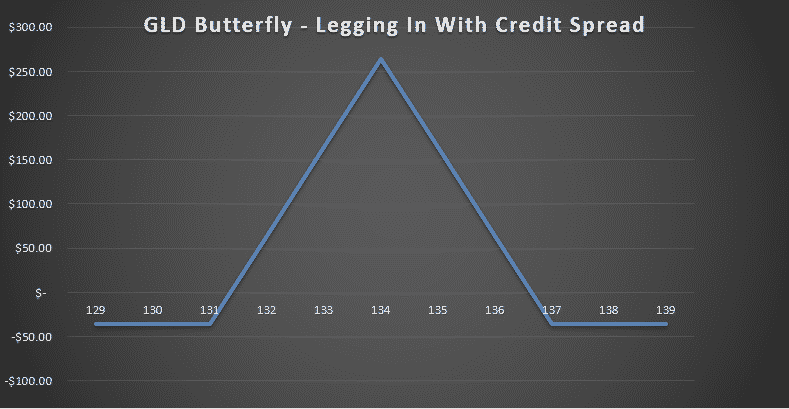
LEGGING IN WITH A CREDIT SPREAD
Another method for legging in to a butterfly would be to use a credit spread. As the previous examples have been on a rising stock, let’s take a look at a falling stock – GLD
Date: July 4th 2013,
Current Price: $135
Trade Details: Legging in with a bear call credit spread
Sell 1 GLD July 19th $134 call @ $4.25
Buy 1 GLD July 19th $137 call @ $2.81
Two days later, GLD has fallen to $134.
Date: July 6th 2013,
Current Price: $134
Trade Details: Completing the butterfly with bull call debit spread
Buy 1 GLD July 19th $131 call @ $5.15
Sell 1 GLD July 19th $134 call @ $3.35
Premium: $36 Net Debit
This trade example doesn’t quite give you a risk free trade, but $36 is still very low and gives you a potential profit of $264.
Reasons with you might want to leg in with a credit spread rather than a debit spread include:
- Decreasing Volatility – If you think volatility will decrease, initiating the trade with a credit spread will give you a short Vega exposure
- Time Decay – Even if it is just 1-2 days, initiating with a credit spread means time decay is working in your favor rather than against you as with a debit spread.
If you are bullish on a stock, you can also leg in using a bull put credit spread. I won’t go through the details as I think you get the idea. Basically you enter a bull put spread to start, then once the stock has risen, you buy a bear put spread.
Butterfly Trading Rules Including Entry And Exit Signals
There are many variations when trading butterflies, but for now let’s look at a standard delta neutral butterfly and come up with some trading rules.
UNDERLYING INSTRUMENTS
The underlying instrument on which to trade butterflies is a key consideration. Highly liquid stocks and ETF’s will help reduce slippage due to narrower bid-ask spreads, so this should be the first place to look for trades.
The other advantage of ETF’s and Indexes are that you don’t have to worry about earnings reports. If a stock is reporting earnings during the life of your butterfly trade, it is likely to have a huge move, not something you want on a delta neutral trade.
Most indexes are European style so there is no risk of early assignment, which can be a problem for butterfly traders. This allows you to hold butterflies on indexes until closer to expiry and potentially achieve higher profits.
Indexes such as SPX, RUT and NDX are great targets for butterflies.
For individual stocks, you want to be looking for stocks that are trading for at least $75 and preferably over $100. The distance between strike prices is more favorable and you can trade fewer contracts which help keep trading costs down.
TIME TO EXPIRY
For butterflies you generally want to be looking at the monthly expiration cycle, particularly for beginners. Weekly options can be very risky no matter which trading strategy you are using.
The sweet spot is anywhere from 30-45 days to expiry but some traders may also go out as far as 60 days. The minimum time to expiry should be no less than 30 days though.
VOLATILITY LEVELS
We know that butterflies are short volatility trades and that a spike in implied volatility will hurt us, so it makes sense to enter butterflies when volatility is high. However, volatility can be a double-edged sword. Sometimes high volatility breeds more volatility.
Also if you enter a butterfly when volatility has spiked, that generally means the market has sold off sharply. Reversals from those selloffs can be equally as sharp, which could mean the price blows right back through the upper strike of our butterfly.
Ideally what we want is a period of steady or slightly declining volatility over the course of the trade, particularly during the first 10-15 days. It therefore makes sense to look for an ideal range of volatility levels.
You don’t want to trade butterflies when volatility is at extreme lows or extreme highs.
One way to look at volatility is to look at the range over the past 6 months or one 1 year and then disregard the top and bottom quarter.
Let’s say implied volatility for the instrument you are looking at has had a range between 10 and 30 over the past 6 months for a range of 20.
The top quarter of that range is between 25 and 30 and the bottom third is between 10 and 15. Now you have an implied volatility range of 15 to 25 with which to work.
Entering trades when volatility is within these levels should give you a better chance of achieving success.
RULES FOR LEGGING IN
We have previously looked at different ways to leg in to butterfly trades and this is something you can incorporate into your butterfly trading plan. There are many different ways to leg in and many different rules you can apply.
A lot of this comes down to personal preference and risk tolerance. Some traders will not want to leg in due to the directional risk, while others may be happy with that exposure.
For traders who want to leg in, your trading plan should include guidelines on when and how you will leg in.
The how indicates the method of legging in. Will you use long calls and puts, debit spreads or credit spreads?
When you leg in to butterfly trades could be based on certain technical indicators or chart patterns.
Some people prefer RSI, stochastics or MACD but any directional exposure you take by legging in should be planned in advance and detailed in your trading plan.
ADJUSTMENT RULES
We will cover adjustments in detail shortly, but as a general rule, you want to adjust your butterflies before the stock reaches your breakeven point. Some traders will adjust their butterflies once the breakeven point is breached.
I say a better method is to adjust before the stock gets to that point. When looking at a butterfly payoff diagram, you can break the profit tent into thirds. If the stock is in the middle third, you’re fine.
Once it breaks into either of the outer thirds, you should look to adjust. Looking at the diagram below, provided the stock stays between roughly $272 and $278 there should be no need to adjust.
Looking at it another way, this is the same butterfly spread after 1 week. You can see how the profit line is very flat between $272 and $277 but really starts accelerate downwards once you get past those points.
This is why adjusting based on the middle third makes sense and will help protect you from large losses.
EXITS
Choosing (and sticking to) your exit points is where a lot of traders fall down. Getting into a trade is the easy part, knowing when to get out is the hard part. With that said, let’s talk about some rules for when to exit a butterfly trade.
For simplicity’s sake, we will look at a standard butterfly trade.
The easiest and most enjoyable exit is when your profit target is hit. For a standard butterfly, if you’ve made somewhere in the range of 10-15% within about 10-15 days, then that is a very good time to take profits.
You can create a hard profit target if you prefer, such as exiting when you are +15%. With options trading there are so many variables, so sometimes it is better to be a little bit flexible with your rules.
For example, if I’ve made 10% on a butterfly within 1 week, I would be quite happy to exit at that point even if my aim was 15%. Never look a gift horse in the mouth because they market can take profits away from you very quickly.
The other less enjoyable way to exit a butterfly is via a stop loss. Typically, the maximum loss that you want to accept on a butterfly is around 20%, but your acceptable level may be slightly higher or lower depending on your risk tolerance.
Another method for exiting a butterfly is slightly less common but still an important one, and that is using a timed expiry. As a butterfly approaches expiry, profits can fluctuate wildly if the stock is within the profit tent.
The last week of an option’s life is referred to as gamma week for this very reason. Small movements in the underlying can have a big impact on your bottom line. You generally do not want to take a butterfly into expiry week.
Some traders will be lured in by the hopes of a significant return, but if you are treating your trading as a business, then you should not accept huge fluctuations in your account from one week to the next. Slow and steady wins the race.
Adjusting Butterfly Trades
The ability to adjust trades is what sets great traders apart from average traders. Some traders may prefer not to adjust and just stick to the standard profit target and stop loss.
Adjusting can allow you to turn a losing trade into a profitable trade, but it does involve risk and can make your trade more complicated. More traders blow up their accounts through bad adjustments than through bad trade initiation, so keep that in mind.
When it comes to adjusting butterfly spreads, there are plenty of ways to go about it and I will introduce some of the more common methods.
For a neutral butterfly, some traders like to adjust once the breakeven point on the profit graph has been exceeded. As mentioned previously, if you want to be a little more cautious, you can adjust when the price moves into the outer third of the profit tent.
The other method is to adjust the trade when losses hit 6-7%. Either method is fine, but keep in mind that when you adjust from a losing position, you will either decrease your profit potential or increase your risk.
For any trading strategy, it is a good idea to have at least 6 months of experience in a variety of market environments before allocating a significant amount of capital to the strategy.
One method of adjusting a butterfly is to add a second butterfly once the breakeven point on the profit graph is reached.
The advantage of this is that it gives you a new profit zone near where the stock is currently trading and gives you a nice wide profit zone for the stock to land in.
The disadvantage is that you are allocating more capital to the trade. Generally it is not a good idea to continue throwing more capital at a losing trade.
Here’s how it works.
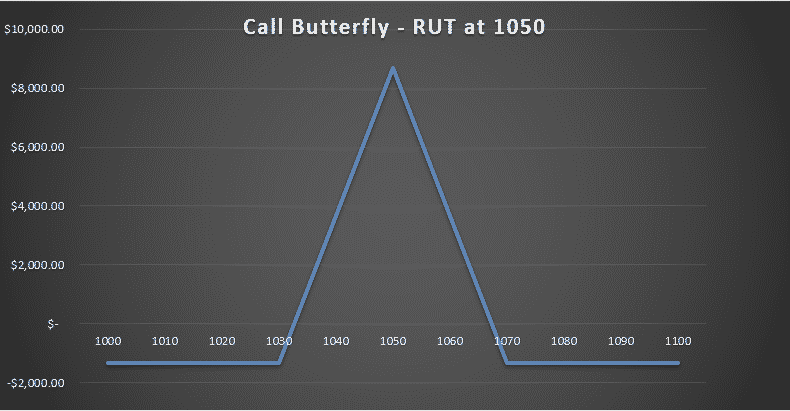
On August 12th, 2013 with RUT trading around 1050, you enter a September 1030-1050-1070 call butterfly spread. Four days later RUT is trading at 1030 and you need to adjust.
Date: August 12th 2013
Current Price: $1050
Trade Details: RUT Call Butterfly Spread
Buy 5 RUT Sept 19th $1030 call @ $36.40
Sell 10 RUT Sept 19th $1050 calls @ $23.35
Buy 5 RUT Sept 19th $1070 call @ $12.95
Premium: $1,325 Net Debit
On August 16th, with RUT trading at 1030, we add a second butterfly centered at 1030
Date: August 16th 2013
Current Price: $1030
Trade Details: Second RUT Call Butterfly Spread
Buy 5 RUT Sept 19th $1010 call @ $31.95
Sell 10 RUT Sept 19th $1030 calls @ $19.40
Buy 5 RUT Sept 19th $1050 call @ $10.15
Premium: $1,650 Net Debit
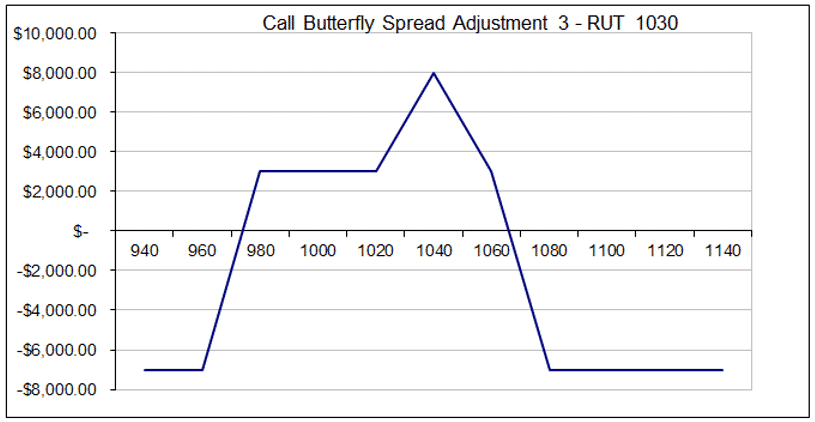
By making the adjustment we have added another $1,650 in risk capital to the trade, and in effect created a profit diagram that looks like a mini iron condor. The new position looks like this:
Long 5 RUT Sept 19th 1010 calls
Short 5 RUT Sept 19th 1030 calls
Short 5 RUT Sept 19th 1050 calls
Long 5 RUT Sept 19th 1070 calls
Total Capital at Risk: $2,975
Maximum Profit: $7,025
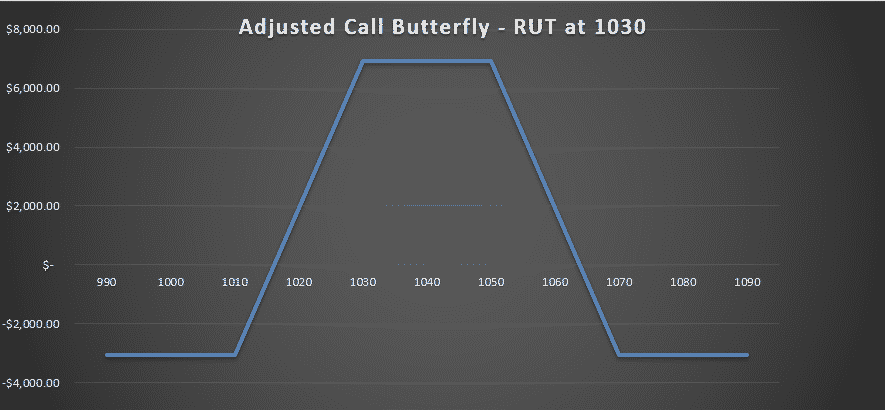
With RUT at 1030, you don’t have a lot of room to move on the downside with the breakeven point being around 1015. Theoretically, if RUT continues down you can add a third butterfly, but this is again going to increase capital at risk and decrease potential profits.
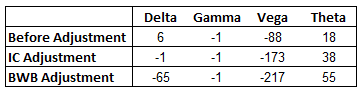
Here are the Greeks before and after the adjustment:

Another adjustment you might choose to make is adding call credit spreads. You can do this in a couple of ways. Using the example above, with RUT at 1030 we could sell some additional 1050-1070 credit spreads to turn the trade into something that looks like a Broken Wing Butterfly. You could call it that, or you could call it a Credit Spread With Protection. Either way, this is how you do it.
Date: August 16th 2013
Current Price: $1030
Trade Details: Adding Call Credit Spreads
Sell 5 RUT Sept 19th $1050 calls @ $10.15
Buy 5 RUT Sept 19th $1070 call @ $4.60
Premium: $2,775 Net Credit
We are bringing a large credit in for this trade, meaning the total net credit received is now $1,450. The disadvantage is that we have significantly increased our capital at risk when compared with the previous adjustment of adding another butterfly. We now have $8,400 at risk in the trade as opposed to $2,975 in the previous example.
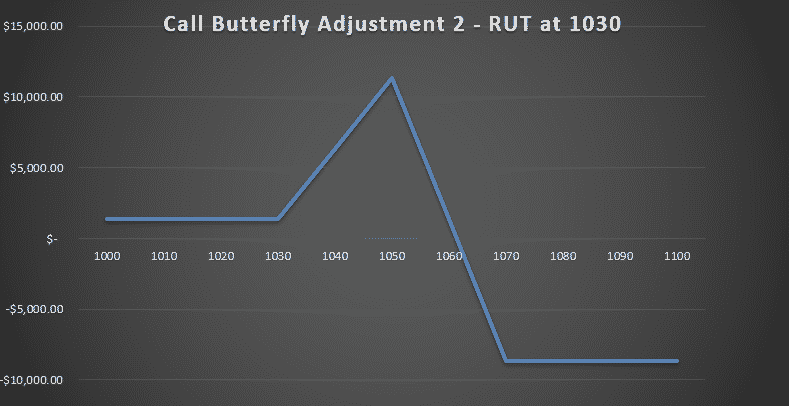
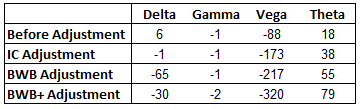
The other potential pitfall with this adjustment strategy is that you now have a significantly short delta. That may be ok if your market opinion has changed and you think the market is entering a new downtrend. But you may not want to take such a strong directional exposure. Here is how the greeks compare:
As you can see, you now have a very short Delta at -65. Delta is also higher than Theta whereas before the adjustment it was one third of Theta. The iron condor adjustment gave you a delta neutral position.
If you like the look of the Broken Wing Butterfly adjustment, but are concerned about the delta exposure, there is a way to cut delta without adding any extra risk capital to the trade. We do that by adding some put credit spreads. Here’s how:
Date: August 16th 2013
Current Price: $1030
Trade Details: Adding Put Credit Spreads to Reduce Delta
Sell 5 RUT Sept 19th $980 puts @ $7.70
Buy 5 RUT Sept 19th $960 puts @ $4.90
Premium: $1,400 Net Credit
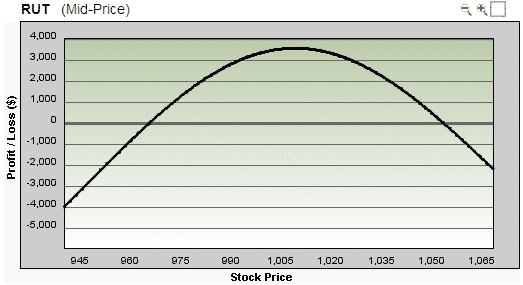
Your profit diagram at expiry now looks like this:
This extra piece of the adjustment has the added benefit of bringing in more income, while not tying up any extra margin or capital. We have now received a total net credit of $2,850 and our delta has been cut to -30.
With this last adjustment you should keep in mind that you now have a pretty complex position that is going to be difficult to adjust if the trade gets into further trouble.
You want to weigh whether it is worth making this adjustment, or if it’s better to just take your losses and close the trade.
The other disadvantage of this adjustment is the number of trades you are making is increasing, so you are incurring more commission costs and more slippage through the bid/ask spreads.
ADJUSTING PROFITABLE TRADES – THE REVERSE HARVEY
The Reverse Harvey is an adjustment strategy developed by Dan Harvey. The idea behind the adjustment is that you want to lock in profits on a winning trade.
With successful butterfly trades, once time passes, the sensitivity to movements in price increases. In other words, the slope of the current risk graph becomes more pronounced.
If the stock makes a large move, your profits can quickly disintegrate. Due to higher levels of short gamma the closer you get to expiry, your P&L will fluctuate more wildly.
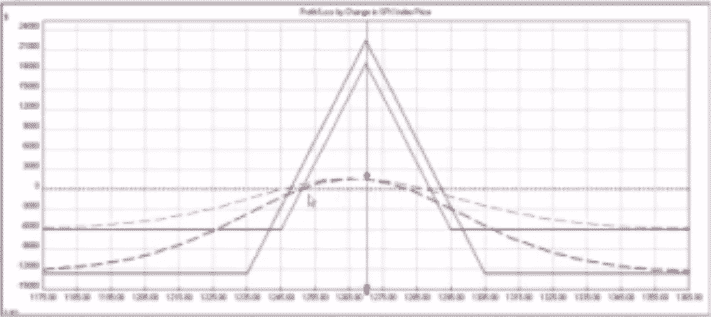
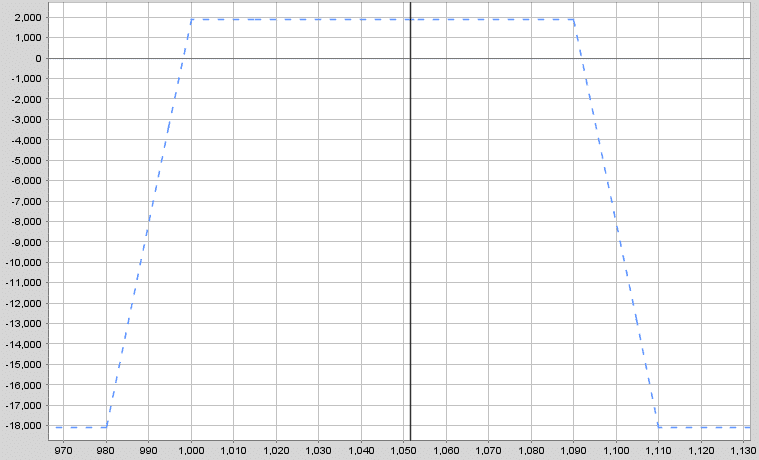
You can see this in the 2 diagrams below. With the stock right at the short strike, a move of 30 points would result in a decrease in profit of roughly $1,500 for a trade with 40 days to expiry and $8,500 for a trade with 10 days to expiry, quite a significant difference!
PROFITABLE BUTTERFLY WITH 40 DAYS TO EXPIRY
PROFITABLE BUTTERFLY WITH 10 DAYS TO EXPIRY

The increase slope is caused by increased gamma as you approach expiry and the fact that the wings provide less protection.
If the stock is right at the short strikes and there is not much time to expiry, the time premium of the outer wings will have almost evaporated and no longer provide much of a hedge.
For this reason it makes sense to “tighten the noose” in order to protect profits as time passes. This is where the Reverse Harvey comes in.
The Reverse Harvey involves selling the outer wings and bringing them in closer to the short strikes.
This provides more of a hedge for the short at-the-money options and reduces the overall short gamma of the trade. As a result the profit graph becomes more smoothed out again.
To watch the video by Mark Sebastian on the Reverse Harvey, visit this link. The example given in the video by Mark is this:
Date: Jan 4th 2011,
Current Price: $1274
Trade Details: SPX Iron Butterfly
Buy 10 SPX Jan 21st $1235 puts
Sell 10 SPX Jan 21st $1270 puts
Sell 10 SPX Jan 21st $1270 calls
Buy 10 SPX Jan 21st $1305 calls
After 3 days the trade is showing a decent profit, so Mark brings the wings in 10 points.
Date: Jan 7th 2011,
Current Price: $1275
Trade Details: Reverse Harvey Adjustment
Sell to close 10 SPX Jan 21st $1235 puts
Buy to open 10 SPX Jan 21st $1245 puts
Sell to close 10 SPX Jan 21st $1305 calls
Buy to open 10 SPX Jan 21st $1295 calls
This is the adjusted risk graph. The pink line is the adjusted position and the red line is the original position. You can see that the risk graph as of today (dotted line) is much smoother after the adjustment and the other added benefit is the capital at risk is greatly reduced.
Look at performing a Reverse Harvey adjustment once you are up about 5% on an Index butterfly.
Butterfly Spread Greeks
Understanding option greeks is vitally important with most option strategies and that is definitely the case with butterflies.
Greeks for a neutral long call butterfly, long put butterfly and iron butterfly are all going to be very similar.
I will discuss the greeks for a traditional neutral long call butterfly spread and you will know that the same can apply to the other varieties of neutral butterflies.
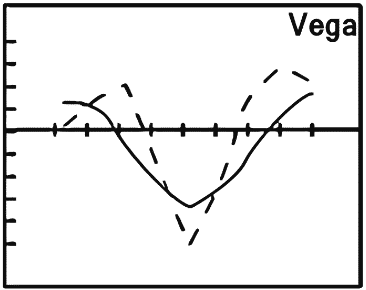
DELTA
A typical butterfly spread is set up with the short strikes placed at-the-money.
It doesn’t take a genius to realize that the delta of a neutral butterfly will be zero (or very close to), but what happens when the stock prices moves away from your short strikes?
If the stock falls, your butterfly becomes positive delta. If you think about it, this makes sense. When the stock falls, your point of maximum profit is above the current stock price, therefore you want the stock to rise.
Positive delta indicates that you will make money as the stock rises.
The opposite can be said if the stock rises. Your point of maximum profit is now below the current stock price, so you want the stock priced to fall. Therefore, you have negative delta.
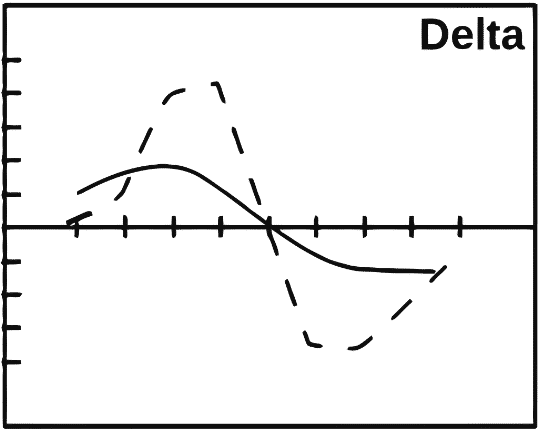
This is shown graphically in the image below. The dotted line represents a shorter dated option and the solid line represents a longer dated option.
You can see that the effect is more pronounced in the shorter dated option. In other words, the delta (directional) risk is greater in shorter term butterflies.
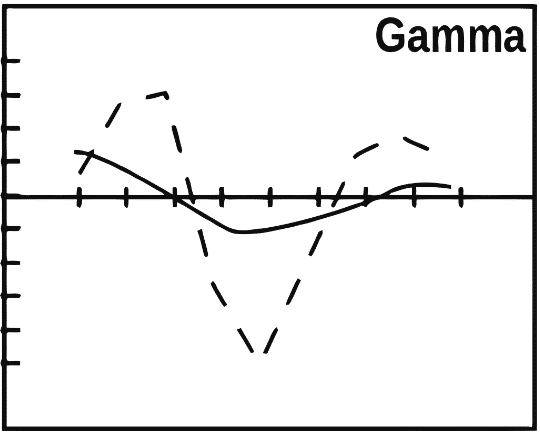
GAMMA
Gamma is a hugely important greek to understand when trading butterflies, as I have previously alluded to. Important and frequently overlooked.
Gamma is the reason why the delta of a butterfly changes from positive to negative.
For those that are unfamiliar with gamma, a quick discussion might be in order before we look specifically at butterfly gamma.
Gamma represents the rate of change of an option’s delta. An option with a gamma of +.05 will see its delta increase by +.05 for every 1 point move in the underlying.
Delta neutral trades don’t stay neutral for long and the reason is gamma. To understand how gamma works, let’s look at an example.
Assume you buy a 30 day, 50 delta straddle and a 90 day, 50 delta straddle.
Both positions have the exact same delta, so how will they perform if the stock makes a big move? The one with the highest gamma will do better, in this case the shorter dated trade.
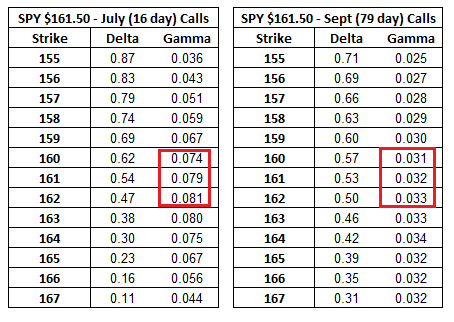
Gamma is at its highest with at-the-money options. Looking at SPY call options with 16 days to expiry, you can see the gamma is highest around $161 – $163.

From this you can deduce that at-the-money butterflies have a large (negative) gamma risk.
Gamma will be higher for shorter dated options as you can see below. Gamma for the July at-the-money calls is around 0.08, whereas the September at-the-money calls are 0.03. For this reason, the last week of an options life is referred to as “gamma week”.
Most professional traders do not want to be short gamma during the last week of an options life.
Net sellers of options will be short gamma and net buyers of options will be long gamma. This makes sense because most sellers of options do not want the stock to move far, while buyers of options benefit from large movements.
A larger gamma (positive or negative) leads to a larger change in delta when your stock moves.
When trading butterflies, it definitely pays to keep an eye on gamma. When the stock is outside the wings of a butterfly, the trade has positive gamma.
This indicates that the trade will gain delta as the price rises and lose delta as the price falls.
When the stock is right at the middle strikes, you have a large negative gamma exposure. A large negative gamma means you don’t want the stock to move far.
This makes sense for a butterfly when you are right at the middle strikes.
As the stock moves up from the short strikes, the butterfly will lose delta (and probably go from neutral delta to short delta as we discussed above).
As the stock falls from the short strikes the butterfly will gain delta (going from neutral to positive delta).
The negative gamma exposure on a butterfly trade is a lot more than on other popular income trades like iron condors.
VEGA
Neutral butterflies are short Vega.
The Vega exposure is similar to the gamma in that you have a large short Vega exposure at the short strikes and positive Vega outside the wings.
So Vega works against you around the short strikes, but when the stock starts to move away, Vega actually begins to work in your favor.
In the first few days of a butterfly, volatility will have the biggest impact on profits out of all the greeks.
For example a RUT 45 day at-the-money butterfly has a Delta of -2, a Gamma of 0, a Vega of -31 and Theta of 4. Vega is by far the biggest exposure and will have the biggest impact.
Butterflies have a very similar payoff diagram to a calendar spread, the main difference being that butterflies are negative Vega while calendars are positive Vega.
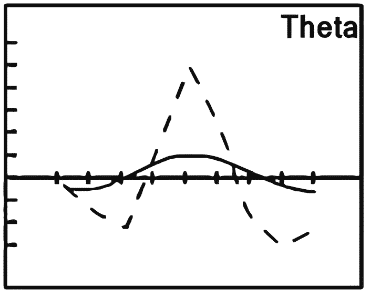
THETA
Theta is the exact opposite of gamma. You have a large positive Theta (you make money as time passes) when the stock is right at the short strikes and you have negative Theta (losing money as time passes) when the stock is out beyond the wings.
Using Directional Butterflies For Low Cost, High Reward Trades
Using butterflies to make cheap directional bets is one of my favorite strategies, so I’m going to enjoy writing about this topic. So far we have only looked at the “traditional” way to trade butterflies, which is as a neutral income trade.
You can use butterflies in many ways, so let’s delve in to how you can use them to make low risk, high reward directional trades.
A traditional butterfly involves selling two at-the-money options. When using butterflies as a directional trade, we place the sold options out-of-the-money.
A trader with a bullish bias would sell 2 out-of-the-money calls and a trader with a bearish bias would use out-of-the-money puts.
Before we go further into specifics, let’s first consider the reasons why you might trade an out-of-the-money butterfly. The first reason is that it is a very cheap way to gain directional exposure, or hedge an existing portfolio or position.
Let’s say you are bearish on SPY over the next few weeks and want to take a directional exposure. The most obvious way to do this would be to simply buy put options.
The main problem with being long puts is that you suffer from large amounts of time decay. The stock needs to start moving down soon after you enter your trade, otherwise the position starts to decay.
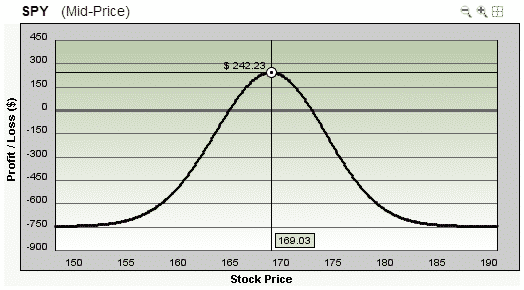
SPY is trading at $161.20 on July 1st, 2013 and you think it might decline to $155 over the next two weeks. You buy a July 19th $157 put for $0.89.
Your risk is $89, your profit potential is unlimited and your breakeven price is $156.11.
Date: July 1st 2013,
Current Price: $161.20
Trade Details: SPY Long OTM Put
Buy 1 SPY July 19th $157 put @ $0.89
Premium: $89 Net Debit
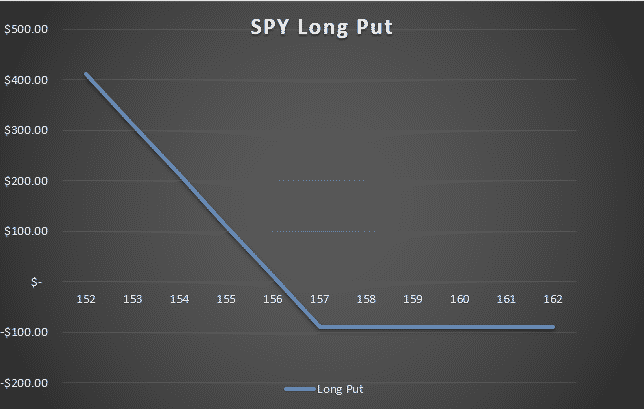
As you can see, this position starts to make profits below $156.11, but you were only anticipating a fall to $157.
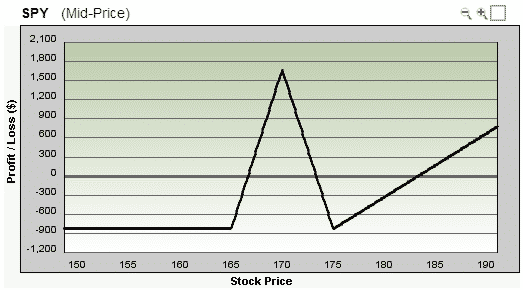
Assuming your directional view is correct and SPY drops to around $157 over the two-week period, a directional butterfly would be a much better choice both from a risk and reward perspective. Let’s analyze the trade:
Date: July 1st 2013,
Current Price: $161.20
Trade Details: SPY Bearish Butterfly
Buy 1 SPY July 19th $153 put @ $0.39
Sell 2 SPY July 19th $157 put @ $0.89
Buy 1 SPY July 19th $161 put @ $2.06
Premium: $67 Net Debit
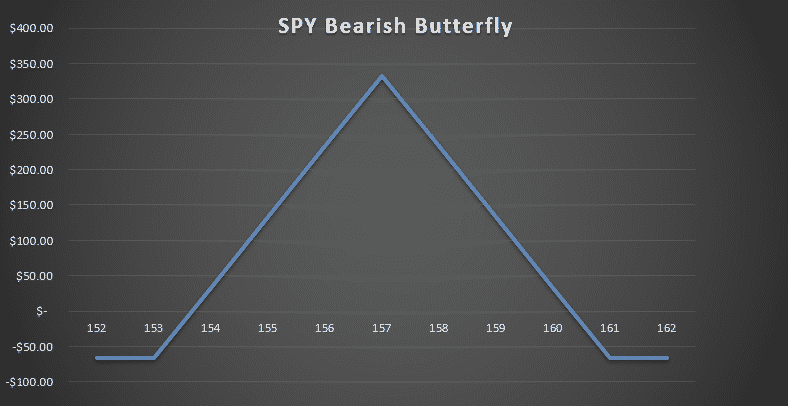
As you can see above, you are risking less capital, only $67 in this case, and looking at a nice return if SPY ends around $157.
We know achieving the maximum return on a butterfly is unlikely, but it’s possible to make around a $200 gain if SPY close between $156 and $158.50.
To make the same $200 gain, the long put would have to decline to around $154.
Risking $67 as opposed to $89 may not seem like a big difference, but for someone trading 10 contracts, the difference would be $2,200 less capital at risk. That’s pretty significant, if you ask me.
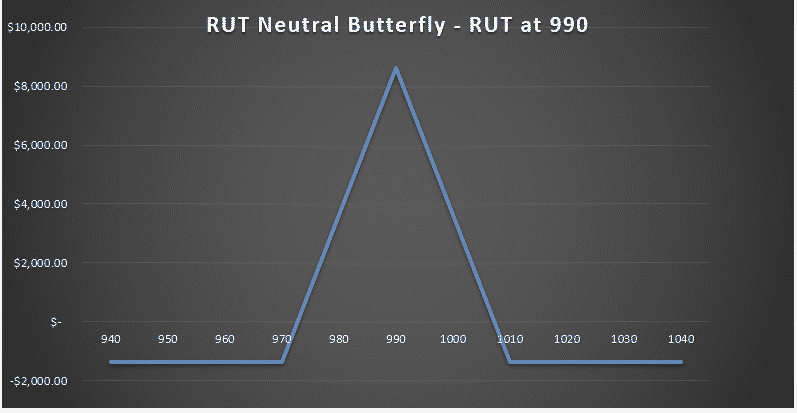
Let’s look at some further examples of directional butterflies, this time using RUT. First, let’s analyze a traditional neutral butterfly.
Date: July 1st 2013,
Current Price: $989
Trade Details: RUT Neutral Butterfly
Buy 5 RUT Aug 15th $970 call @ $36.45
Sell 10 RUT Aug 15th $990 call @ $23.90
Buy 5 RUT Aug 15th $1010 call @ $14.10
Premium: $1,375 Net Debit
Now let’s look at a RUT Bearish Butterfly:
Date: July 1st 2013,
Current Price: $989
Trade Details: RUT Bearish Butterfly
Buy 5 RUT Aug 15th $880 put @ $3.90
Sell 10 RUT Aug 15th $900 put @ $5.65
Buy 5 RUT Aug 15th $920 put @ $8.15
Premium: $375 Net Debit
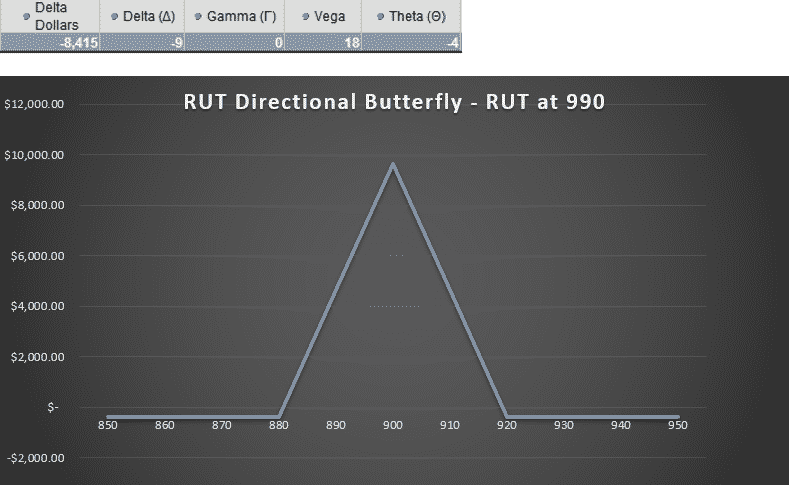
Looking at the payoff graph above, you can see that this is a very attractive trade from a risk / reward standpoint.
Risking $375 to (theoretically) make nearly $10,000 is a good deal to me.
Of course, RUT would have to drop around 10% for that to happen, but you can’t argue with the risk / reward ratio.
This type of trade is great to put on at the end of a long bull run when you think the market is due for a correction, or you can use it as a very low cost way to insure a portfolio of stocks.
There are a couple of other things to take note of here. The Vega on the bearish butterfly is positive, whereas with a traditional butterfly it is negative.
Also Theta is negative, so time decay is working against you in this strategy. Hopefully it’s obvious, but you are not using this as an income trade, which is what butterflies are typically used for.
Lastly, let’s look at a directional butterfly using out-of-the-money calls for a bullish trade:
Date: July 1st 2013,
Current Price: $989
Trade Details: RUT Bullish Butterfly
Buy 5 RUT Aug 15th $1030 call @ $7.20
Sell 10 RUT Aug 15th $1050 call @ $3.05
Buy 5 RUT Aug 15th $1070 call @ $1.20
Premium: $1,150 Net Debit
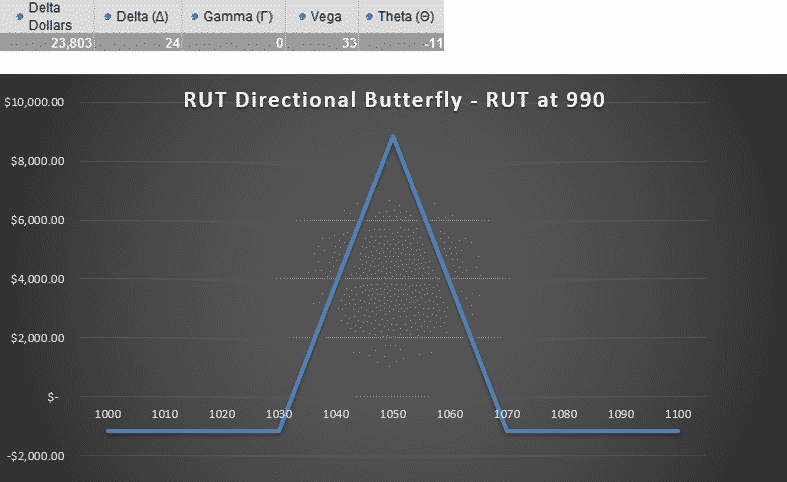
Here again, you can see a pretty favorable risk / reward ratio, but the trade is much more expensive than the bearish butterfly, and in fact not that much cheaper than the neutral butterfly. There are two reasons for this.
First, put options are skewed because markets tend to fall faster than they rise. As such, out-of-the-money puts are more evenly priced compared to the calls.
Once you start to go deep out-of-the-money with the calls, those options have very little value. You can see this in the option prices of the bullish and bearish butterflies.
The put strikes were traded at much more even prices – $8.15, $5.65 and $3.90. The calls were traded at a much greater variance – $7.20, $3.05 and $1.20.
The second reason is that the bullish butterfly is not as far out-of-the-money as the bearish butterfly. The sold puts are $90 below the price and the calls are only $60 above.
The reason for this is I wanted to have a similar delta (i.e. similar probability) of the short strikes for both the puts and calls. The delta of the short $900 puts was -0.12 and the short $1050 calls was 0.12.
At August 14th, a day and a half before expiry, RUT was trading at around 1050, having rallied strongly through July and early August.
The bullish butterfly could have been closed on August 14th for $6,150, a profit of $5,000 on a $1,150 investment.
A FEW THINGS TO KEEP IN MIND
Directional butterflies might be completely new to you, so let’s go over some things to keep in mind before you dive in.
Butterflies are a net debit trade so we want to be paying as little as possible. You have to weigh up the cost of the butterfly with how far you expect the stock to move.
The further out-of-the-money you go, the cheaper the trade will be, but the less likely that the stock will end near your sold options.
You can use delta as a guide such as I did here, look at support and resistance levels, or use a standard deviation measurement.
Short term trades are great with this strategy. I generally don’t advocate trading weekly options, but in this case, directional butterflies using weekly options are a great way to get leverage on your directional opinion.
I find around 15 days is a good sweet spot, but you can still go further out in time such as I did with RUT above.
Set a price target for the stock and structure your butterfly with the short strikes at that level. Try to think about where the market has the potential to go. Could it move 5% in a week? 10% in a month?
You might find this strange to hear, but Theta and Vega are not overly important in this trading strategy.
The Neutral RUT butterfly has Vega of -73 and Theta of 44, but the directional trades were 18, -4 and 33, -11, so the exposure to these greeks is much less of a factor with directional butterflies.
Given that you are risking such a small amount of capital, you can accept a greater loss than you usually would for a traditional butterfly.
For example with the RUT Bearish Butterfly only requiring $375 of capital, I would be willing to accept up to a 50% loss on the position.
It can make sense to hold these position until closer to expiry than you normally would with a traditional butterfly. The leverage is what we’re after here, so it makes sense to hold out for that big winner, given we only have a small amount of capital at stake.
Unlike other directional trades, a large move in the opposite direction early in this trade will not have dire consequences. Compare that with a long put or long call, which can be decimated by an adverse directional move.
Using short-term directional butterflies can be a great way to hedge a credit spread or iron condor that is under pressure, while allowing you to remain in the trade.
Trading a butterfly in this manner is a directional trade, as you still need to stock to move in the direction of your sold options in order to be profitable.
The benefit of this type of trade is that the cost of being wrong is minimal.
Adding An Extra Put Or Call To Protect Against Fast Moves
Today we’re looking at how to protect your butterfly trades against fast moves in the stock.
How often does it happen where you put on a trade and then within hours, sometime even minutes, the stock goes on an absolute tear and leaves you sitting on large losses?
It happens all the time and it’s really annoying!
With butterflies, there is a way to give you a little bit of protection against this.
Let’s say you put on a neutral butterfly but are concerned that the market might rocket higher. Adding an extra call can give you a great deal of protection against this without adding much more risk on the downside.
Let’s look at an example:
Date: August 5th 2013,
Current Price: $170.70
Trade Details: SPY Neutral Butterfly
Buy 5 SPY Sept 20th $165 calls @ $6.80
Sell 10 SPY Sept 20th $170 calls @ $3.05
Buy 5 SPY Sept 20th $175 calls @ $0.80
Premium: $750 Net Debit
Now we’ll add the extra call.
Trade Details: Adding A Long Call To Protect The Upside
Buy 1 SPY Sept 20th $175 calls @ $0.80
Premium: $830 Total Net Debit
Looking at the payoff diagram at expiry, you might not immediately see the benefit of this variation, as the stock would have to move a long way to the upside in order to reach a profit. However, the main benefit comes if the stock makes a fast move early on in the trade.
Let’s assume that SPY continues to rocket higher and climbs 5% in the next three weeks to around $180. At this level, the standard butterfly would be showing losses of $650, which is nearly a complete wipe out.
The extra call variation will be showing losses of around $220, which is significantly lower than the standard butterfly, and all it cost you was an extra $80.

Why Broken Wing Butterflies Are The “One Size Fits All” Strategy
In this chapter we’ll look at the “one-size fits all” strategy that is broken wing butterflies.
Along with directional butterflies, broken wing butterflies are one of my favorite strategies. How would you like a trade that provides income if a stock goes one way, and capital gains if it goes the other way? That’s the potential you have with broken wing butterflies.
A broken wing butterfly is sometimes referred to as a “skip-strike” butterfly and you will understand why once you see the trade setup.
A regular butterfly has the bought options an equal distance from the sold options, whereas a broken wing butterfly will skip a strike on one side of the trade.
This reduces the cost and in some cases will actually result in a net credit, meaning you can use it as an income trade.
The other way to think about broken wing butterflies is that they are simply an out-of-the-money credit spread, protected by a slightly narrower, closer to the money debit spread. This is what the payoff diagram looks like:
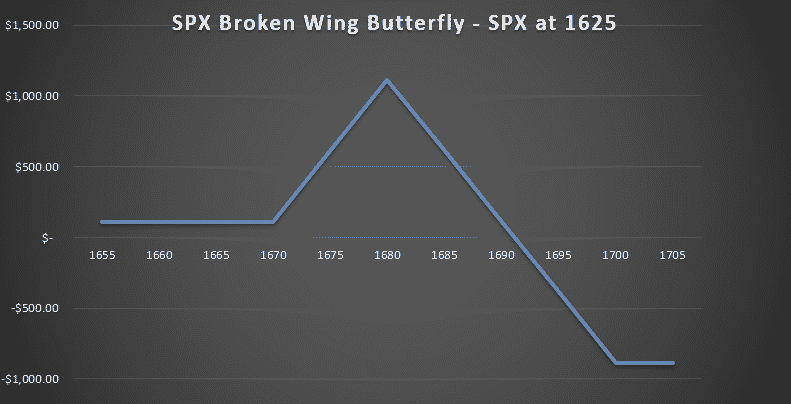
Note that there is an (albeit small) income portion to this trade if SPX stays below 1670 and a profit zone located between 1670 and 1690.
The drawback with this trade is the increased risk on the upside, but keep in mind the index has to go through the profit zone before entering this danger area.
Ideally you want the index to slowly drift up into the profit zone and expire around 1680.
However, you also don’t mind if the index drops, in which case you would just let the entire trade expire worthless and bank the income portion of the trade.
The above example is using SPX and assumes you are slightly bearish due to some overhead resistance, but are concerned that momentum may carry the index slightly higher.
The income portion of the trade is $100 and the risk is $900, which is an 11.11% return. Not bad considering you will make this return if the stock:
- Moves lower
- Stays flat
- Rises by less than 2.75%
Let’s not forget you also have the potential to make a large gain within the profit zone. The upper breakeven point of the profit zone is around 4% higher than the current index price so you have a reasonable margin for error.
The best time to make these types of trades is at the end of a long bull run, where the stock or index is almost exhausted, but could potentially muster another 2-3% rally. If that happens, you are in the profit zone, if the stock reverts to the mean, you bank the income portion.
Keep in mind you can also do the same thing using puts, where you have the income portion above the current stock price.
Hopefully you can now see why I love this trade. Here is how the above SPX trade was set up:
Date: July 5th 2013,
Current Price: $1624
Trade Details:
Buy 1 SPX Aug 15th $1670 call @ $9.85
Sell 2 SPX Aug 15th $1680 calls @ $7.25
Buy 1 SPX Aug 15th $1700 call @ $3.65
Premium: $100 Net Credit
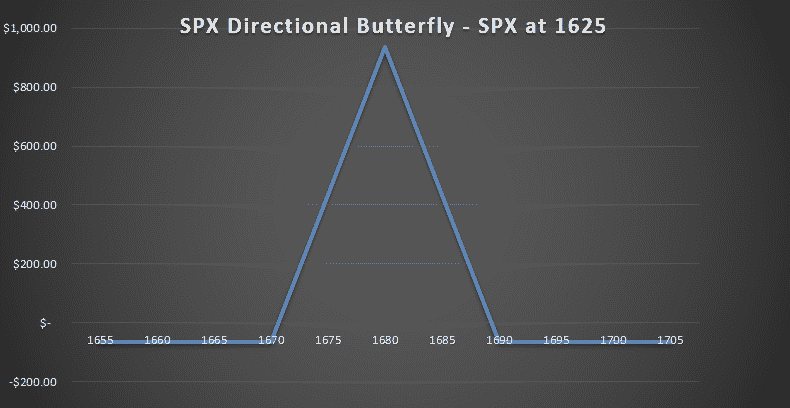
Let’s take a look at the same idea but using a standard butterfly. Instead of buying the 1700 call for $3.65, this time we are buying the 1690 call for $5.30. The increased cost of the 1690 call results in a net debit for the trade, albeit only a small one.
Date: July 5th 2013,
Current Price: $1624
Trade Details:
Buy 1 SPX Aug 15th $1670 call @ $9.85
Sell 2 SPX Aug 15th $1680 calls @ $7.25
Buy 1 SPX Aug 15th $1690 call @ $5.30
Premium: $65 Net Debit
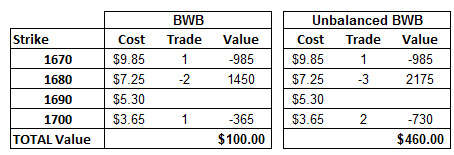
You might be able to better visualize the different trade setups using this table below:
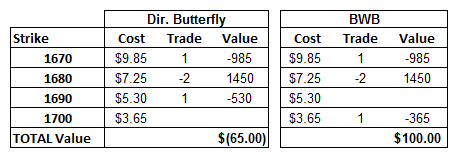
With the directional butterfly, you risk the prospect of full capital loss anywhere below 1670 or above 1690. With the broken wing butterfly, you profit anywhere below 1690, so the probability of success is significantly higher.
The broken wing butterfly also turns the trade into more of a bearish trade as you will see from the option greeks.
On August 14th, SPX was trading around 1690, just inside the profit tent. The 1670 calls were trading at $15.30, the 1680’s were at $7.35 and the 1700’s were at $0.55 meaning the entire spread could be closed for a credit $115.
Adding that to the $100 received at trade initiation brings the profit on the trade to $215, for a 23.89% return on the $900 capital at risk.
VARIATION – UNBALANCED BROKEN WING BUTTERLIES
Aggressive traders can take the features of a broken wing butterfly and take things to the next level by trading an unbalanced broken wing butterfly. The idea is that you have your regular broken wing butterfly and then add extra short vertical spreads.
You could also call this a ratio spread with out-of-the-money protection.
This type of trade increases the income potential, but also increases the risk, which is why I mentioned that it is more suitable for aggressive traders.
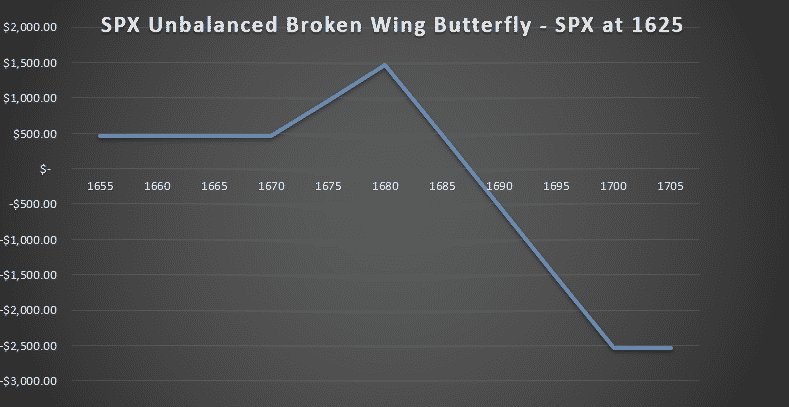
Using our SPX example, we can increase the income potential to $460, the trade-off being an increase in capital at risk to $2540. Still that is an increase in the income portion of the trade from 11.11% to 18%.
Here’s how you would set up the trade:
Date: July 5th 2013,
Current Price: $1624
Trade Details:
Buy 1 SPX Aug 15th $1670 call @ $9.85
Sell 3 SPX Aug 15th $1680 calls @ $7.25
Buy 2 SPX Aug 15th $1700 call @ $3.65
Premium: $460 Net Credit
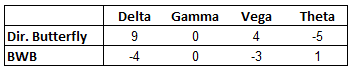
The unbalanced broken wing butterfly becomes more of a directional trade than the other two as you can see from the greeks below. You still get the nice profit zone on the upside if the stock continues to rise, but this trade is much more bearish due to the negative delta.
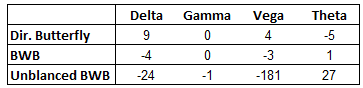
With the unbalanced broken wing butterfly, all of the greeks are significantly higher than the other two trades; it’s a great strategy but it might take some getting used to.
If you like broken wing butterflies, you may want to check out this post on the Rhino Strategy.
Using Bearish Butterflies For Any Market Environment
The Bearish Butterfly is an advanced rules based strategy developed by a friend of mine called John Locke (no, not the guy off Lost).
The basic premise is that you enter a butterfly below the current stock price and then use reference points to add to, or adjust the trade.
You start with one-third of your total position size and then add the rest if the market rallies.
Keep in mind the bearish butterfly trade outlined here is a high risk, high reward trade so it’s not for everyone.
BEARISH BUTTERFLY SETUP
Below is the original Bearish Butterfly rules:
The trade is always entered with 56 days until expiry. RUT is the favored instrument and the initial butterfly is centered 20 points below the current RUT price. Your reference point is the centre of the butterfly and the adjustment points are then calculated as follows:
Reference point +40 – add second 1/3
Reference point +60 – add last 1/3
Reference point + 70 – roll lowest butterfly +60
Reference point + 80 – roll lowest butterfly +60
Reference point + 90 – roll lowest butterfly +60
So assuming at initiation of the trade RUT is at 1050, you enter a butterfly with 1/3 of your position size, centred at 1030. If RUT then rises to 1070 (i.e. 40 points above your butterfly centre), you add the second butterfly centred at 1050.
If RUT then breaks 1090, add the last butterfly at 1070.
If RUT continues to rally and breaks above 1100, close the 1030 butterfly and move it to 1090.
NEW BEARISH BUTTERFLY SETUP
The rules above were developed when RUT was trading around 600-800. Once RUT got up above 1200, I found that the rules weren’t really working very well and I was having to scale in to the trade too early.
Given the RUT Index value was basically double what it was when the rules were created, I decided to double all the parameters:
So instead of centering the butterfly 20 points below, I now put it 40 points below.
That makes sense if you think about it because a 20 point move on an Index at 600 is the same in percentage terms as a 40 point move on an Index at 1200.
The reference points are now as follows:
Reference point +80 – add second 1/3
Reference point +120 – add last 1/3
Reference point + 140 – roll lowest butterfly +120
Reference point + 160 – roll lowest butterfly +120
Reference point + 180 – roll lowest butterfly +120
BEARISH BUTTERFLY RISK MANAGEMENT
In terms of risk management rules and profit target the guidelines are set out as such:
Start with 20 contracts (10 butterflies) for the short strikes and scale to 60 contracts if fully scaled into. Of course you can reduce these numbers if you have a smaller account size.
Wing Span – Anything from 20 to 50 is ok. The wider the spread, the more expensive the trade, but the larger the profit zone
Planned Capital – $50,000
Minimum Capital Suggested in Account – $100,000
Profit Target – $15,000
Reduced Profit Target – $5,000… 21 DTE or closer
Max Loss – $15,000
Some people like the rules based approach of the bearish butterfly, but it’s not for everyone.
The strategy relies on the fact that at some point the market will provide a pullback into the developing profit zone that you are creating with the bearish butterfly.
Markets that grind higher without much of a pullback such as we have seen a few times in 2013 can be a disaster for this trade.
When this trade loses, it can lose big.
BEARISH BUTTERFLY EXAMPLES
Here is an example of the standard set up for a Bearish Butterfly.

Scale in points for this example would be if RUT hits either 1130 or 1290.
Using Butterflies As Part Of A Combination Strategy
So far we have looked mostly at using butterflies as a stand-alone trade, as both neutral and directional trades. Another skillful way to use butterflies is as part of a combination strategy or as a hedge for other trades.
Iron Condors are a popular income trade and adding at-the-money butterflies can increase your Theta decay, potentially allowing you to exit the trade earlier for the same amount of profit. Let’s take a look at an example:
Date: July 31st 2013,
Current Price: $1052
Trade Details: Iron Condor
Long 10 RUT Aug 15th $980 puts @ $1.45
Short 10 RUT Aug 15th $1000 puts @ $2.45
Short 10 RUT Aug 15th $1090 calls @ $1.25
Long 10 RUT Aug 15th $1110 calls @ $0.35
Premium: $1,900 Net Credit
The payoff diagram is shown below. You can see we are risking $18,100 for a profit potential of $1,900 for a return of +10.50%.
Now if we want to increase our Theta and Vega exposure we can add a couple of at-the-money butterflies. A ratio of 2 butterflies for every 10 condor spreads is reasonable, but you can increase or decrease this depending on your opinion on volatility.
Trade Details: Adding 2 at-the-money butterflies
Buy 2 RUT Aug 15th $1030 calls @ $28.30
Sell 4 RUT Aug 15th $1050 calls @ $14.30
Buy 2 RUT Aug 15th $1070 calls @ $5.10
Premium: $960 Net Debit
This gives us a profit diagram that looks like this. Notice that the capital at risk has increased by the cost of the butterfly and that we now have a large profit tent in the middle of the graph.
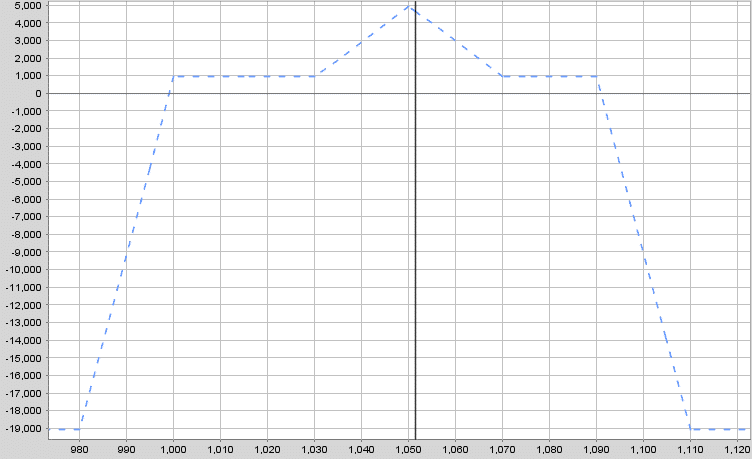
The profit potential outside of the butterfly wings has dropped from $1,900 down to $940.
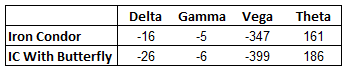
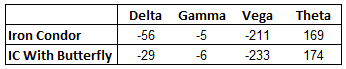
This type of trade would be perfect after a volatility spike where you are expecting the stock to trade sideways for 1-2 weeks. Let’s compare the greeks of the iron condor and the combination position.
The key points here are that your Vega and Theta have both increased.
Using Butterflies As A Hedge
My preferred method for using butterflies as a hedge is when another income trade such as an iron condor is moving against me and threatening my short strikes.
If you have ever traded iron condors, you will know that a stock aggressively moving towards your short strikes puts your position under significant pressure.
Sometimes you will be forced to take losses for fear that the stock might continue trending, resulting in rapidly increasing losses.
When this occurs, some traders will take losses and close the trade and some will adjust and wait for the market to move back the other way before expiry. Butterflies are a great way to hedge under pressure iron condors as I will show you.
While keeping in mind there is no perfect hedge, incorporating a butterfly as a hedge for an under pressure iron condor can achieve the following things:
- Reduce your delta exposure allowing you to contain losses
- Allow you to stay in the trade longer and delay taking losses
- Potentially achieve larger gains
- Ride the trend rather than fight it
Let’s look at an example of how this might play out. The following is a RUT iron condor on July 8th where the short calls were under pressure. RUT had risen from a low of $942 on June 24th to $1009 on July 8th.
Date: July 8th 2013,
Current Price: $1008.93
Trade Details: RUT Iron Condor – Calls Under Pressure
Long 5 RUT July 18th $940 puts
Short 5 RUT July 18th $960 puts
Short 5 RUT July 18th $1030 calls
Long 5 RUT July 18th $1050 calls
At this point, the short calls were getting a little too close for comfort and the delta was getting to a point where it needed to be adjusted. Rather than the traditional methods of rolling iron condors which increase capital at risk, I could use a butterfly. Here’s how it could be done by adding the following trade:
Trade Details: Butterfly Hedge For In Trouble Iron Condor
Buy 2 RUT July 18th $1010 calls @ $10.30
Sell 4 RUT July 18th $1030 calls @ $2.65
Buy 2 RUT July 18th $1050 calls @ $0.45
Premium: $1,090
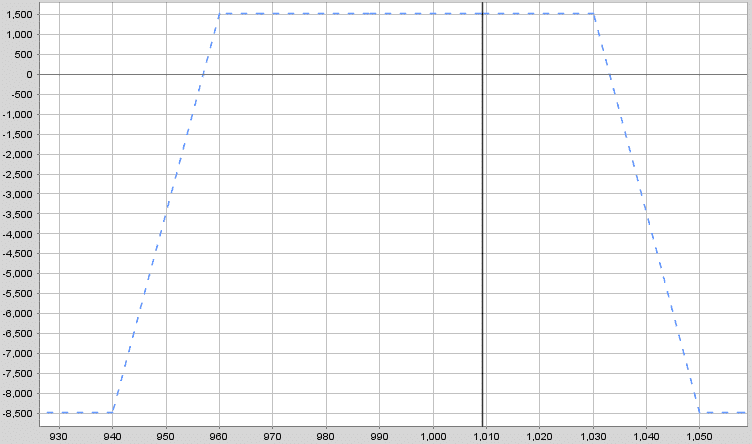
Doing this changes the profit graph to look like the following. Notice that there is now a significant profit zone centered around the short call strike of $1030.
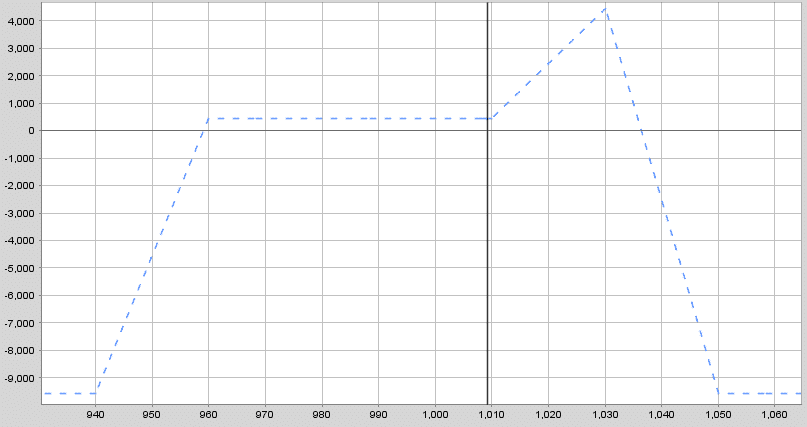
Making this adjustment has increased capital at risk by $1090, but that isn’t too bad considering the alternatives. Keep in mind that potential profits on the upside have also increased. The income portion of the trade has dropped from $1500 to $410 but that’s ok as this hedge is more concerned with defending the short strike of 1030. The delta exposure has been cut in half, so losses from any further upside in RUT will be lower than if the condor was left as it was.
If in a couple of days, RUT declines, you can then remove the butterfly at a small loss and then you have your existing condor back.
You can do the same move in the puts if the market is attacking your short puts.
Unfortunately in this case, RUT continued to move higher and the position had to be closed for a loss. However, the butterfly hedge helped to keep losses lower than they would have been from just holding the condor.
Trading Weekly Double Butterflies
Weekly options have become increasingly popular in recent years. In this chapter, we’ll be looking at how to trade double butterflies using weekly options.
Using double butterflies to trade weekly options can work really well if you like the idea of a “set and forget” strategy. With short-term butterflies you can enter trades relatively cheaply, particularly if you move further out-of-the-money.
By using a double butterfly, you don’t care which way the underlying moves, as you are creating profit zones to the upside and downside.
To set up the trade, you place a call butterfly spread above the current market price and a put butterfly spread below the current market price.
A good guide is to have your short strikes centered just outside a 1 standard deviation move in the underlying instrument. I like to initiate the trade anywhere between 7 and 10 days to expiry.
Generally this will be fairly cheap to set up. The reason I called this a “set and forget” strategy, is that once you put on the trade, you leave it until expiry (note you should only do this with European style Index options).
This helps reduce commission costs and slippage as there is no exit for the trade. As the trade is cheap to set up, you are willing to accept a 100% loss on the trade.
Here’s an example of how you set up this trade:
Date: August 6th 2013,
Current Price: $1698
Trade Details: SPX Weekly Double Butterfly
Buy 1 SPX Aug 15th $1625 put @ $0.80
Sell 2 SPX Aug 15th $1650 puts @ $1.80
Buy 1 SPX Aug 15th $1675 put @ $4.80
Premium: $200 Net Debit
Buy 1 SPX Aug 15th $1725 call @ $1.60
Sell 2 SPX Aug 15th $1750 calls @ $0.35
Buy 1 SPX Aug 15th $1775 call @ $0.10
Premium: $100 Net Debit
Total Premium: $300 Net Debit
At the time of trade entry, a 1 standard deviation move would have put SPX at 1665 or 1731 at expiry.
Here’s how the profit diagram looks. Note that the trade is risking very little capital and there are two very nice profit zones to the upside and downside.
You will profit anywhere between -4.10% to -1.50% and +1.80% to +4.30%. If you got lucky and SPX settled at 1650 or 1750, you would collect a nice profit of $2,200.
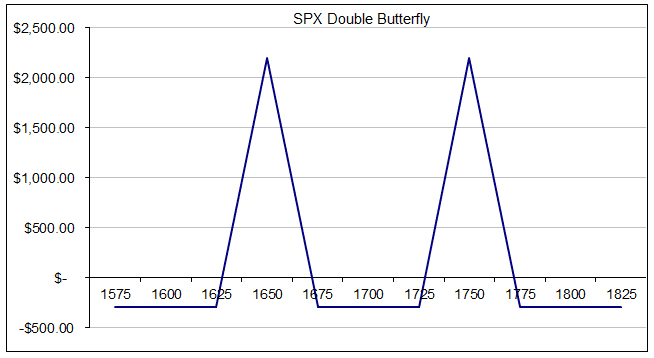
SPX ended up settling at 1657 for the August 15th expiry. The call butterfly expired worthless resulting in a loss of $100 while the put butterfly made a profit of $1600 thanks to the long 1675 put and short 1650 puts.
Overall the trade made $1500 in profit for a return of 500%.
This won’t happen every week of course, but this is a nice profit for a low stress, inexpensive trade. You only need to a have a winning trade every few weeks to make it worthwhile.
You can also increase your chances of success by waiting for 1-2 quiet weeks of less than 1% movement before initiating the trade.
This gives you a greater chance that the index will move the required 1 standard deviation.
Reverse Butterflies
Reverse butterflies are not an overly common trading strategy but they can have their place in certain environments.
Where you would normally enter a regular butterfly if you were expecting little movement in the underlying stock, a reverse butterfly option strategy is placed when a a large move is expected in the stock.
The right time to enter a trade like this would be if a stock has been trading sideways for several weeks and you are expecting a breakout but are unsure of the direction.
A reverse butterfly is constructed in the opposite way to a regular butterfly.
Instead of selling two at-the-money calls and buying the wings, you are buying the two at-the-money calls and selling the wings.
Sell 1 in-the-money call
Buy 2 at-the-money calls
Sell 1 out-of-the-money call
As with a regular butterfly, the wings are placed an equal distance from the middle strike.
Let’s look at an example from 2013 and then a more recent example after that:
SPX REVERSE BUTTERFLY EXAMPLE
Date: July 30th 2013,
Current Price: $1691
Trade Details: SPX Reverse Butterfly
Sell 1 SPX Sept 19th $1660 call @ $46.90
Buy 2 SPX Sept 19th $1690 calls @ $27.95
Sell 1 SPX Sept 19th $1720 call @ $13.60
Premium: $460 Net Credit
Max Loss: $2,540
Stop Loss: 20% or $508
Breakeven Prices: $1664.60 and $1715.40
The breakeven prices can be calculated as follows:
Lower Breakeven Price = Lower Wing + Premium Received
1660 + 4.60 = 1664.60
and the upper breakeven price is:
Upper Breakeven Price = Upper Wing – Premium Received
1720 – 4.60 = 1715.40
Notice that this trade is entered for a net credit so we are receiving money when we place the trade unlike a regular butterfly.
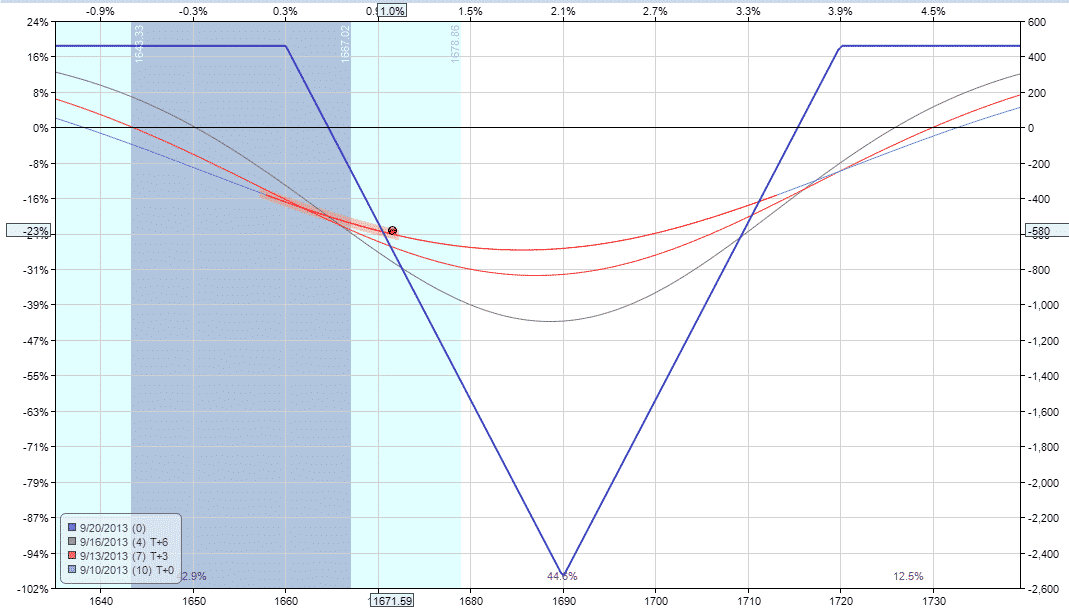
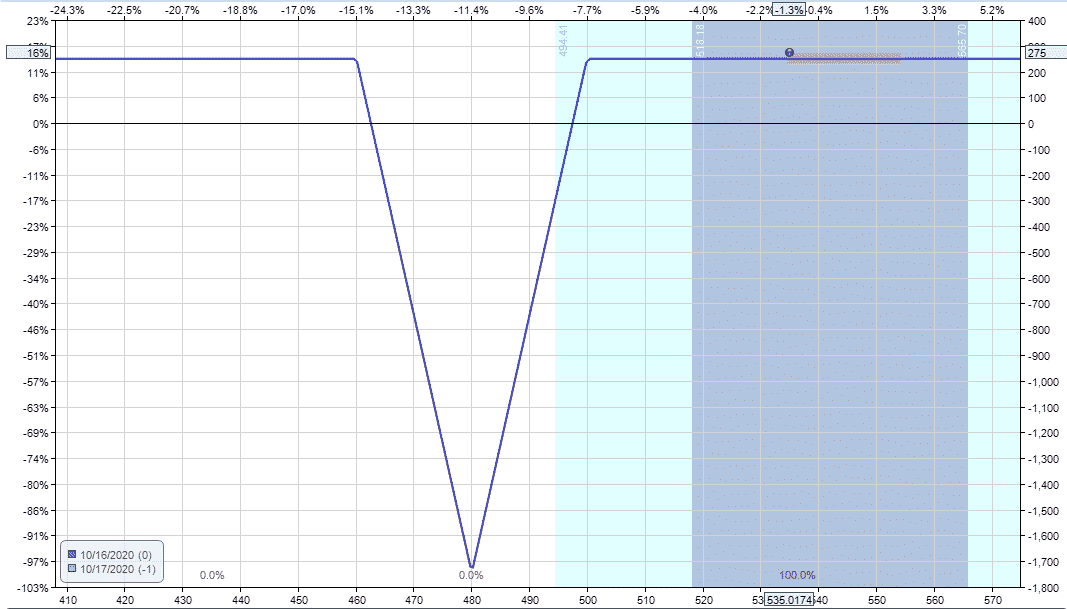
This net credit is also our maximum gain for the trade. Here is how the payoff diagram looks.

This diagram is the exact inverse of a regular butterfly.
The profit potential on the trade is $460 and the maximum loss is $2,540 for a potential return of +18.11%.
Notice that the breakeven points are at 1664.60 and 1715.40, so SPX only needs to move -1.85% or +1.16% for this trade to be profitable.
Over a 7 week period, it is very likely that the stock will move further than that.
If the stock does not move as expected, you would want to exit this trade well before expiry to avoid the maximum loss.
On a 7 week trade such as this one, if the stock has not moved past the breakeven points after 3 to 4 weeks you would want to exit.
A good profit target on this trade would be 10% but if the stock moves quickly outside the breakeven points, you could hold until expiry for a full profit.
Setting a stop loss of between 15-20% would also be advisable.
When this trade was entered, the VIX was at 13.39 which was on the low end of the recent 6 month range.
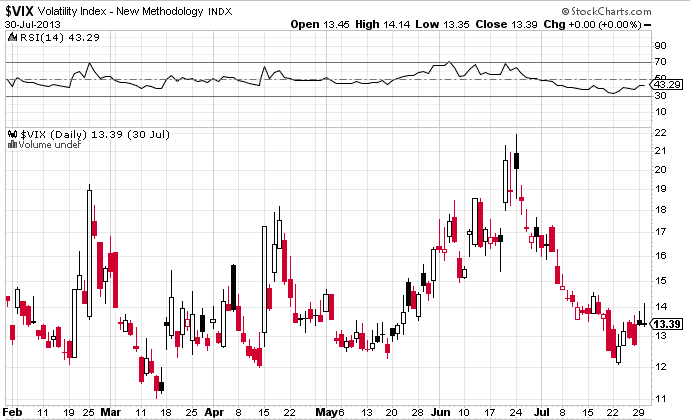
It’s best to enter this trade when volatility is low and that is generally the case when the stock has been moving sideways with small daily candles.
When volatility is low, the bought options are cheaper which allows you to achieve a better potential return on the trade.
A reverse butterfly spreads is a long vega trade, which is another reason why this trade should be entered when volatility is low and a rise in volatility is expected.
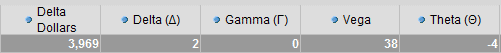
Let’s take a look at the greeks. You can see we are more or less delta neutral for now, but we still want a big move in the stock.
The trade is long vega as well, so a rise in volatility will be beneficial.
The reverse butterfly strategy is not a commonly used strategy, but they can have their place in a low volatility environment.
Stayed tuned for the next installment where we will be looking at using butterflies as part of a combination of strategies and also how to use them as a hedge for iron condors.
Let’s take a look at how the trade worked out.
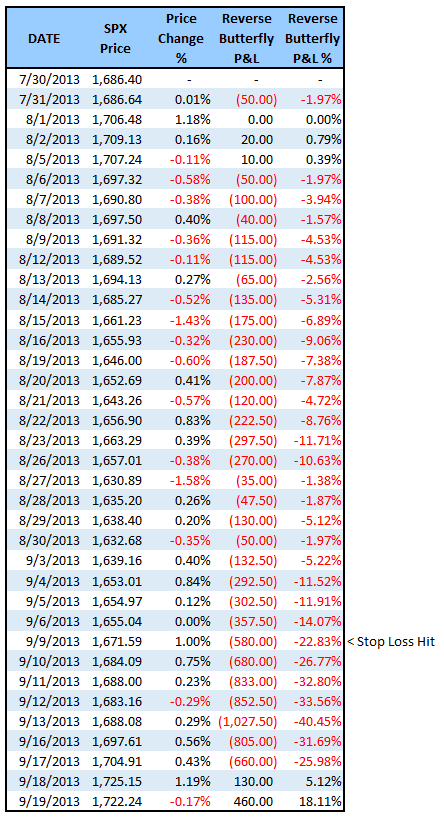
As you can see, the trade was under pressure almost from day 1 and while the trade would have ended in profit, the stop loss was hit on September 10th.
Let’s take a look at a more recent example from September 2020.
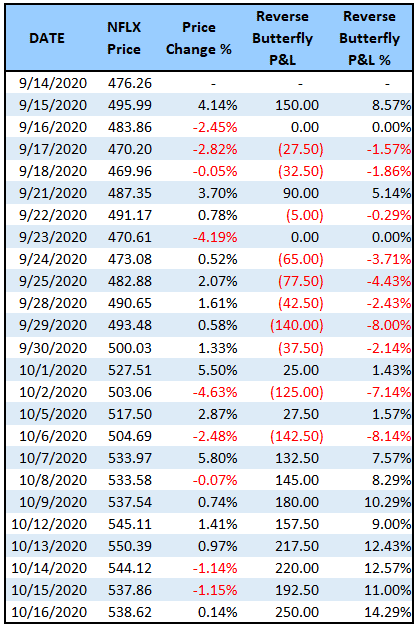
NFLX REVERSE BUTTERFLY EXAMPLE
This is a trade I wrote about in my daily column on Investor’s Business Daily.
Date: September 14th 2020,
Current Price: $476.26
Trade Details: NFLX Reverse Butterfly
Sell 1 NFLX Oct 16th $460 call @ $44.75
Buy 2 NFLX Oct 16th $480 calls @ $33.65
Sell 1 NFLX Oct 16th $500 call @ $25.05
Premium: $250 Net Credit
Max Loss: $1,750
Stop Loss: 20% or $350
Breakeven Prices: $462.50 and $497.50
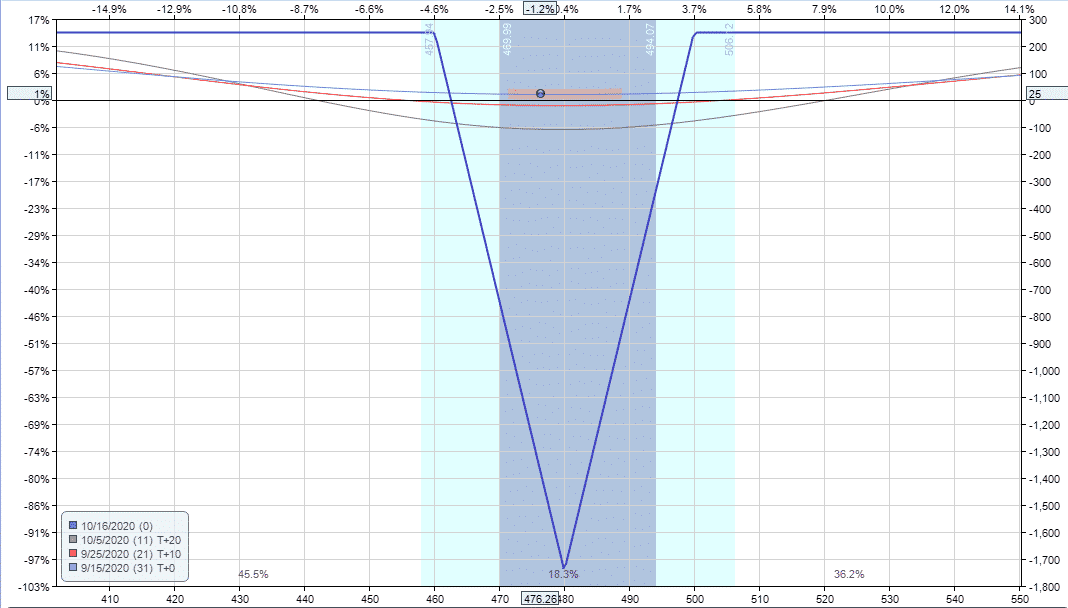
Below you can find a summary of how the trade progressed each day.
As you can see the, trade came under a little bit of pressure but was never down more than 8% and then ended up expiring with a full profit with NFLX stock price finishing outside the upper wing.
On the expiration date, traders could either trade out of the spread, or allow it to expire.
If allowing the trade to expire, there will be assignment costs involved, so it’s best to check with your broker how this would be handled.
ENTRY CRITERIA
You should now have a very solid understand of the reverse butterfly trade and how it works.
Here are a couple of my top tips when looking for reverse butterfly trade opportunities:
- Look for stocks that have traded in a tight range for around 4-5 weeks.
2. Look for stocks with tight Bollinger Bands
3. Look for stocks with a low implied volatility percentile.
FAQ
What Is A Butterfly Spread?
A butterfly spread is a three-legged options strategy that involves buying one call option at a lower strike price, selling two call options at a middle strike price, and buying one call option at a higher strike price.
This creates a profit zone between the middle strike prices where the spread makes the most profit.
What Are The Advantages Of A Butterfly Spread?
A butterfly spread allows traders to limit their maximum loss while still potentially making a profit.
It can also be used in low volatility markets, and has a defined risk and reward.
How Do You Set Up A Butterfly Spread?
To set up a butterfly spread, a trader would buy one call option at a lower strike price, sell two call options at a middle strike price, and buy one call option at a higher strike price.
The middle strike price should be equidistant from the lower and higher strike prices.
The trader would also need to consider the expiration date and the option premiums.
What Are The Risks Of A Butterfly Spread?
The risks of a butterfly spread include the potential for loss if the stock price moves too far away from the middle strike price, or if the implied volatility changes drastically.
The profit potential is also limited by the defined range of the spread.
When Is A Butterfly Spread A Good Strategy To Use?
A butterfly spread can be a good strategy to use in low volatility markets or when a trader has a neutral outlook on the underlying stock.
It can also be used as a hedging strategy to limit potential losses in a position.
What Is The Breakeven Point For A Butterfly Spread?
The breakeven point for a butterfly spread is the middle strike price, plus or minus the cost of setting up the spread.
Any stock price above or below this breakeven point represents potential profit or loss for the trader.
Can A Butterfly Spread Be Adjusted?
Yes, a butterfly spread can be adjusted by changing the strike prices or the number of options bought and sold.
A trader may adjust the spread to increase their profit potential or to limit their losses.
Conclusion
So there you have it, I think that was a pretty thorough guide to butterfly spreads, what do you think?
If you have any questions on anything in this article, feel free to reach out and if you enjoyed this article, please share it on social media.
Trade safe!
Disclaimer: The information above is for educational purposes only and should not be treated as investment advice. The strategy presented would not be suitable for investors who are not familiar with exchange traded options. Any readers interested in this strategy should do their own research and seek advice from a licensed financial adviser.


Great material, Gavin! Thank you so much for spending your time to put this together. This was actually my introduction to option spreads a few months ago. Butterflies are now a central part of my strategy. Even when I’m buying OTM puts for an expected/potential sharp downward move, I place the strikes with the intention to complete a butterfly after the move by selling the head put strike between the wing put strikes that I’m buying.
I’m rereading this article/post/course right now, after having gained more understanding about option dynamics (to see what may have gone over my head when I first read it), and I wanted to suggest a correction. You made a distinction between legging into a butterfly with a debit vertical spread versus a credit vertical spread, with a claim that credit spreads are short volatility and debit spreads are long volatility. From my observation, it is strictly the strike placements around the current price of the underlying that determines theta and vega exposure. Whether it’s a debit spread or a credit spread is irrelevant. I can place a debit call spread with the short strike at the money, and if I place the long strike far enough, I will have positive or neutral theta and negative vega, unless the underlying moves down to a certain price level.
Once again, thank you for your contribution. I have learned so much about options in the past two months. The more insight I gain, the more fascinated I become with options. Words cannot describe how much I love this stuff.
Cheers
Mike
Hi Mike, thanks for the comment and I’m glad this has helped you, sounds like you are doing really well. I agree with you that strike placement determines the theta and vega but I think that may go over the head of most beginners given that credit spreads are “usually” placed out of the money, I’ve gone with that logic.
You’re welcome, Gavin! Thanks for the reply! I agree with you that it’s not a simple concept to grasp for beginners. However, juxtaposing credit and debit spreads with their presumed polarity in vega and theta exposure may lead to unnecessary confusion. I’m speaking for myself here first, and partly for others, as many of the questions I see asked online seem to stem from this confusion. Very few sources seem to explain the concept clearly (maybe some books do, I don’t know). I understood this after tinkering with the risk profile curve with lines +4 @ vol step and lines +4 @ day step, observing where the lines converge and then diverge with opposite polarity. Truly a fascinating thing to behold and understand.
By the way, I use the vega-neutral convergence in my butterfly adjustments. When I want to reduce my negative delta exposure, I place a bullish spread with the vega-neutral zone over a technical support price level and spread the strikes as far as I need to achieve the desired delta. That makes the adjustment short vega above the support and long vega below the support. If the underlying suddenly drops below the support level, then I might as well start benefitting from the volatility spike, as the positive delta of the adjustment gets dampened over the fulcrum of the support price level. The risk is that the potential loss at the vega-neutral zone increases over time for a bull vertical spread (while time increases the P/L of the vega-neutral zone for a bear spread).
Mark Its now 2020 and this was written in 2013 Are there any rule changes to the 1 standard deviation rule since the markets have increased 2 to 4 times?
Hi William, It’s Gavin actually. 🙂
No there are no changes. 1 standard deviation is a standard measure, doesn’t matter what price the underlying is, the calculation is still the same.
thanks but in using the standard deviation table provided above I have another question. In using the SPY for example, the current IV today is 25. Certainly one would not use this high figure so what would be used? .25? Thanks again
Gavin
I loved your example of the weekly double butterfly. In the example above, at what SPX price do both the calls and puts expire worthless and you lose both debit premiums. Have you had success with this strategy in 2020?
I haven’t used it much in 2020 to be honest. In the example, you want SPX to finish at either 1650 or 1750. Anything outside the profits tents you would lose the premium paid.
Hello!
I started studying option spreads recently and I found your site by chance, after reading this article I can say with confidence that this is the most detailed explanation of this topic.
Thank you for your work!
My pleasure and thanks for the kind words. Have a look around, there are plenty of other articles you will enjoy.
Congratulations Gavin! Man, this was so captivating to read. It was like reading a best seller. I truly enjoyed it.
What would you say is better nowadays that we have 0dte on SPX:
A 0dte OTM butterfly 20 or 25 wide ? And what stop loss would you recommend for that 0dte Gavin ?
Or you would go a weekly butterfly or further out imn time ?
Thanks again for putting this on
Hey Charles, 0 DTE is a wild ride, but I would say 25 wide is best. Stop loss at 2x the premium paid.
Hi how do i find the stocks to read range bound understan the principal need the right stock