


You’ve heard of condors and butterflies.
You may even have heard of the Jade Lizard.
But have you heard of the Rhino?
Contents
- Start With Half Size
- Scale Up To Full Size
- Adding Call Calendars
- Take Profit Level
- Removing The Hedges
- Downside Adjustment
- Profit Target Reached
- FAQ
- Conclusion
Seth Freudberg, head options trader at SMB Capital said on The Money Show that the Rhino is his favorite income options strategy.
On SMB’s blog, he said that their Rhino backtest shows a 87% win rate with average win of 6.24% and average loss of 4.95%.
He goes on to say that the Rhino is the largest single strategy that their options desk trades — with 40% of their capital allocation in the Rhino.
Traders should always do their own research and backtesting when evaluating a new strategy.
I like to use Option Net Explorer to perform backtests.
The definitive guide to the Rhino would be the September 2015 presentation by Brian Larson, the originator of the Rhino strategy.
However, an investor can adjust the parameters and rules according to his or her trading style and risk tolerance.
An investor will typically initiate the strategy on a sideways moving index option such as the RUT or the SPX, with 10 to 12 weeks to expiration (or around 77 days).
The investor would like for the underlying to move sideways while the trade generates income from time decay.
The strategy is a lower stress and slower moving trade due to it flat low-gamma T+0 line.
To illustrate this strategy, let’s look at a hypothetical trade on RUT using historic options data.
It starts out as the use of all-put broken-wing butterflies (BWBs) centered below the current price with a 50-point wing on the lower side and a 40-point wing on the upper side.
This configures the BWB to have more risk on the downside and limited risk on the upside.
Start With Half Size
The investor reserves $25,000 worth of planned capital for the trade and trade management.
Starting with a half size position, the investor places five BWBs with the short strikes below current price and the upper long strike in-the-money by about 10 points.
Date: Jan 2, 2020
Price: $1667
Buy 5 RUT Mar 20 – $1585 put @ $20.65 (78 days till expiration)
Sell 10 RUT Mar 20 – $1635 put @ $32.44
Buy 5 RUT Mar 20 – $1675 put @ $46.65
Debit paid: $1,210
Max loss on downside: $6,210
Max loss on upside: $1,210
Max gain: $18,790
The payoff diagram at start of trade should have a configuration that looks like this.
Don’t you just love the look of that T+0 line?
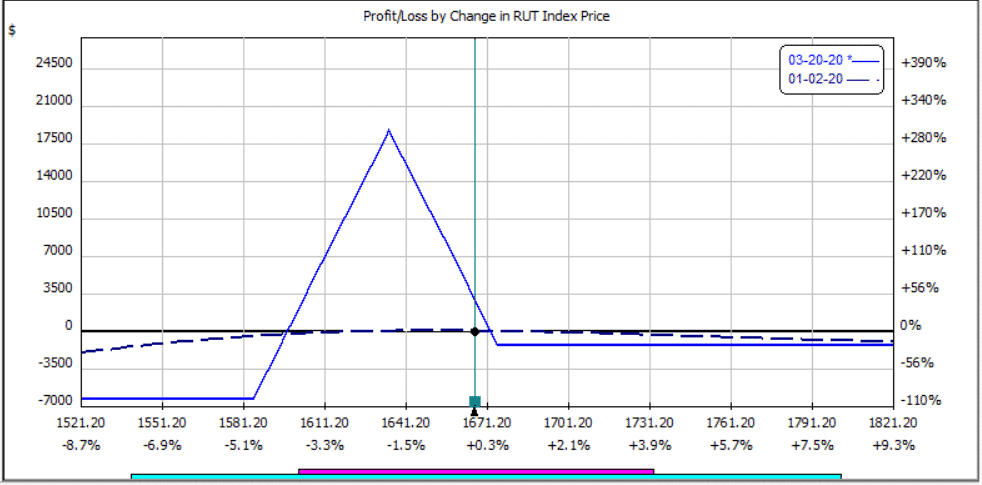
The 50/40 wingspan difference is often not enough to give the trade an initial credit, but does provided limited risk on the upside.
If the price does end up breaking out of the range, it is preferable that it breaks out to the top.
The intention is to scale up to full size if price moves above the upper long strike.
If the price goes down, the trader does not scale.
If the trade goes against the investor initially with RUT price dropping, then the investor will take off the BWBs and re-establish a new BWBs at the new price.
Essentially, rolling the BWBs down with the price.
On January 15, RUT moved up past our long upper strike to $1682.
The payoff diagram is now like this:
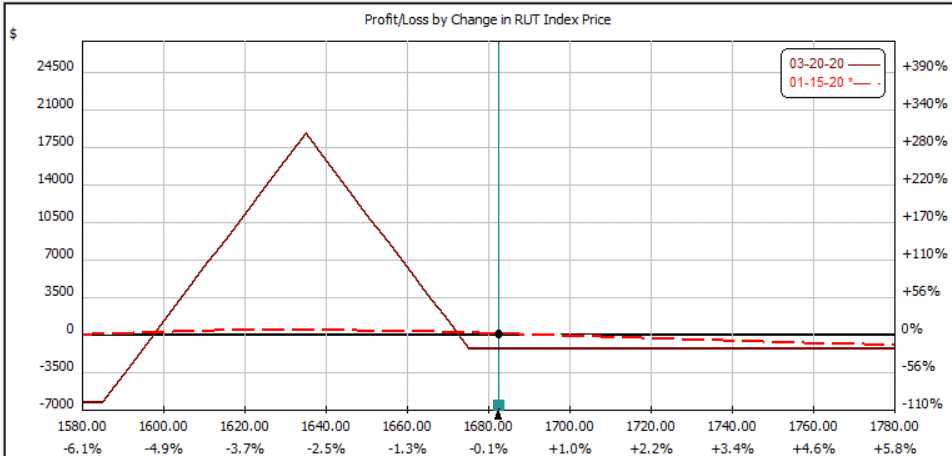
Investors of these trades watch the payoff diagram and the Greeks just as much, if not more than, their candlestick charts.
Scale Up To Full Size
The investor adds another 5 BWBs positioned in the same configuration in relation to the new current price.
Date: January 15
Price: $1682
Buy 5 RUT Mar 20 – $1600 put @ $15.73
Sell 10 RUT Mar 20 – $1650 put @ $26.40
Buy 5 RUT Mar 20 – $1690 put @ $40.42
Additional debit paid: $1,675
Total debit paid on entire position: $2,885
Max downside loss on entire position: $12,885
Max upside loss on entire position: $2,885
Max possible gain: $29,615
The full position payoff diagram now looks like this:
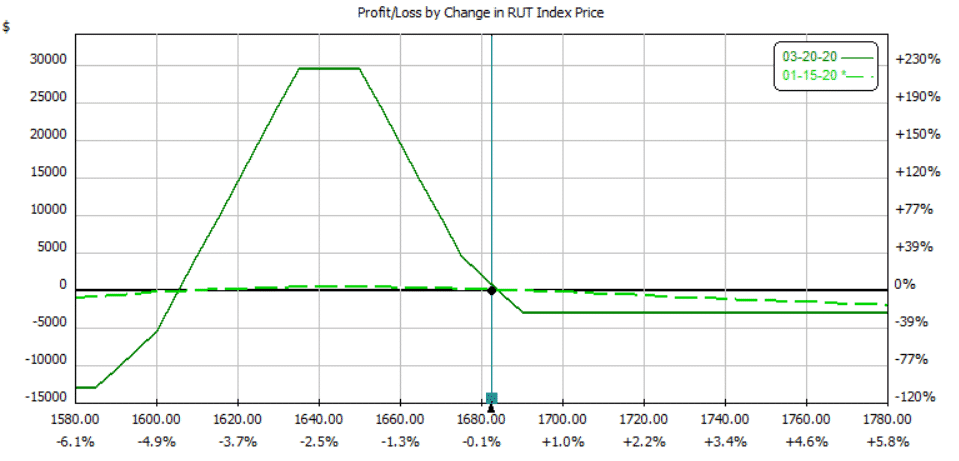
The investor monitors to ensure that delta stays small and that the T+0 line stays flat.
With more than 60 days to go in the trade, a daily check is sufficient.
If less than 3 weeks are left in the trade, the investor will need to check more frequently.
Adding Call Calendars
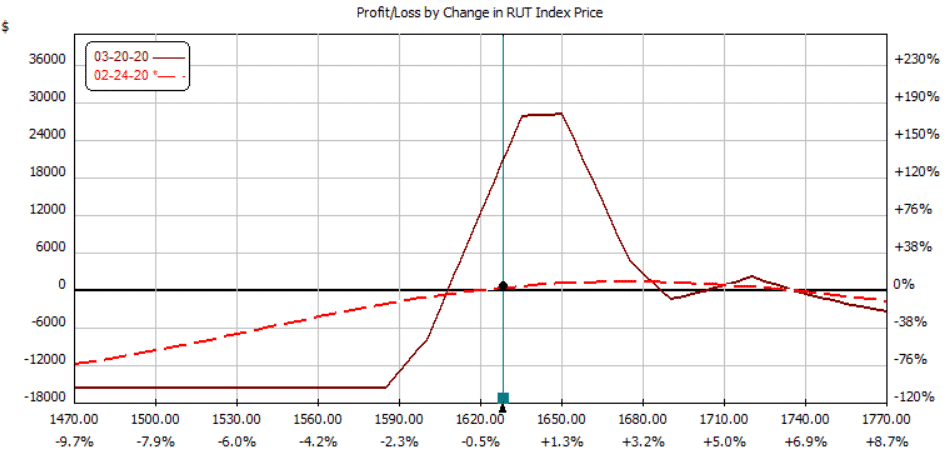
On February 11, the delta went to -34 with the T+0 line starting to bend, but only by a little bit:

The price is higher than what is preferred.
While the trigger to start adjustment will depend on personal style, the investor decides it is time to adjust since delta has exceeded 25.
The investor adds call calendars above the price to reduce the delta.
Date: Feb 11
Price: $1677
Sell 3 RUT Mar 20 – $1720 call @ $12.20
Buy 3 RUT Apr 17 – $1720 call @ $21.15
Additional debit paid: $2,685
Max risk of entire position: $12,885 + $2,685 = $15,570.
(This adjustment is only made when the upside is tested. If the downside is tested, the investor instead takes off the second set of butterflies.)
The delta now is back down to -14 and the graph looks like the two horns of a rhino (hence the name of the strategy).
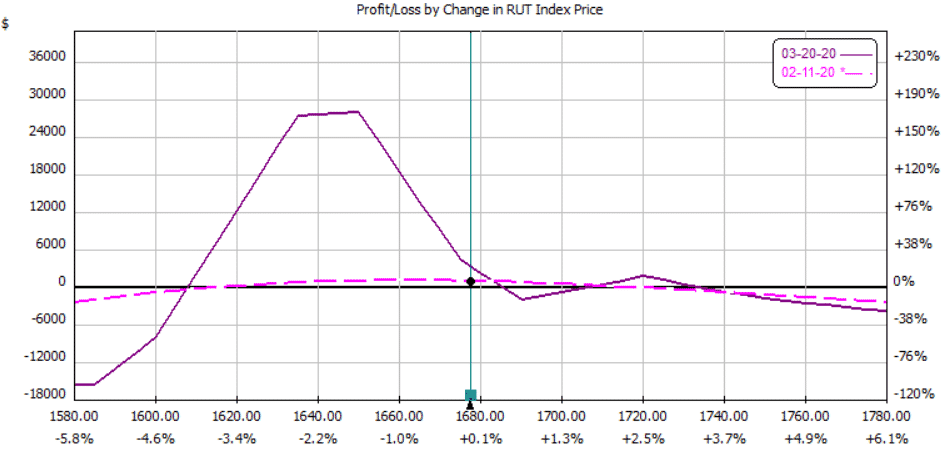
Note how flat the T+0 line is and the wide profit range.
If prices continues to move up, the investor can add another call calendar above the market.
Alternatively, the investor can remove the call calendar and add a broken wing butterfly as a hedge.
Take Profit Level
One of the motivations of this strategy is capital preservation rather than big win.
As such, this strategy can be slow to produce profits, but I really like that and it suits my style.
Therefore, the investor must apply patience and take smaller profits.
If there is 10% profit in the first half of the trade duration, the investor closes entire position for the profit.
That would be $2500 as being 10% of the initial planned capital of $25,000.
As the trade gets closer and closer to expiration, the trader will lower the profit target.
In this example, it is now halfway through the trade duration, so the trader reduces the profit target to $2000.
Removing The Hedges
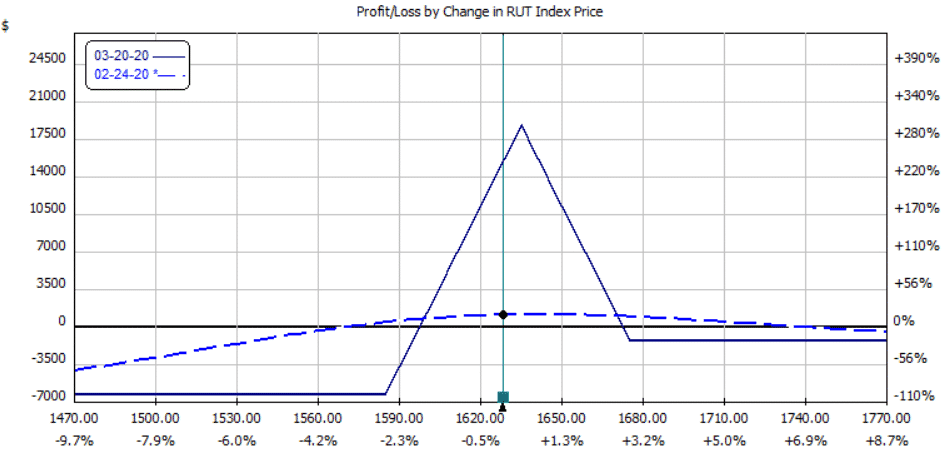
When prices comes back down, the investor will remove the hedges.
On February 24, there was a significant down move in the market and delta increased to 43.
The investor removes the second set of butterflies.
Date: Feb 24
Price: $1628
Sell 5 RUT Mar 20 – $1600 put @ $29.28
Buy 10 RUT Mar 20 – $1650 put @ $48.94
Sell 5 RUT Mar 20 – $1690 put @ $73.20
Credit: $2300
Profit from butterfly: $2300 – $1675 = $625
This reduces the delta down to 30 — not enough.
So, the trader closes all the call calendars as well.
Buy 3 RUT Mar 20 – $1720 call @ $2.60
Sell 3 RUT Apr 17 – $1720 call @ $8.53
Credit: $1779
Loss from calendar hedge: $1779 – $2685 = –$906
This brings the delta down to 4 — excellent.
And the graph looks better.
The next day February 25, the market dropped a lot.
Price is now below the lower put and delta is up to 40 again.
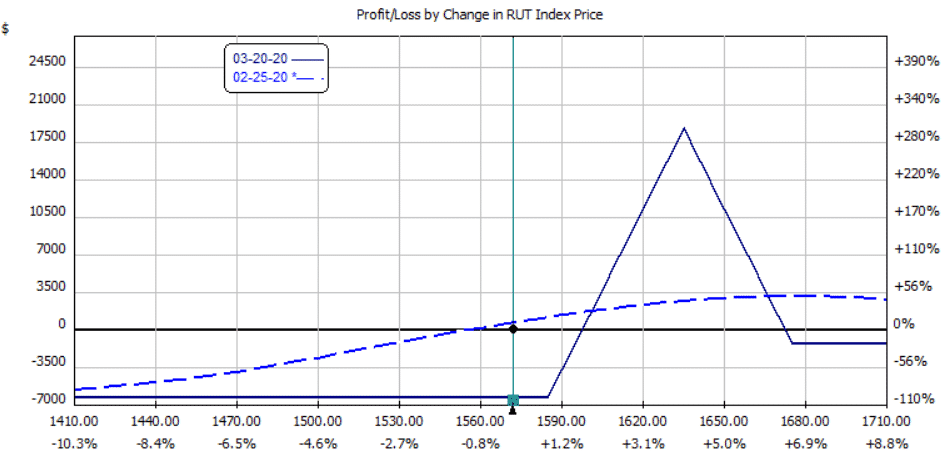
Downside Adjustment
The trade needs to be adjusted on the downside by rolling the whole butterfly down.
Date: Feb 25, 2020
Price: $1572
Close existing butterfly:
Sell 5 RUT Mar 20 – $1585 put @ $50.00
Buy 10 RUT Mar 20 – $1635 put @ $77.21
Sell 5 RUT Mar 20 – $1675 put @ $107.30
Credit: $1,440
Open new butterfly:
Buy 5 RUT Mar 20 – $1490 put @ $20.84
Sell 10 RUT Mar 20 – $1540 put @ $33.46
Buy 5 RUT Mar 20 – $1580 put @ $47.97
Debit: $945
Note that in this case the credit received from closing existing butterfly is able to pay for the new butterfly.
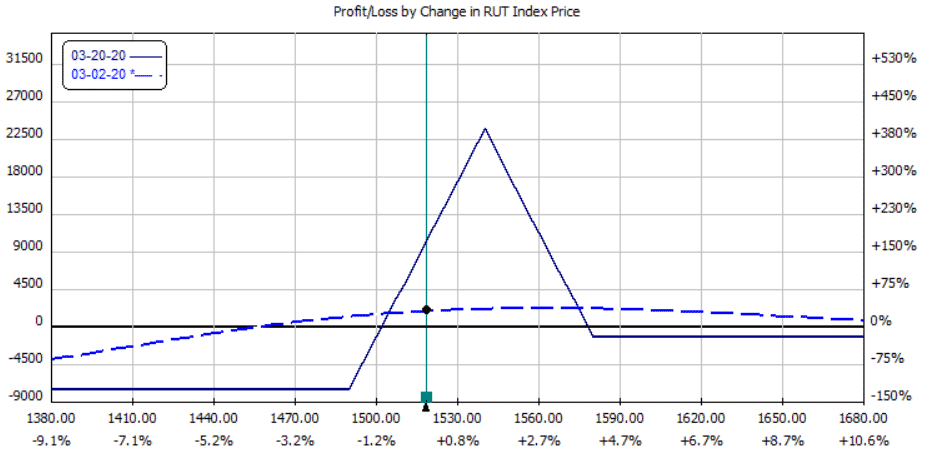
Here is new payoff diagram with newly positioned butterfly with flat T+0 line.
The delta is at a very good value of -3.
At this point, we’ve been in the trade for about 42 days, are not showing any profit and had to make a few adjustments.
Continuing on to Feb 27, the trade never reached profit target nor hit stop loss.
It is three weeks till expiration, investor reduces the profit target further to $1000.
At this point, the investor is eager to exit the trade as soon as possible, otherwise it can start getting more dangerous due to increasing gamma and wider profit and loss swings as the butterfly gets close to expiration.
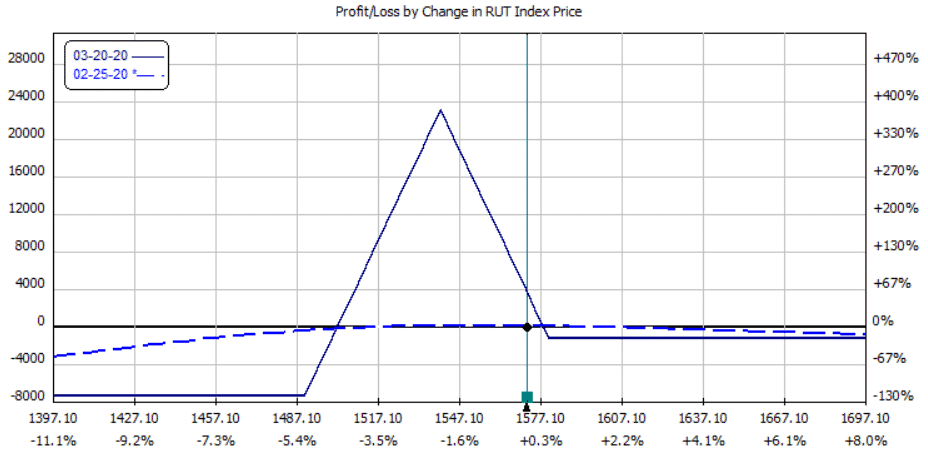
Profit Target Reached
On March 2, profit target was reached after 61 days in the trade.
Investor closes out the trade with total profit of $1734, or 6.9% of planned capital of $25,000.
In this example, the investor had risked at most $15,570.
The profit percentage of actual capital risked is $1734/$15570 = 11%.
Date: March 2
Price: $1519
Sell 5 RUT Mar 20 – $1580 put @ $74.96
Buy 10 RUT Mar 20 – $1540 put @ $50.80
Sell 5 RUT Mar 20 – $1490 put @ $32.10
Credit: $2730
FAQ
What Is The Rhino Options Strategy?
The Rhino options strategy is a high probability, low risk strategy designed to generate income in a variety of market conditions.
It involves selling a combination of call and put options at different strike prices and expiration dates to create a neutral, delta-neutral position.
How Does The Rhino Options Strategy Work?
The Rhino options strategy works by selling a combination of call and put options at different strike prices and expiration dates.
This creates a neutral, delta-neutral position that profits from time decay and volatility contraction.
The strategy is designed to limit losses while still generating consistent income.
What Are The Benefits Of Using The Rhino Options Strategy?
The benefits of using the Rhino options strategy include its high probability of success, low risk, and ability to generate consistent income in a variety of market conditions.
The strategy is also relatively easy to understand and implement.
What Are The Risks Of Using The Rhino Options Strategy?
The main risk of using the Rhino options strategy is that it can be vulnerable to sudden market movements, particularly if those movements are outside the range of the options sold.
Additionally, the strategy requires careful management of the positions and adjustments may need to be made over time to maintain its effectiveness.
Is The Rhino Options Strategy Suitable For Beginners?
The Rhino options strategy is suitable for traders of all experience levels, including beginners.
However, it’s important to have a solid understanding of options pricing, volatility, and risk management before implementing the strategy.
It’s also recommended to practice the strategy using a demo account before trading with real money.
What Are Some Tips For Using The Rhino Options Strategy Effectively?
Some tips for using the Rhino options strategy effectively include carefully selecting the strike prices and expiration dates of the options sold, monitoring the positions regularly, and making adjustments as necessary to maintain a neutral, delta-neutral position.
It’s also important to have a solid understanding of options pricing and volatility.
Conclusion
Payoff diagram at exit:
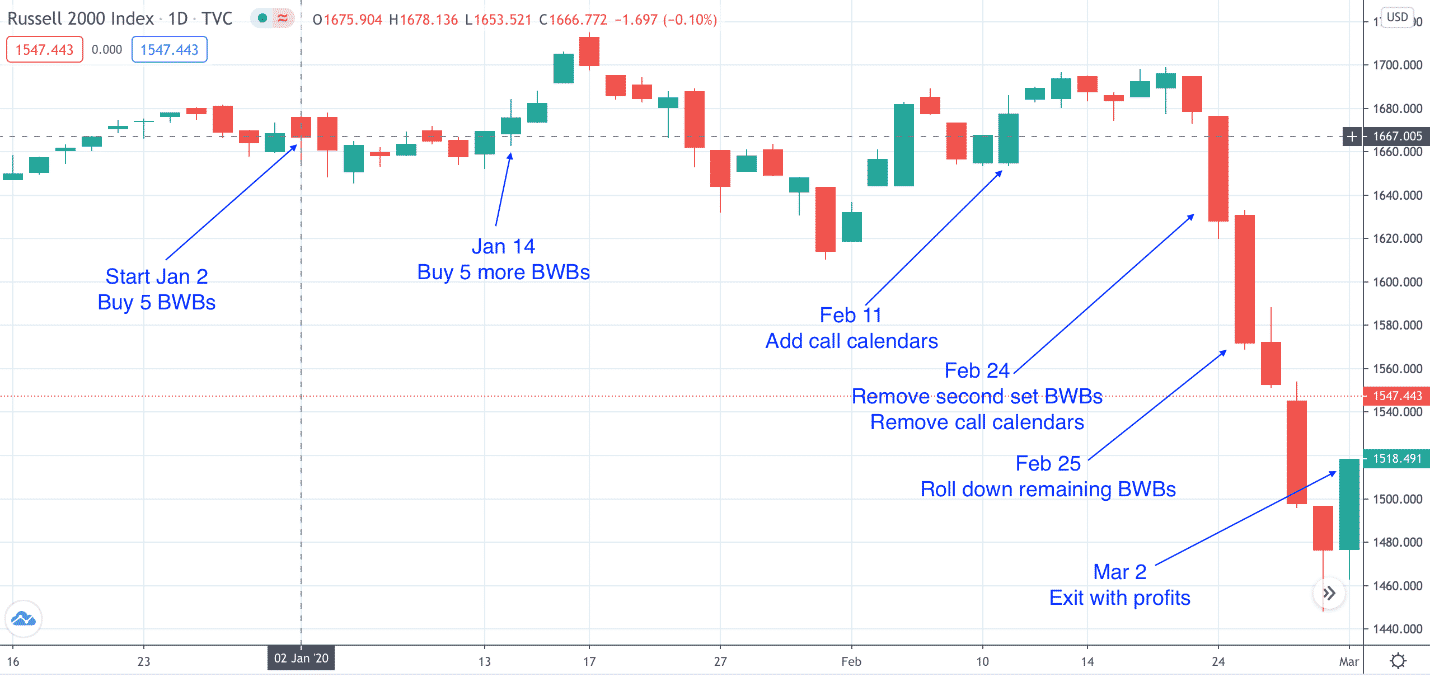
Price chart throughout the trade:
Tally credit and debits:
Jan 2 (start trade half size): –$1,210
Jan 14 (scale to full size): –$1,675
Feb 11 (add call calendars for upside adjustment): –$2,685
Feb 24 (removes second set of butterflies): $2,300
Feb 24 (and closes calendars): $1,779
Feb 25 (close existing butterfly): $1,440
Feb 25 (and open new butterfly for downside adjustment): –$945
Mar 2 (exit trade by closing new butterfly): $2,730
Final profit: $1,734 (not including commissions slippage)
The entire trade took two months.
This was a good example of the Rhino strategy showing how to make upside adjustments as well as adjustments on the downside.
We saw how to scale in as well as how to reduce the profit target as expiration nears.
We noticed that sometimes hedges can increase our profits, and sometimes, they can decrease our profits.
We also saw that when the trade is able to accumulate some profits early on, it was able to handle a market sell off at the end.
Trade safe!
Disclaimer: The information above is for educational purposes only and should not be treated as investment advice. The strategy presented would not be suitable for investors who are not familiar with exchange traded options. Any readers interested in this strategy should do their own research and seek advice from a licensed financial adviser.


Hi Gav,
Thank you for this priceless post, excellent strategy. One thing I would like to further understand: right before the section of Take Profit Level, you wrote “
Alternatively, the investor can remove the call calendar and add a broken wing butterfly as hedge.“… do you mean adding a call broken wing butterfly as a hedge instead of the call calendar? If yes, what would be the ideal structure of that?
Thank you Gav.
Peter
Hi Peter, yes a call broken wing butterfly. Keep you eye out for an updated post on the topic.
The guideline uses call calendars, but your example uses put calendars.
Thanks fixed.
Greetings, Gavin. Very informative. I have a question and a comment:
Sorry for a basic question: What is a T+ O line?
Comment: you write about establishing calendar calls, but you show the trade was done with puts (you show that twice). Kind of confusing. Did you mean calls in the trade description?
thanks in advance for answering.
T+0 just means the profit as of today. Yes I meant calls in the description, sorry about that, fixed now.
Could you shorten the duration of the trade and start with something like 7DTE and just manage much more actively? If so, how would the parameters change, if at all?
Technically yes, but I would not do this personally. The trade would be hard to manage and would move very fast. You should backtest it first to see how it performs in different market environments.
I know the original butterfly is of the put variety, but I am more of an iron trader. Is there any downside to using iron butterflies in place of the put/call butterflies?
Hi Mike, the only issue would be if the short calls are in-the-money you might run the risk of early assignment.
As long as I stick with Index / European style options then no issue?
By the way, I want to take a minute and give you a great big Thank you for all you do. I list you among the very best sources of trading education out there, well done!
Yes very true, I forgot we were talking about RUT there for a minute. Ah shucks, thanks much appreciated.
Good job, Gavin.
I sometimes trade this structure and method. I have profit rules which are different. For instance, if I see a “nice” profit at DIT < 10, I'll just take the money and run.
What do you consider as your go-to, relaxed income strategy? Is it this one, or do you prefer another, and why?
I love the strategy and its resilience to market swings however, there are very large potential losses with this. Trying
to hedge with long DTE puts severely degrades potential benefits. How do you hedge with go with no hedge at all?