


Contents
- Introduction
- The Bid-Ask Spread
- Volume
- Implied Volatility
- Delta
- Customizing The Interactive Brokers Default View
- Viewing More Data
- Free Options Data
- Yahoo
- CBOE
- NASDAQ
Most traders reading this will have an online brokerage account with free, real-time quotes.
In this post, I’ll walk you through how to find and read options quotes from various free sources and also walk you through my setup within Interactive Brokers.
Introduction
Some traders who are just starting their journey may not have an online account with options capability, so for those traders I’ll also show you a couple of sources for where to find free option quotes.
Usually these are delayed by 15-20 minutes so you wouldn’t want to trade using these quotes, but it can be a good place for beginners to get a feel for option trading and learn how to read the price quotes.
If you’re a complete beginner, you should check out my 12,000 word post on Options Trading 101.
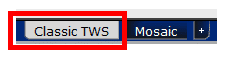
I use Interactive Brokers, so let’s take a look at them first. Before we get started, one very important point with Interactive Brokers – make sure you are using the Classic TWS view and not Mosaic.
Mosaic is awful and incredibly hard to use.
Within the Classic view, you can set up various tabs based on the stocks you want to trade or various sectors etc. You can see below that I have a few different tabs set up.
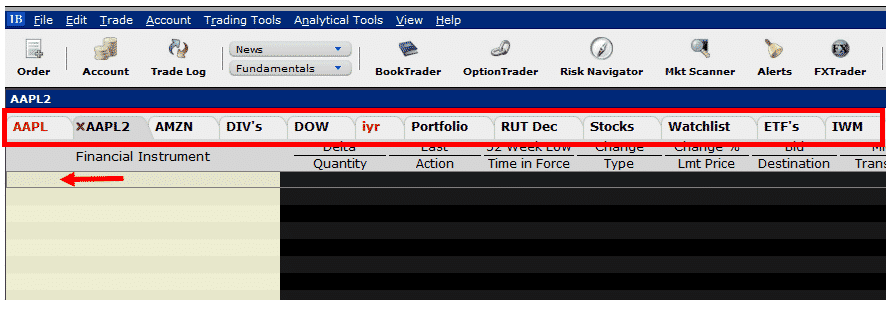
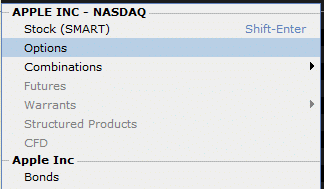
In this example we’ll look at AAPL stock, so on our new tab we type in the ticker “AAPL” into the box shown by the red arrow. Then we select “Options” from the menu.
This brings up the following box containing lots of information.
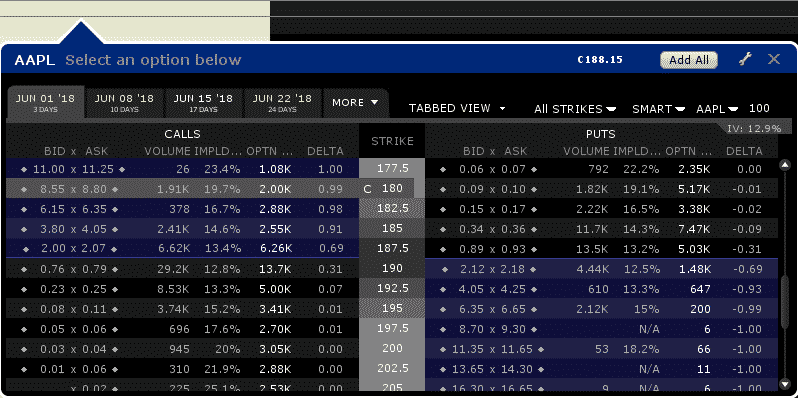
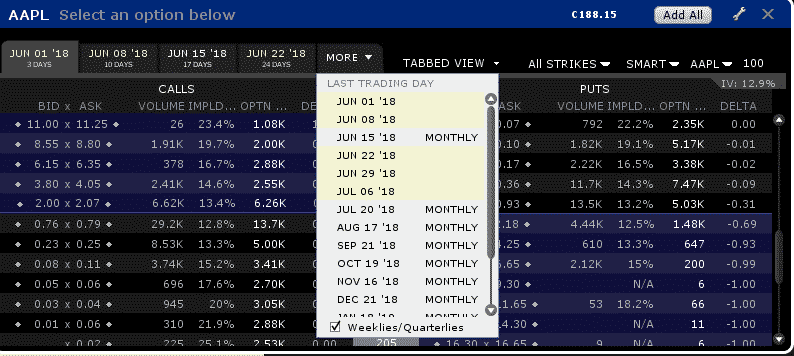
The first thing we want to do is select the expiration period that we are going to trade.
There are four available to choose from – June 1st, 8th, 15th and 22nd. Well done if you guessed that the tabs in yellow represent weekly options and the tab in white represents the standard monthly contract.
We can also select the More button which will allow us to choose from expiration periods that are further out in time:
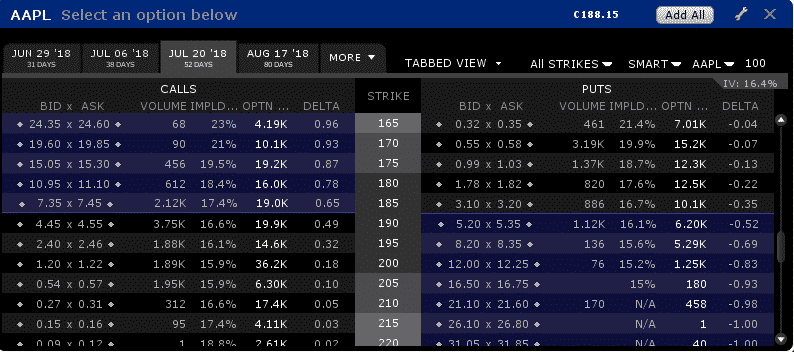
Let’s say we want to trade the July options, we select July and look at the table.
Unfortunately, with Interactive Brokers, they only show the near to the money options. If you want to see further out of the money options, you need to scroll up or down. Let’s use the at-the-money options and learn how to read the table.
The Bid-Ask Spread
First and foremost, we have the calls on the left and the puts on the right. Looking at the calls we have the bid price and the ask price.
Hopefully you know what a bid-ask spread is, but for those that don’t here’s a quick explanation:
The bid price is the highest price the market will currently pay to buy the option. The ask price is the lowest price the market will currently sell the option.
Usually when trading options, you can receive a price close to the mid-point of the spread, but sometimes the market makers will make you pay a little extra or receive a little less.
For example, the July $195 call has a spread of $2.40 – $2.46. The mid-point would be $2.43 but we may not be able to get filled at this price.
If we were buying the call, we might have to pay $2.44 or $2.45 and if we were selling the call we might only get $2.42 or $2.41.
AAPL is a highly liquid stock, so our chances of getting filled near the mid-point is much higher than if we were trading options on a less liquid stock.
Volume
Next in the table we have volume. Volume and Open Interest are related but also decidedly different. Volume is the number of contracts traded during the day’s session and that balance is wiped clean every day.
Whether a trader is opening (buy to open or sell to open) or closing (buy to close or sell to close), it counts towards that days option volume for that particular expiry and strike price.
Open interest on the other hand is a tally of the total number of option contracts open and active at each strike. This represents all trades that have not been closed or exercised. The number is only updated at the end of the trading day once all trades have been tallied.
An interesting quirk is that volume can actually be higher in any given day than open interest.
For example, consider this case:
Day 1: Trader A buys 5 contracts to open. We have daily volume of 5 and have 5 open contracts.
Day 2: Trade A sells his 5 contracts and Trader B buys 20 contracts to open.
On day 2, volume would be 25 and open interest would be 20.
The important thing to note is that traders should focus on options with high volume (liquidity) and open interest.
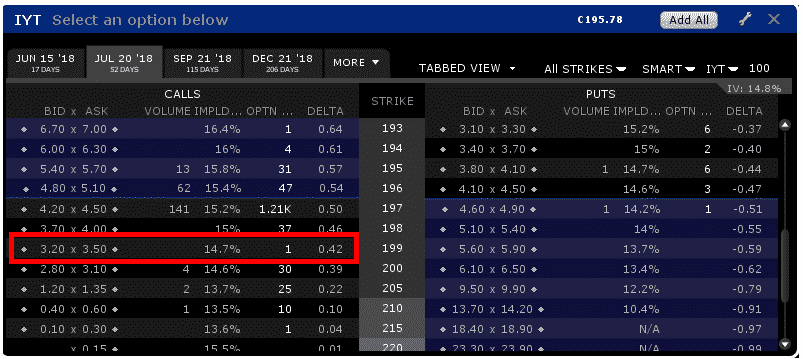
For example, take this option table on IYT, the Transportation ETF.
It wouldn’t be wise for a trader to open 20 contracts in the 199 calls. Firstly, because the bid-ask spread is quite wide and there is no volume.
But also because this would represent basically all of the options open interest. In this case, the market makers will take advantage of you if you need to close the position in a hurry.
Good luck getting filled at the mid-point on those!
Implied Volatility
The fourth column in the table is Implied Volatility. This is a very important metric for option traders. Implied volatility is the only unknown element in the options pricing model, because we cannot know in advance how much a stock will move between now and expiration.
This value is an estimate, but the key thing to remember is that, just like a stock, we want to buy low and sell high.
We want to be a net buyer of options when implied volatility is low (options are cheap) and be a net seller of options when implied volatility is high (options are expensive).
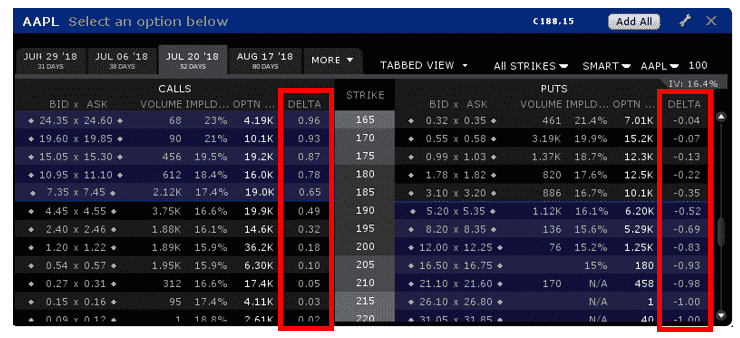
Delta
Delta is another important metric for option traders, so this is another column I like to include in the options table.
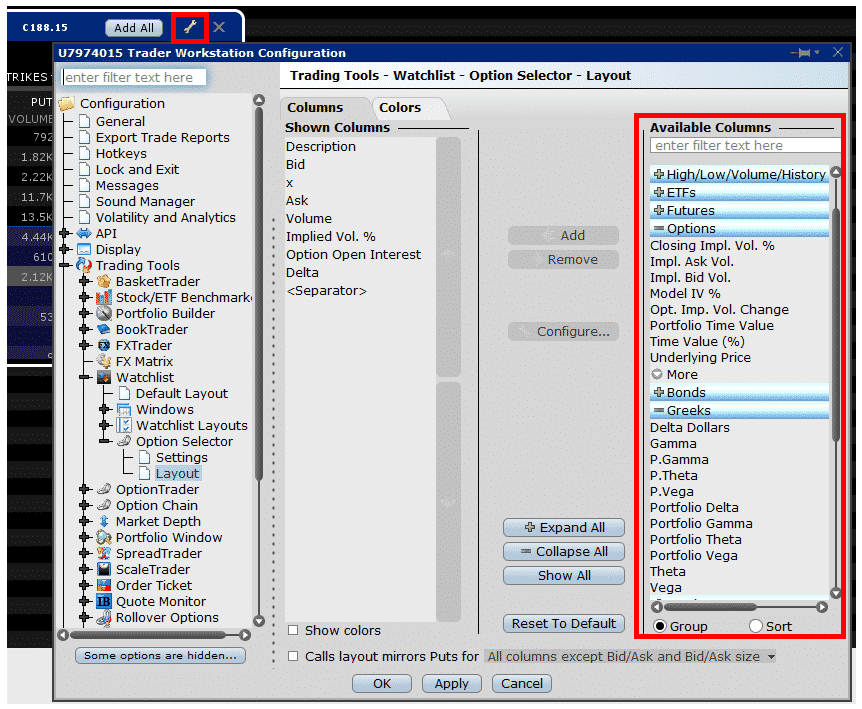
Customizing The Interactive Brokers Default View
It’s very simple to change the column headings within Interactive Brokers, simply click the spanner icon and choose the new headings that you want to include.
Viewing More Data
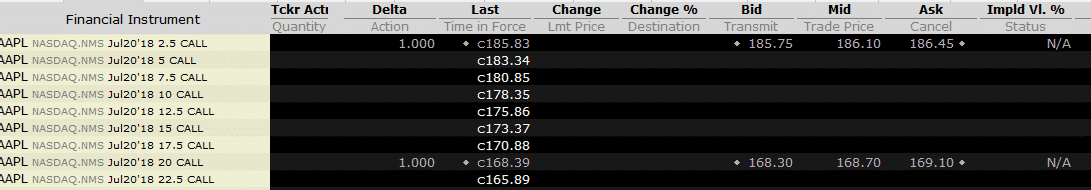
If you want to view more data than is just shown in these small screens, you can add various options to the main tab. You can add them one by one by left clicking on each strike. Alternatively, to add all the strikes within the expiry period, select Add All.
The only issue with this is that you end up with a bunch of options that nobody will be interested in trading.
There is a really simple method to get rid of all the “junk” strikes:
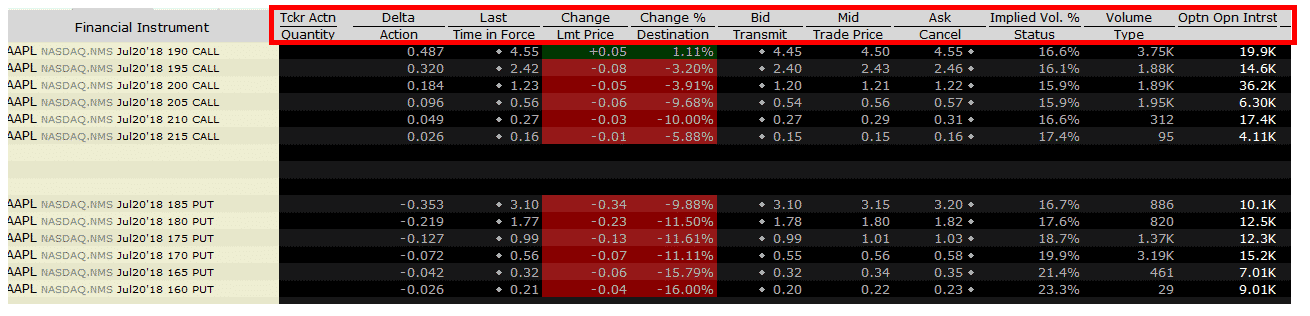
- Make sure Delta is one of you headings. If not, simply click the spanner icon and add it as shown previously.
- Sort by Delta.
- Remove any options that don’t interest you (i.e. anything with Delta very close to 0 or 1.
This leaves you with a pretty good looking table of options. I’ve also highlighted below the column headings I use, you may want to set yours up in a similar fashion.
I usually like to add a few line breaks in between the calls and the puts, this is where my live orders will sit.
Free Options Data
There are a number of free sources for options data if you don’t yet have a brokerage account set up. The main ones are Yahoo, CBOE and Nasdaq.
Typically, the prices shown in these tables are delayed by 15 to 20 minutes, but they can be a good place to start and to familiarize yourself with options tables.
If you’re looking at data after the market close, the table will be the same as what you would see in a brokerage account in any case.
I’ll use these sources occasionally because some are shown in a more user-friendly fashion than Interactive Brokers.
However, you wouldn’t want to be trading from delayed prices. It can be done, but you are much better off using a broker platform.
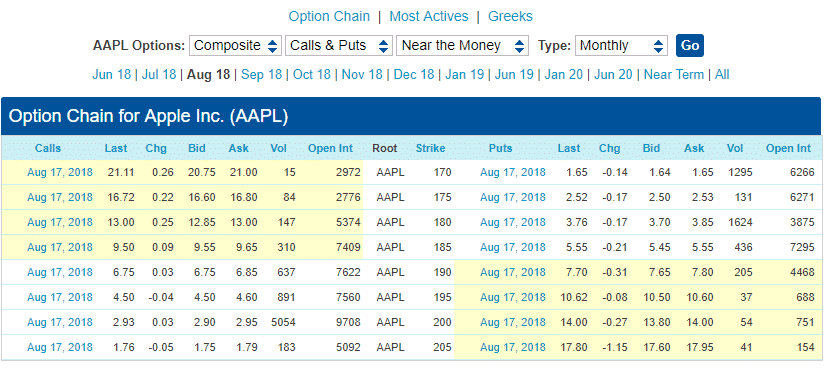
Yahoo
Yahoo displays option data in either List View or Straddle View. The screenshot below shows the Straddle View to keep it consistent with Interactive Brokers.
One distinct disadvantage you might notice here is that Yahoo only shows strikes in $5 increments whereas Interactive Brokers shows the full chain down to $1 strikes. They also don’t show implied volatility data or delta.

CBOE
Similar to Yahoo, the CBOE data does not show implied volatility or delta. Also, when showing the Near the Money data, it does not include a huge selection of strikes.
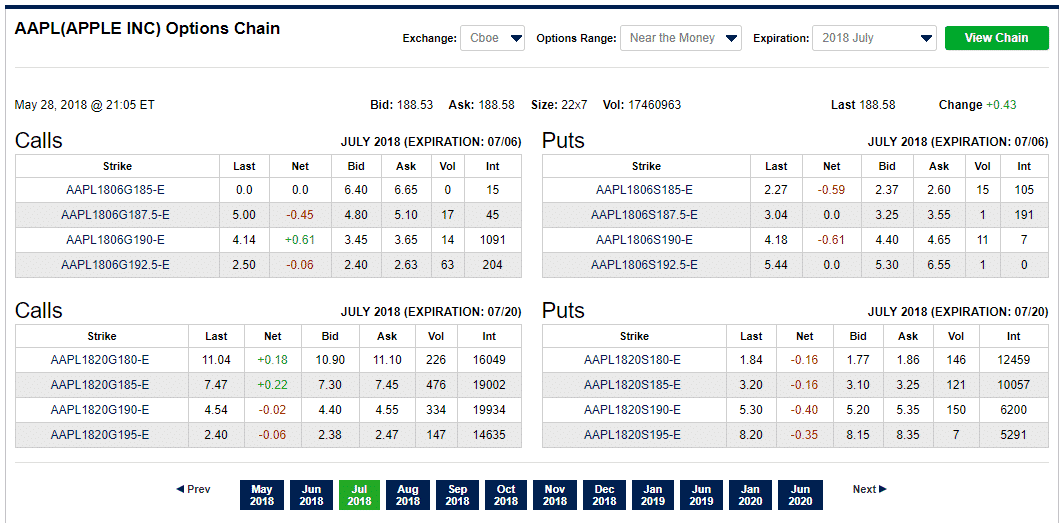
NASDAQ
The Nasdaq options table is very similar to the CBOE’s and also doesn’t show implied volatility or delta.
I hope you enjoyed this quick tutorial, if you think other might also enjoy it, please take a minute to share it on social media.
Trade safe!
Disclaimer: The information above is for educational purposes only and should not be treated as investment advice. The strategy presented would not be suitable for investors who are not familiar with exchange traded options. Any readers interested in this strategy should do their own research and seek advice from a licensed financial adviser.


