
When trading options, one of the hardest concepts for beginner traders to learn is volatility, and specifically how to trade volatility.
After receiving numerous emails from people regarding this topic, I wanted to take an in depth look at option volatility.
Contents
- Introduction
- What is Volatility?
- Historical Volatility and Implied Volatility
- The Short Straddle
- The Long Straddle
- So How Does Volatility Affect These Positions?
- Trading VIX Futures or VXX
- Trading Volatility With a Directional View
- Concluding Remarks
Introduction
Tired of guessing the direction of your stock wrong?
Losing money on your options positions despite being correct in your directional assumption?
Maybe volatility trading is for you!
Catchy slogans aside, trading volatility may not be as glamorous as other trading paths.
After all, the average person cannot list any famous volatility traders.
Despite this the options market is steadily growing and therefore volatility is becoming ever more important.
Trading volatility can also be extremely rewarding, so let’s learn a few ways how to trade it.
What is Volatility?
Volatility is the statistical measure of dispersion of returns in a stock or index. Or keeping it simple it is how much an asset will move.
In the options world how much, the market thinks an asset will move is shown by its implied volatility. When an individual trades volatility they are usually expressing one of two views.
- Volatility is either overpriced, meaning they think the stock will move less than the market implies.
- Volatility is under-priced, implying they think stock will move more than the market implies.
Here is a theoretical example to demonstrate the idea.
Let’s look at a stock priced at 50. Consider a 6-month call option with a strike price of 50:
If the implied volatility is 90, the option price is $12.50
If the implied volatility is 50, the option price is $7.25
When implied volatility is 30, the option price is $4.50
This shows you that, the higher the implied volatility, the higher the option price.
Historical Volatility and Implied Volatility
We know historical volatility is calculated by measuring the stocks past price movements.
It is a known figure as it is based on past data.
I want go into the details of how to calculate HV, as it is very easy to do in excel.
The data is readily available for you in any case, so you generally will not need to calculate it yourself.
The main point you need to know here is that, in general stocks that have had large price swings in the past will have high levels of Historical Volatility.
As options traders, we are more interested in how volatile a stock is likely to be during the duration of our trade.
Historical Volatility will give some guide to how volatile a stock is, but that is no way to predict future volatility.
The best we can do is estimate it and this is where Implied Vol comes in.
Implied Volatility
Implied volatility is an estimate, made by professional traders and market makers of the future volatility of a stock. It is a key input in options pricing models.
Implied Volatility takes into account any events that are known to be occurring during the lifetime of the option that may have a significant impact on the price of the underlying stock.
This could include and earnings announcement or the release of drug trial results for a pharmaceutical company.
The current state of the general market is also incorporated in Implied Vol.
If markets are calm, volatility estimates are low, but during times of market stress volatility estimates will be raised.
The Black Scholes Model
The Black Scholes model is the most popular pricing model, and while I won’t go into the calculation in detail here, it is based on certain inputs.
Volatility is the most subjective (as future volatility cannot be known) and therefore, gives us the greatest chance to exploit our view of Vega compared to other traders.
One very simple way to keep an eye on the general market levels of volatility is to monitor the VIX Index.
Let’s explore a few ways to express our view on volatility using options.
The Short Straddle
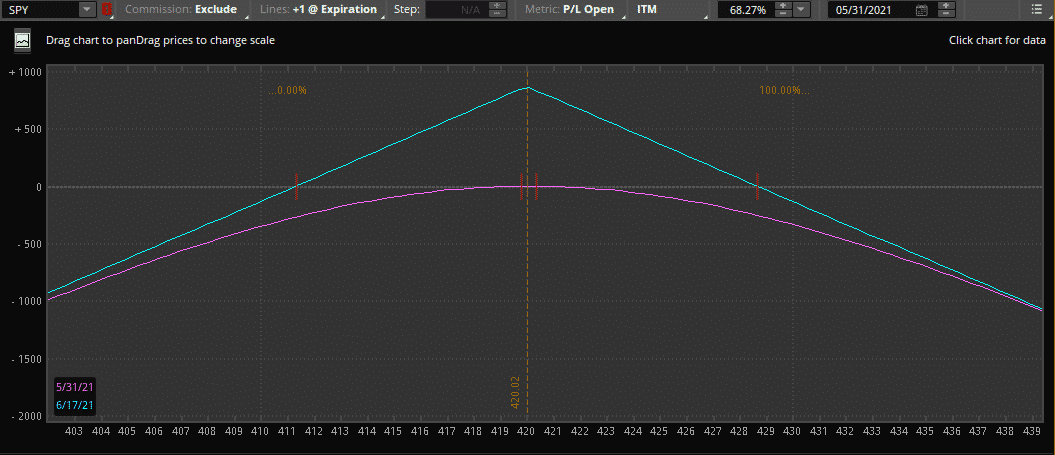
The short straddle allows an investor to express the view that volatility is overpriced.
A short straddle is created by selling at at-the-money put and call with the same expiration.
The corresponding structure will profit if the stock stays within a range equal to the credit received when the straddle is sold.
The Long Straddle
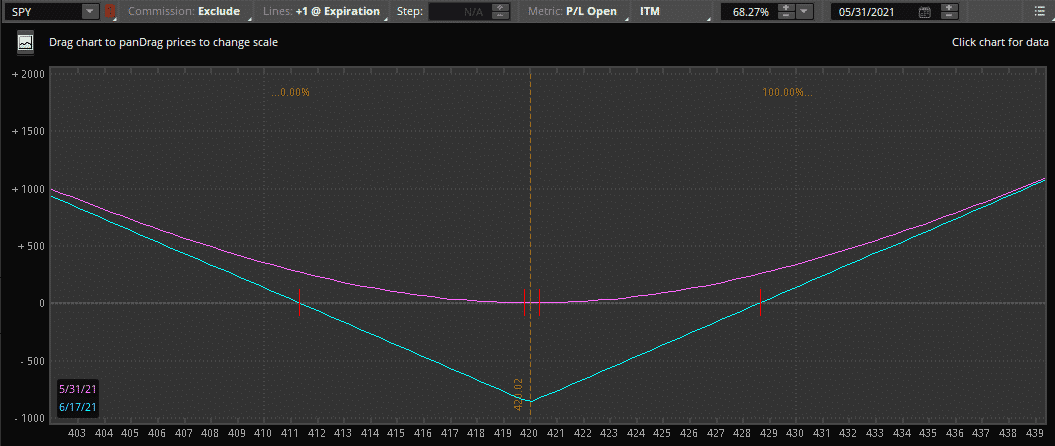
The long straddle allows an investor to express the view that volatility is under-priced.
A long straddle is simply the opposite of the short straddle and is created by buying an at-the-money put and call.
We can see that the corresponding structure will profit from large moves in either direction.
Conversely it will lose money if the stock does not move more than the market implies.
A note for simplicity. There are multiple options structures aside from straddles that can express a short or long volatility view.
Some of these are strangles and iron condors to name a few.
While these are different structures the view being expressed is virtually the same and volatility will affect them in very similar ways.
So How Does Volatility Affect These Positions?
Let’s go back to the short straddle.
Our purple line shows the current P&L.
Naturally when we first place the trade our P&L is at zero (yellow circle).
As time passes the purple line will move closer to the blue line.
Therefore, if the stock does not move at all from its current position of $420 at expiration, we would reach full profit (green circle).
If this occurs theta, or time decay was greater than gamma, or price movement.
Sounds like easy money! Except stocks do move. Alternatively imagine we have a large realized move.
The stock is now trading at $405. We can see (red circle) that we now have significant losses.
At the red circle gamma was greater than theta, or volatility was under-priced.
At the red circle the position loses a lot of its short volatility profile and becomes almost like long stock.
Therefore, if the investor does not have an opinion on the price of the stock (or delta), they should adjust or close the position.
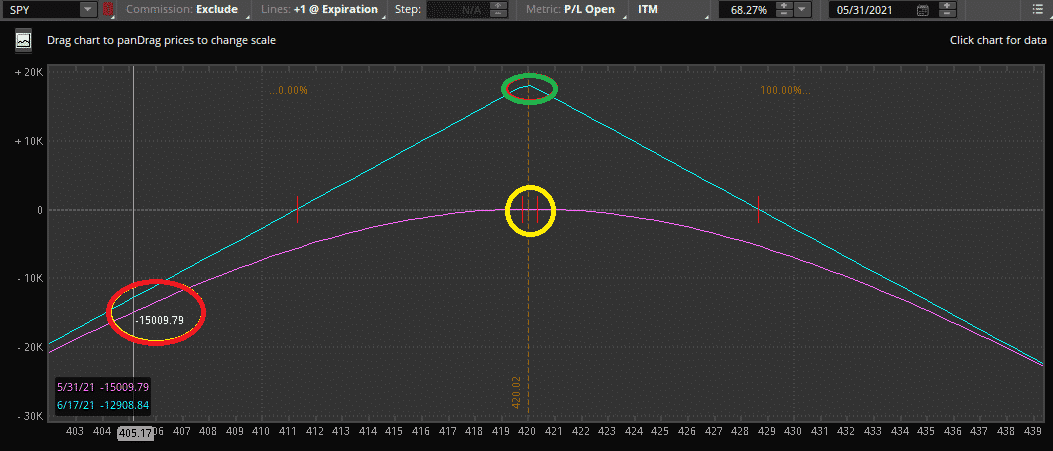
This is showing implied vs realized volatility in effect.
Now let us look at what happens if the level of implied volatility changes.
Imagine the same trade above but in this example after placing the trade with our opinion that volatility is overpriced the market agrees with us.
This causes volatility to go down 5%.
Volatility Down 5%
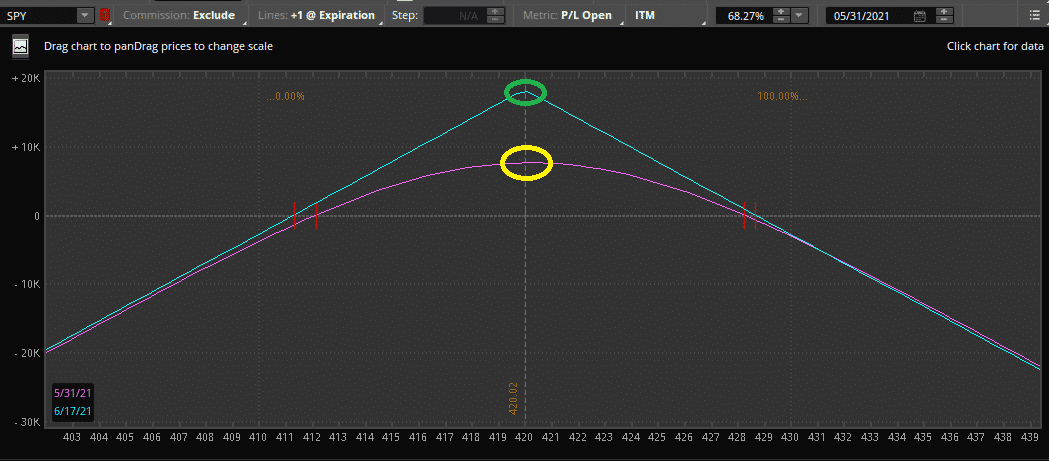
We can see that the purple line has converged upon the blue line.
We have also made $10,000. Despite this no time has passed.
What has happened is that future expectations for volatility are now lower therefore the future expected range of the stock is also lower.
We have taken advantage of the level of implied volatility, or vega.
At this point we could simply close out the trade or if we still believe volatility is overpriced stay in the trade till these two lines converge.
Trading VIX Futures or VXX
Another product that allows investors to trade volatility are VIX Futures or the VXX.
The VIX index is a volatility-based index that is calculated using a basket of S&P 500 options.
The VIX itself cannot be directly traded but investors can trade either VIX Futures or the VXX (an ETN that purchases VIX futures).
Expressing a view that market volatility is under-priced is as simple as selling a VIX future, and if market volatility is overpriced buying one.
The advantage of the trading VIX futures is that they are a pure play on volatility.
Over the life of the contract there is no directional view taken by the investor.
Hence no “delta hedging” is needed although positions will need to be managed for risk.
Many investors like trading options on the VIX Futures and VXX.
One important note.
As these products are already volatility products trading options on them is actually trading the volatility of volatility.
Trading Volatility With a Directional View
While these are a few ways to trade volatility with no view on direction we can always trade volatility with a directional view as well.
In fact, if you are trading options in any capacity, you are most likely taking a view on volatility.
For example, imagine we think stock A is under-priced and we also believe volatility is under-priced. In this example simply buying a call option expresses our view perfectly.
If you are able to express both a directional and volatility view correctly you will get rewarded big time for being correct.
Some investors are befuddled when their call option loses money as the price of the underlying increases slowly.
They are unaware that while they were right on direction, they were wrong on volatility.
If an investor does not understand how to trade volatility or have a view on it, simply trade the stock, not the options.
Concluding Remarks
Volatility is all around us. Options themselves are both price and volatility products.
Options allow an investor to trade exclusively volatility, without being necessarily concerned about the direction of the underlying.
Products such as the VIX futures also allow expression of a view on market volatility, simply and easily.
Trade safe!
Disclaimer: The information above is for educational purposes only and should not be treated as investment advice. The strategy presented would not be suitable for investors who are not familiar with exchange traded options. Any readers interested in this strategy should do their own research and seek advice from a licensed financial adviser.


With volatility looking like it may be spiking back up again, now is a great time to review this article.
Thanks for the explaination, really clear and concise. This has helped me greatly with the iron condor strategy.
Glad to hear it Bruce. Let me know if there is anything else I can help you with.
haha thanks, I appreciate the feedback. Let me know if there’s is anything you think the site is missing.
Great Commentary and clear as a BELL!
Thanks! I appreciate the feedback.
I typically trade AAPL weekly options via verticals/iron condors. This wk with earnings on 10/25 the IV is extremely high and AApl like GOOG can have a huge move. Do you prefer the stangle/straddle strategies in a wk like this?
Typically I stay away from the weeklies to be honest, unless I am using them for a short-term hedge
Clear n great illustration :). Need ur help on clarification. A long butterfly is a debit spread, why would it be suitable for decreased implied volatility compared to other debit spread? Thank you.
Is it due to the higher Vega on both the 2 ATM Call compared to both vegas of 1 ITM n 1 OTM? tq :).
This article was so good!!! It answered lot of questions that I had. Very clear and explained in simple English. Thanks for your help. I was looking to understand the effects of Vol and how to use it to my advantage. This really helped me. I do still would like to clarify one question. I see that Netflix Feb 2013 Put options have volatility at 72% or so while the Jan 75 Put option vol is around 56. I was thinking of doing a OTM Reverse Calendar spread ( I had read about it) However, my fear is that the Jan Option would expire on the 18th and the vol for Feb would still be the same or more. I can only trade spreads in my account (IRA). I can not leave that naked option till the vol drops after the earnings on 25th Jan. May be I will have to roll my long to March—but when the vol drops—-????
If I buy a 3month S&P ATM call option at the top of one of those vol spikes (I understand Vix is the implied vol on S&P), how do I know what takes precedence on my P/L : 1.) I will profit on my position from a rise in the underlying (S&P) or, 2.) I will lose on my position from a crash in volatility?
Hi Tonio, there are lots of variable at play, it depends on how far the stock moves and how far IV drops. As a general rule though, for an ATM long call, the rise in the underlying would have the biggest impact.
Remember: IV is the price of an option. You want to Buy puts and calls when IV is below normal, and Sell when IV goes up.
Buying an ATM call at the top of a volatility spike is like having waited for the Sale to end before you went shopping… In fact, you may even have paid HIGHER than “retail,” if the premium you paid was above the Black-Scholes “fair value.”
On the other hand, option pricing models are rules of thumb: stocks often go much higher or lower than what has happened in the past. But it’s a good place to start.
If you own a call — say AAPL C500 — and even though the stock price of is unchanged the market price for the option just went up from 20 bucks to 30 bucks, you just won on a pure IV play.
Good read. I appreciate the thoroughness.
-Daniel, Trading Vega
I don’t understand how a change in volatility affects the profitability of a Condor after you’ve placed the trade.
In the example above, the $2,020 credit you earned to initiate the deal is the maximum amount you will ever see, and you can lose it all — and much more — if stock price goes above or below your shorts. In your example, because you own 10 contracts with a $5 range, you have $5,000 of exposure: 1,000 shares at 5 bucks each. Your max out-of-pocket loss would be $5,000 minus your opening credit of $2,020, or $2,980.
You will never, ever, EVER have a profit higher than the 2020 you opened with or a loss worse than the 2980, which is as bad as it can possibly get.
However, the actual stock movement is completely non-correlated with IV, which is merely the price traders are paying at that moment in time. If you got your $2,020 credit and the IV goes up by a factor of 5 million, there is zero affect on your cash position. It just means that traders are currently paying 5 million times as much for the same Condor.
And even at those lofty IV levels, the value of your open position will range between 2020 and 2980 — 100% driven by the movement of the underlying stock. Your options remember are contracts to buy and sell stock at certain prices, and this protects you (on a condor or other credit spread trade).
It helps to understand that Implied Volatility is not a number that Wall Streeters come up with on a conference call or a white board. The option pricing formulas like Black Scholes are built to tell you what the fair value of an option is in the future, based on stock price, time-to-expire, dividends, interest and Historic (that is, “what has actually happened over the past year”) volatility. It tells you that the expected fair price should be say $2.
But if people are actually paying $3 for that option, you solve the equation backwards with V as the unknown: “Hey! Historic volatility is 20, but these people are paying as if it was 30!” (hence “Implied” Volatility)
If IV drops while you are holding the $2,020 credit, it gives you an opportunity to close the position early and keep SOME of the credit, but it will always be less than the $2,020 you took in. That’s because closing Credit position will always require a Debit transaction. You can’t make money on both the in and the out.
With a Condor (or Iron Condor which writes both Put and Call spreads on the same stock) your best case is for the stock to go flatline the moment you write your deal, and you take your sweetie out for a $2,020 dinner.
My understanding is that if volatility decreases, then the value of the Iron Condor drops more quickly than it would otherwise, allowing you to buy it back and lock in your profit. Buying back at 50% max profit has been shown to dramatically improve your probability of success.
Yes, that’s exactly right. Apologies Jim Caron, I must have missed replying to your initial comment.
How would you replicate/replace an equity portfolio that is $50k long IWM and $50k short SPY with options? I tried buying ATM SPY puts where my notional was $50k and buying IWM calls where my notional was $50k, but I’ve found it essentially becomes a long straddle/volatility. please help
You would be better off doing that with futures.
In order to replicate a long position in a stock using options, you would sell and ATM put and buy and ATM call.
A synthetic short position would be sell 1 ATM call,buy 1 ATM put.
Just found your site on facebook. Fantastic site, I love how you break down some difficult topic and communicate them in a very easy to understand fashion. Keep up the good work
Thanks Ivan! You’re actually the second person to say that this week, so I must be doing something right. 🙂
Thanks for your comment.
Of course we know you put in a deliberate mistake too see if we are paying attention. There is no greek symbol called Vega. If we were using a Greek symbol it would be Kappa.
Great analysis. How do you play a possible expansion in VOL? a Ratio Backspread?
Hi John, I like double diagonals. See below:
https://optionstradingiq.com/the-ultimate-guide-to-double-diagonal-spreads/
hi, Gavin
There are some expert taught traders to ignore the greek of option such as IV and HV. Only one reason for this, all the pricing of option is purely based on the stock price movement or underlying security. If the option price is lousy or bad, we always can exercise our stock option and convert to stocks that we can owned or perhaps sell them off on the same day.
What is your comments or views on exercise your option by ignoring the option greek?
Only with exception for illiquid stock where traders may hard to find buyers to sell their stocks or options.
I also noted and observed that we are not necessary to check the VIX to trade option and furthermore some stocks have their own unique characters and each stock option having different option chain with different IV. As you know options trading have 7 or 8 exchanges in the US and they are different from the stock exchanges. They are many different market participants in the option and stock markets with different objectives and their strategies.
I prefer to check and like to trade on stocks/ option with high volume/ open interest plus option volume but the stock higher HV than option IV.
I also observed that a lot of blue chip, small cap, mid-cap stocks owned by big institutions can rotate their percentage holding and controlling the stock price movement.
If the institutions or Dark Pools (as they have alternative trading platform without going to the normal stocks exchanges) holds a stock ownership about 90% to 99.5% then the stock price does not move much such as MNST, TRIP, AES, THC, DNR, Z, VRTX, GM, ITC, COG, RESI, EXAS, MU, MON, BIIB, etc.
However, HFT activity also may cause the drastic price movement up or down if the HFT found out that the institutions quietly by or sell off their stocks especially the first hour of the trading.
Example: for credit spread we want low IV and HV and slow stock price movement. If we long option, we want low IV in hope of sell the option with high IV later on especially prior to earning announcement.
Or perhaps we use debit spread if we are long or short an option spread instead of directional trade in a volatile environment.
Therefore, it is very difficult to generalise things such as stock or option trading when come to trading option strategy or just trading stocks because some stocks have different beta values in their own reactions to the broader market indexes and responses to the news or any surprise events.
To Lawrence —
You state: “Example: for credit spread we want low IV and HV and slow stock price movement.”
I thought that, generally, one wants a higher IV environment when deploying credit spread trades…and the converse for debit spreads…
Maybe I’m confused?…
so ideally we want the volatility to contract / be ‘minimum’ when buying call debit spreads?
what about the case of market index etf’s like SPY, DIA or Qs? when we are in a debit call spread, bull call spread, and volatility expands / increases, the price of underlying will also drop, as volatility is contrarian, debit call spread’s value will decrease. but if volatility contracts or gets smaller, the price of underlying increases as does value of debit call spread. please explain.
Yes, you vol to be low when buying spreads, no matter if your trading a stock or an ETF. Remember volatility is only one piece of the puzzle. Yes if price drops, vol will rise, but you may be losing money on the spread as the price movement will likely outweigh the rise in vol. If price stays the same and vol rises, you make money.
If you buy a bear put debit spread, you make money from price and vol when the market drops.
Excellent depth .
Hi 2 questiions,
1. in the article tou mention Long vega benefits from high volatility is this because higher volatility im0lies higher prices in the underlying?
2. Also you mentioned in the volatility example , current levels of AAPL were 35% closer to the 52week high, hence indicating a fall in IV…could you explain this a little more, and would that mean if the IV level of 35% Was close to the 52week low, it would mean increase in IV ?
1. Yes. I you are long Vega and implied volatility rises, you will benefit from the higher option prices.
2. Typically you want to buy volatility when it is low and sell it when it’s high (just like a stock, buy low, sell high). So in this example, with volatility being close to a 52 week high, you would want to sell volatility, in the expectation that it will come down again. Volatility is different to stocks in that it is mean reverting, so if it’s high, it will generally come down and if it’s low, it will generally rise at some point.
Hi IQ,
Thank you for so many great articles on volatility. You explain things very well.
What P&L simulation tool are you using to price options and spreads above in this article? Is it available for free? It looks very nice and useful. Where can we download it? Keep up the great work on explaining how options volatility works.
This is from a broker called Options House