


Contents
- What Is The Interactive Brokers Risk Navigator?
- Using the Risk Navigator
- Creating “What-if” Portfolios
- Saving What-if Portfolios
- Exporting Portfolios to Excel
- Creating Multiple What-if Portfolio
- Creating Custom Scenarios
- Adding and Removing Columns
- Limitations
- Conclusion
The Interactive Brokers Risk Navigator is a fantastic tool that I use every day in my trading. However, it’s not very intuitive and new account holders often have no idea what it is or how to use it. I have to confess, it took me a while to figure it out. It’s perhaps not as good as some of the functionality that Thinkorswim has, but it’s still pretty good.
What Is The Interactive Brokers Risk Navigator?
The Risk Navigator is a platform on which you can analyze all your option trades. It provides you with data on your greeks and profit graph and also allows you to design trades and play around with different adjustment scenarios. You can filter your portfolio to only look at a specific underlying stock or only positions with a certain expiry date.
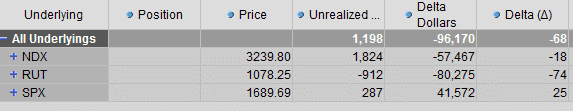
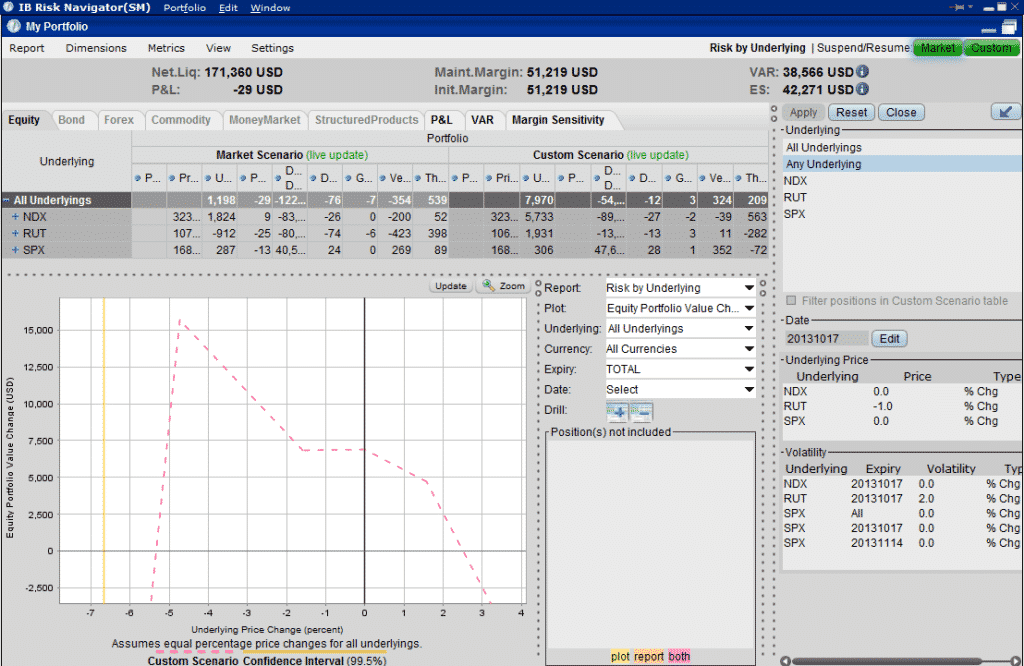
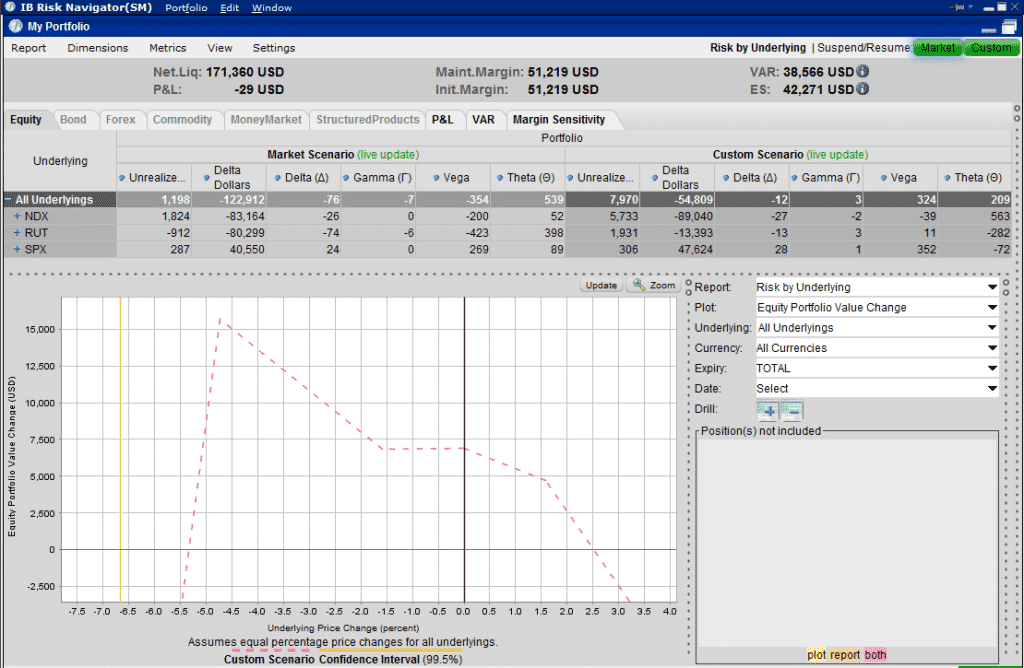
Here is what the Risk Navigator looks like. Your default view might be slightly different, but generally you are going to see your portfolio split out by underlying instrument.
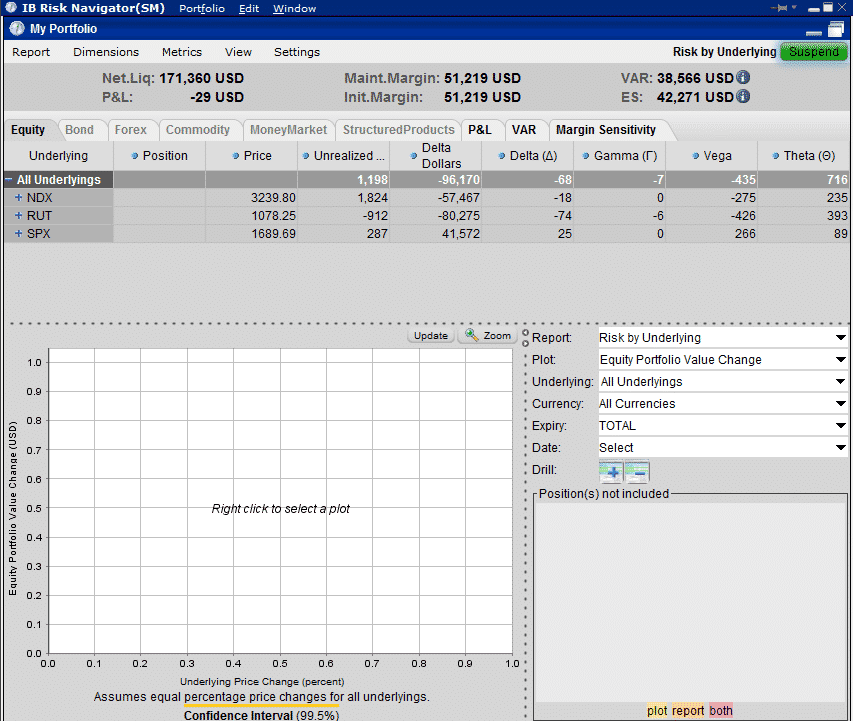
For this default view, I have the column headings, Position, Price, Unrealized P&L, P&L for the Day, Delta Dollars, Delta, Gamma, Vega and Theta. Those should all be fairly obvious to you, except perhaps Delta Dollars. This is the dollar exposure that I have based on my Delta. For example, if I had a Delta of 10 on a $100 stock, my Delta Dollar exposure would be $1,000. In this case, I have a Delta of -74 for RUT which results in a Delta Dollar exposure of -$80,275.
Using the Risk Navigator
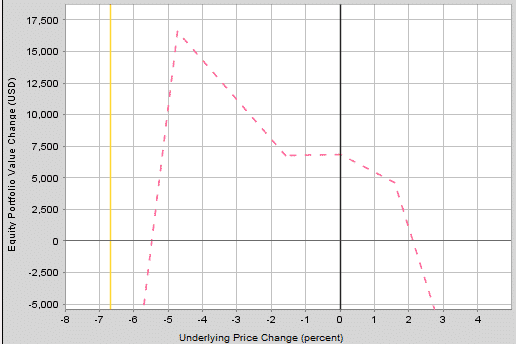
The first thing I do whenever I open the Risk Navigator, is to update the Date field at the bottom right to be the expiry date that I am currently trading. That could be the weekly or monthly expiry. Generally I’m trading monthly contracts, so in this case, I set Date to October 17th. This will update the profit graph to show me my profit graph at expiry. Here is an example:
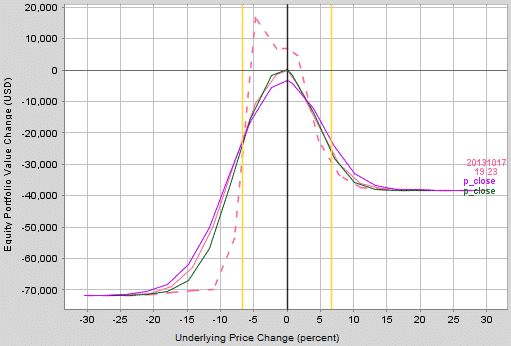
Some of you may see more than one line here, those being “base, most recent”, “vol up, prev close” and “vol down, prev close”. Generally I’m only interested in the expiry graph, so I just right click somewhere on the graph and deselect those choices.
The next thing I like to do is zoom in on the main area of my profit graph. To do that, I simply left click somewhere on the graph and drag the box over the area I want to zoom in on. To remove the zoom, hit the zoom button twice to go back to the standard view.
I use Risk Navigator a lot when looking at new trade ideas and also different adjustments on open trades. This is where Risk Navigator really excels.
When looking at “My Portfolio”, you cannot edit any of the positions or add any new positions, so you can’t analyze different adjustment scenarios here. To do that you need to create a new What-if Portfolio.
Creating “What-if” Portfolios
To create a new What-if portfolio, go to the top heading where it says “Portfolio” and choose New.
You will be given an option to bring in your portfolio as the default. This just means that any time you open a new What-if portfolio, it will automatically populate with every position you currently have. This can be a good and bad thing. Sometimes you want to bring in your portfolio and then work on adjustment strategies. Other times you want to start with a blank canvas and look at new trade ideas. Think about which you are more likely to be doing before you choose your default option. I chose to automatically populate from my portfolio, and I don’t know how to turn that default off…
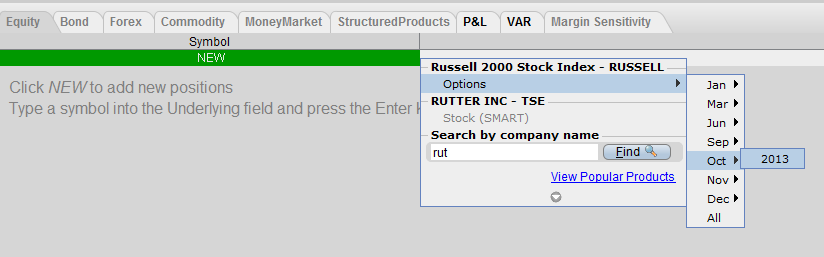
Let’s say you’re starting from scratch and want to look at a new trade idea. The first thing you need to do is bring in your option chains. To do that, under Symbol where it says NEW, enter RUT and hit enter. Then choose your expiry month and bring in your option chains.
Once you have your option chains loaded, you can start building your position, just add the position size in the positions column and use a negative symbol for short options.
The other method is to import your current portfolio and then work on adjustments that way. To bring in your portfolio, go to Edit in the top menu, then Add from… and select My Portfolio. From there you can remove positions that you don’t want by left clicking the mouse to highlight each one, then press delete. Then you can add in any new option chains and work on adjustment strategies.
Saving What-if Portfolios
Let’s say you’ve created a What-if portfolio in order to test out a new strategy. You want to monitor the position each day over the course of the month, but it would be cumbersome to create a new What-if portfolio each day. Thankfully, you can save your What-if portfolios and open them up each day. To save, just go to Portfolio > Save As, give your portfolio a name and choose a file location.
The next day, open up Risk Navigator, got to Portfolio > Open, find your file and open it. This is great if you are paper trading a new strategy and saves a lot of time.
Exporting Portfolios to Excel
Sometimes you might like to export your portfolio into excel, for example if you want to keep a record of how the portfolio looked each day. To do this, go to Report > Export > Export to Excel. Choose your file name and location and you’re done.
Creating Multiple What-if Portfolio
Assume you have a position that needs to be adjusted and you want to evaluate a few different adjustment ideas. In this case, I would create a new What-if portfolio, import My Portfolio and remove any non-relevant positions. Then I would add in any new options chains and work on my adjustment strategy.
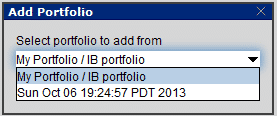
Occasionally I want to make a slight tweak to my adjustment strategy, but I don’t want to keep changing my What-if portfolio back and forth. In this case I can create a second What-if Portfolio, start with a blank canvas, but this time instead of importing from My Portfolio, I import from the What-if portfolio I was working on. To do this, go to Edit > Add from and then click the drop down box to choose the relevant What-if Portfolio. Then I make the slight tweaks and compare the two.
Creating Custom Scenarios
Risk Navigator gives you the ability to create custom scenarios with your portfolios. For example, you could take your current position and look at a scenario where 4 days have past, the stock has dropped 2% and implied volatility has increased by 5%. Risk Navigator will give you a snapshot of how your portfolio will look, including the P&L and the new greek values. I use this only very occasionally, because I’m not convinced how accurate it is. There are so many variables at play.
However, it can give you a good glimpse at what could happen and maybe help you avoid disaster. If you’re worried about a new strategy and notice that a 5% volatility increase will result in a loss of $5,000, maybe you want to rethink your strategy.
I find when using the custom scenario, it’s best to look at one underlying at a time and not change too many variables at once. For example, you might change the days to expiry and the implied volatility but leave price the same.
Adding and Removing Columns
Sometimes the Risk Navigator can get a little “busy”, particularly when you are working with a custom scenario. For this reason, you may want to remove some of the column headings. You may only want to look at the greeks, so removing unrealized P&L and P&L for the day would make sense.
To remove column headings go to Metrics, then remove or add the headings from Value Columns, Positions Risk and Contract Risk.
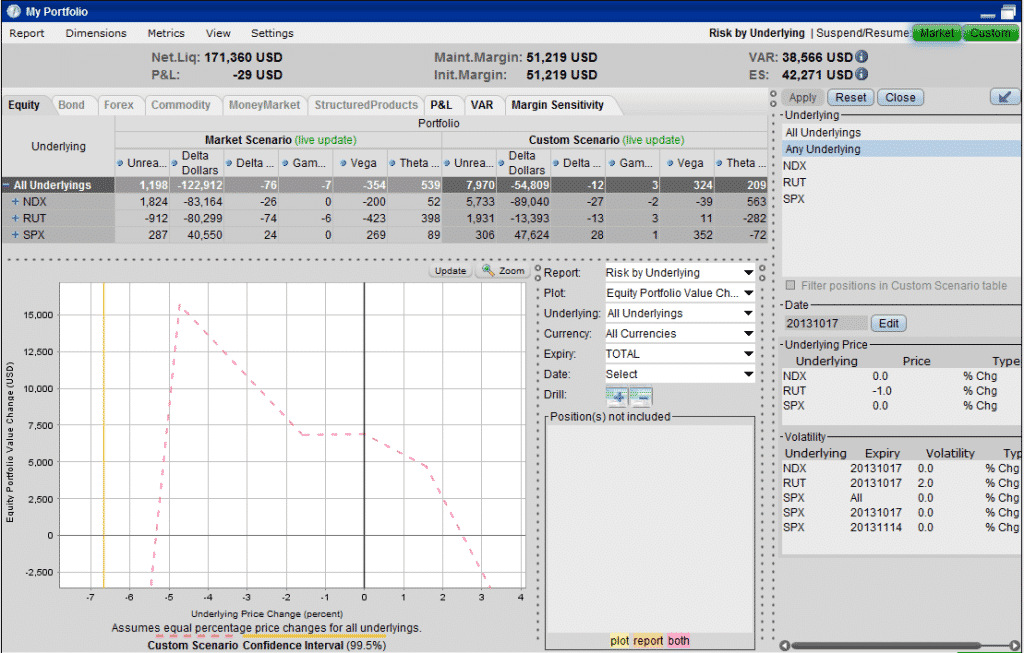
You can see below that having too many headings when running a custom scenario makes the screen hard to read.
To fix this, remove some of the headings. Here I have removed Postion, Price and P&L for the Day.
You can also hide the custom scenario inputs on the right to give you some more room. Do this by click the arrow pointing to the right on the custom scenario box.
Limitations
There are two main limitation with Risk Navigator. One is the custom scenario function, as I mentioned, I’m not sure how accurate this is. The other is when looking at interim dates on the P&L graph. Risk Navigator does not handle this very well and the interim date line is basically meaningless if you ask me. TOS may have better functionality for this, otherwise software like OptionVue and Option Net Explorer are probably the best
Conclusion
Interactive Brokers Risk Navigator is a great application and if you have an IB account, but are not using it, you really need to start. Creating What-if portfolios and playing around with different adjustment ideas is easy once you know how. You can also just keep Risk Navigator open during the day and use it to monitor your risk levels.
All of the above topics are covered in this video, if you like the video, please give it a thumbs up! Thanks!


TOS does it better, but at a higher price.
Yes, TOS has some great analytics. Option Vue and Option Net Explorer are also very good as third party software, but they are expensive.
Hi, very good info you have as I am new to IB. My question is about thet theta and gamma columns in risk navigator. I don’t find the exact definition of these and what they actually show anywhere. I need gamma in units and theta in pure cash. How do I do that?
Thx,
Jim
Hi Jim.
That should be the default setting. Let me know if you are still having issues.
Great Video Gavin! Thank you
wonderful explanation feels great to have this, now I can perform good at avapartner.com thanks.
Thanks for this Gavin. Another step forward in learning about this beast. I have never actually used the TOS software as I am in the UK and cannot get an account, but I have seen it used and it looks very good and integrates with the broker platform very well. One thing I don’t understand about Risk Navigator is that it tells me what my unrealized profit is but (on my one) the underlying price does not move in real time. Is this really the case or is it just me? Also, sometimes the unrealized profit and the graph are at odds with each other. The graph says the max profit is $100 and the unrealized profit is $150. Do you find this or is it just me?!!
Hi Jeff,
As far as I’m aware, Risk Navigator does not sure the unrealized profit at all.
The price should update in real time though. Maybe you need to hit the Update button which I do periodically.
Great video, thanks for this info !