
Implied volatility is the markets estimate of how much a security will move over a specific period on an annualized basis. Implied volatility changes with market sentiment and is considered a tradable input that is used to generate prices of options. Implied volatility will be different for each option, including options that have the same security and identical expiration dates. The difference between the implied volatility of an option with the same security and expiration date but different strike price makes up the implied volatility surface. When two options with different strike prices on the same security with the same expiration date have different levels of implied volatility the difference is referred to as the skew.
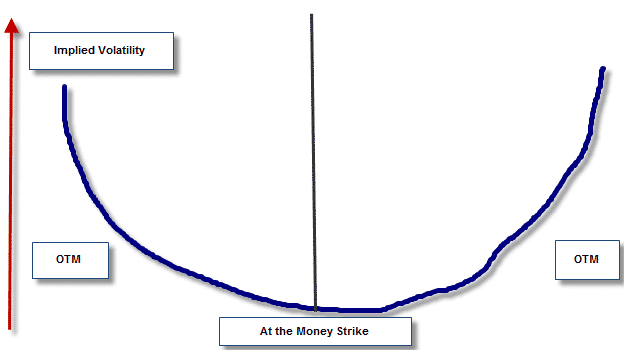
The implied volatility smile refers to the skew that is associated with both “out of the money” calls and “out of the money” puts. When the structure of implied volatility is graphed, the “out of the money” implied volatility levels are higher than the “at the money” implied volatility levels, so the graph of the strikes appear to have a smile. The higher levels of implied volatility can occur because of supply and demand as well as the lack of liquidity for out of the money strike prices. This is why the Jade Lizard is an attractive strategy.
The implied volatility smile is due to a skew on out of the money options. A skew to a specific strike price can be generated for a number of reasons, but generally it occurs because of higher demand. Theoretically, the strike prices for an option with the same expiration date should have the same implied volatility regardless of which strike price is chosen. However the reality is that each strike price can have a different implied volatility which is known as the volatility skew.

In the example above the picture of the smile reflects higher implied volatility for “out of the money” strikes.
A volatility smile does not mean that the prices of the options that are “out of the money” are greater than the price of the “at the money” options, it only means that the implied volatility that is used to price options of “out of the money” strikes is greater than the implied volatility of “at the money” strikes.
If the “at the money” implied volatility is higher than lower out of the money strikes but is lower for higher strikes the surface structure for implied volatility is said to have a smirk. If the implied volatility is lower for “out of the money” strikes than “at the money” strikes the surface is said to have a frown.
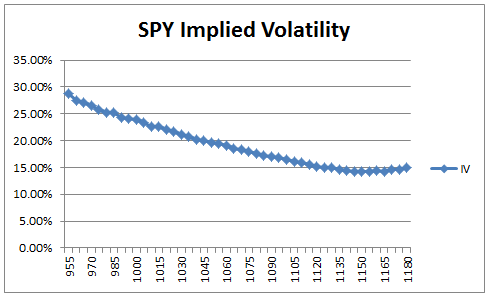
Below you will see a live example of the current 1 month SPY options and their implied volatility smile.

I hope you enjoyed this post on the implied volatility smile. If you haven’t done so already, make sure you check out my free 10 part Butterfly Course by clicking the image below.


hi, Gavin
Interesting article. What I understand is that when IV is high due to some events, and higher demand for the stock option, the option price shall be higher.
Is that mean when the OTM option has higher IV it also has a higher price too? As you mentioned that “volatility smile pattern” in the graph has different meaning altogether. As you mentioned it does not mean OTM option with higher IV has higher price than the ATM option with a lower IV?
I am a bit confused with the explanation you gave in this article.
Appreciate if you can clarify the subject on this topic.
Thanks.
Hi Lawrence,
No, as you go further OTM, the option price will always be less. It’s just that IV might be higher, so the OTM are more expensive on a relative basis.
G.