


Contents
-
-
-
-
- What Is Options Income Trading?
- Why Focus On Income Vs. Directional Trading?
- Risk Vs. Reward In Options Income Strategies
- Covered Calls – The Foundation
- Cash-Secured Puts
- Credit Spreads For Monthly Income
- The Monthly Income Framework
- Advanced Income Strategies
- Risk Management Master Plan
- Real Examples And Case Studies
- Bonus Resources
-
-
-
What Is Options Income Trading?
Options income trading is a strategy focused on generating regular income by primarily selling options rather than buying them.
Income is generated by taking advantage of option time decay as measured by theta.
The edge in selling options comes from the concept of Volatility Risk Premium (VRP).
It just means that there is a systematic overpricing of implied volatility compared to realized volatility that can be harnessed by selling the premium of options.
Why Focus On Income Vs. Directional Trading?
Forecasting the direction of an asset can be difficult.
When one picks correctly, one wins big.
When the direction is wrong, the loss can be just as big.
An example of directional trading is buying call options when one expects the price to rise and buying put options when one expects the price to drop.
Income strategies are less dependent on correct directional prediction and benefit from other factors related to selling premium.
Income strategies can be slightly directional, but a premium selling component always accompanies them.
This guide will look at these in sections 1, 2, and 3.
Income strategies can also be non-directional and market-neutral, as we will see in section 5.
These work well when the market moves sideways or is range-bound.
Risk Vs. Reward In Options Income Strategies
Income strategies are preferred over directional strategies because they have a higher probability of profit and can give more consistent returns over time.
The drawback is that the profit is small in relation to the risk in a large price move.
When the risk is four times as large as the potential profit, we say that the risk-to-reward ratio is 4-to-1.
The typical risk-to-reward ratio for options income strategies can be anywhere from 4-to-1 to as much as 10-to-1.
There is no way around this. It is a natural law of the marketplace that if you have a high probability of profit, you will have a less favorable risk-to-reward.
Directional strategies, on the other hand, have a more favorable risk-to-reward ratio.
But they have a lower probability of profit.
Covered Calls – The Foundation
The covered call is a good beginning to start into options as it involves owning stock, which many investors are already familiar with.
What is a Covered Call?
A call option is a financial contract that gives the owner the right (but not the obligation) to buy a stock at a specific price (known as the strike price) within a set time period before the expiration date of the option.
In an option-covered call strategy, we are not buying a call option.
We are selling a call option.
When we sell a call option contract, it is as if we are “writing” an option contract to the option owner to whom we sold the option.
That contract states that we are obligated to sell a stock (to the call option owner) at the strike price whenever the option owner demands it.
While this is technically true, the option owner will not demand the stock unless the stock price is above the strike price and it is at option expiration.
There are a few corner cases where it is reasonable for the option owner to demand the stock even if its price is below the strike price but very close to option expiration.
Nevertheless, when we sell a call option, we have to be prepared to sell 100 shares of that stock at the strike price.
One option contract specifies 100 shares of stock.
Therefore, when we sell a call option, we need to buy 100 shares of the underlying stock to have on hand.
By doing this, we say our call option is “covered.”
This strategy is known as “selling a covered call.”
It is also known as “buy-write” because we buy stock and write a call contract.
Step-by-step Guide To Placing Your First Covered Call
Here is an example of a covered call. Amazon (AMZN) is trading at $202.61 on November 15, 2024.
The investor buys 100 shares and sells the $210 call option expiring on December 13.
The $210 call option means that the contract specifies a strike price of $210.
This contract is only valid before expiration, which will occur in 28 days at market close on December 13, 2024.
Selling this contract immediately credits the investor $332.50.
The market price of the call option is $3.32, quoted as a per-share price.
Since one contract specifies 100 shares, the net credit for selling one contract is $332.50.
The payoff graph shows how much the investor would profit or lose depending on the price of AMZN at the contract’s expiration.
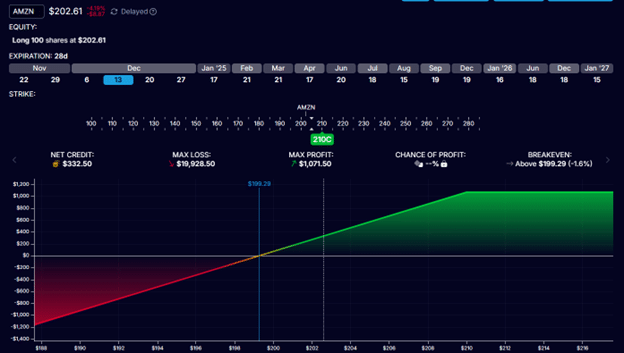
The stock’s price is shown on the horizontal x-axis.
The white vertical line shows its current price.
The vertical y-axis shows the profit or loss.
It shows that if AMZN stays at the current expiration price, the trade profit would be $332.50.
The investor made no money on the stock but received $332.50 from the option sale.
If AMZN was at any price below $210 at expiration, the call option would expire worthless, and the investor would keep the initial credit of $332.50.
This extra credit enables the investor to profit even if the stock drops a little—to as much as $199.20.
This is the break-even price, indicated by the blue vertical line in the graph.
Numerically, this number is derived from $202.61 – $3.32.
Common Mistakes to Avoid
1. Selling too close to the current price caps the potential profit and does not allow for stock appreciation.
2. Strikes with inadequate premiums are chosen because they are too far from the current price.
3. Do not consider upcoming events. Earnings announcements can trigger a large move, and dividends can cause the early assignment of the call option.
4. Not having an exit plan. This is an undefined risk strategy. As the price of the stock drops, the larger the loss can be. In our example, if you let the price of the stock drop to zero, the loss will be $19,928.50. The investor needs to decide at what point they will cut the trade.
Cash-Secured Puts
Understanding Cash-Secured Puts
A put contract is an option that gives the holder the right (but not the obligation) to sell a stock at the strike price before the option expires.
Because we are selling premium for income, we will sell the put contract instead of buying it.
This binds us to the obligation of buying the stock at the strike price when the option owner “puts the stock” to us, known as assignment.
Typically, this will only happen when the stock price is below the strike price at expiration.
However, there are exception cases for an early assignment.
Therefore, we need to keep enough cash in reserve if we are obligated to buy the stock.
By doing so, we say we are selling “cash-secured put options.”
Choosing the Right Strike Price
The strike price of selling a cash-secured put is typically below the stock’s current price.
This is known as an “out-of-the-money” put option.
The investor seller of this put option hopes that the stock remains out-of-the-money at expiration so that the put option becomes worthless and the investor keeps the initial credit received from the put option sale.
As in the case of the covered call, there is a balance as to what strike price to sell.
If you sell too close to the stock’s current price, you increase the chance of assignment.
If you sell too far away from the stock price, your premium is too low.
Some investors sell at a price they don’t think the stock will go below (based on technical analysis, resistance levels, etc.).
Other investors like to sell at a certain delta away.
The 50-delta is close to where the stock is.
The 15-delta is about a one-standard-deviation move from where the stock is.
The 5-delta is very far away from where the stock price is estimated to have only a 5% chance of being at the strike price at expiration.
Other investors like to sell an option with a premium of a certain percentage return of the stock price.
Here is an example of selling the $275 put option on Tesla (TSLA), which expires on December 13.
On November 15, 2024, it was trading at $320.72.
The credit received is $427.50.
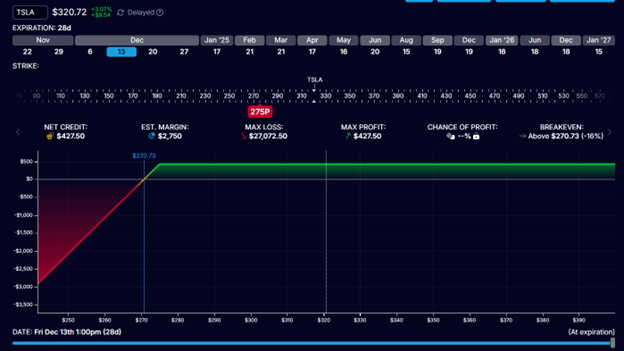
Here, the strike of $275 was chosen to be at the 15-delta.
There is a 15% theoretical chance that TSLA will be at $275 at expiration.
With 100 shares being $32,072, we can say that this is the capital being allocated.
The premium of $427 represents about 1.3% of the capital invested.
If the option expires worthless and we keep the premium at expiration 28 days from now, then we can say that the trade has the potential to return 1.3% in a month.
Managing Assignments
If the stock’s price is below the strike price at expiration, the investor is obligated to buy it at the strike price.
The investor may choose to hold the stock and/or use it for the covered call strategy.
Or the investor may sell the shares outright and move on.
If the latter is the intention, the investor may not even want to hold the stock temporarily.
The investor would close the short put option by buying it back right before expiration.
By exiting the obligation in this way, the investor does not have to buy the stock.
Either way, the financial profit or loss would be about the same (assuming that the stock does not move much near expiration).
Some investors may have tactics to roll the short put option out in time to avoid assignment.
Credit Spreads For Monthly Income
Selling calls and puts are undefined risk strategies.
Next, we come to learn about credit spreads, which are defined risk strategies.
Types of Credit Spreads
There are two basic types of credit spreads: the bull put credit spread and the bear call credit spread.
They are typically sold out of the money.
The put spread is sold at strikes below the current price of the underlying, while the call spread is sold at strikes above the current price.
When they are sold out-of-the-money like this, the trade receives a credit at the start of the trade.
That is why we say that we are “selling” the spread.
The put credit spread is bullish, meaning that it profits when the stock price goes up – assuming that the put credit spread is sold out of the money.
The call credit spread is bearish, meaning that it profits when the stock price goes down – the same assumption.
Yes, they are a bit directional.
However, they have a premium selling component, which makes them an income strategy.
Put Credit Spreads
In a put credit spread, we primarily sell a put option called the “short put.”
This option is hedged by buying another put option at a lower strike, which is the “long put.”
For example, the following is a bull put spread on SPY, the ETF tracking the S&P 500.
Date: November 15, 2024
Price: SPY @ $585.78
Sell to open one contract December 31 SPY $555 put @ $3.34
Buy to open one contract December 31 SPY $550 put @ $2.87
Net credit: $47.50
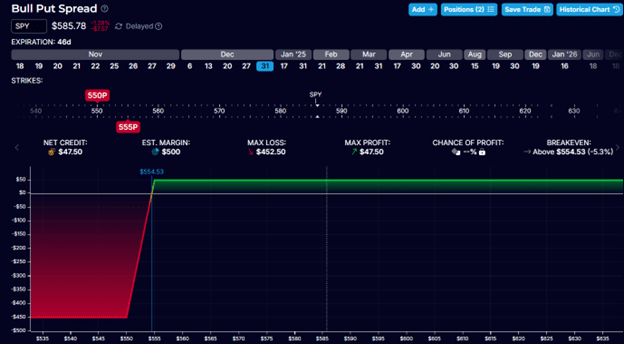
From the graph, we see that if the price of SPY does not move at all, then we still gain $47.50 at expiration.
The income strategy does not require the stock to move in order to profit.
Of course, if the stock moves up, then the spread will profit faster.
It is not necessary to hold the spread to expiration.
You can close it at any time by:
Buy to close one contract December 31 SPY $555 put @ $3.34
Sell to close one contract December 31 SPY $550 put @ $2.87
Call Credit Spreads
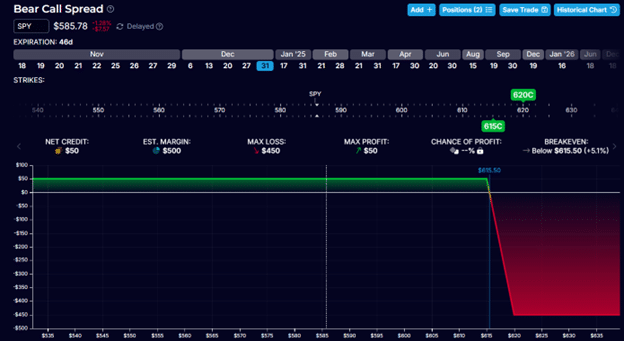
Here is a bear call spread on the same underlying:
Date: November 15, 2024
Price: SPY @ $585.78
Sell to open one contract December 31 SPY $615 call @ $1.31
Buy to open one contract December 31 SPY $620 call @ $0.81
Net credit: $50
Its expiration graph looks like this:
Its T+0 curve looks like this…
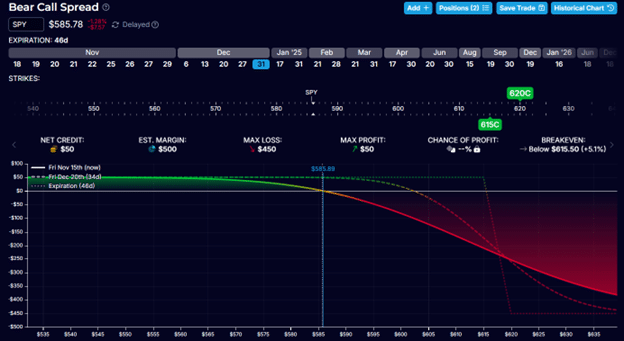
This T+0 curve shows the P&L (profit and loss) at the current time as opposed to at expiration.
As you can see, it profits as the price of SPY moves down.
Position Sizing Guidelines
Although not financial advice, max loss on any one spread should be no more than 1% to 5% of portfolio size.
This depends on the size of the portfolio, the type of account, investment style, risk tolerance, and other factors.
Adjustment Strategies
Many investors exit credit spreads at 50% to 80% of max profit.
For example, in the bear call spread, an investor might make a profit of $25 (half of the initial $50 credit received).
The max risk at $450 represents a 5% return.
While this may seem small compared to directional trades, this credit spread has a high probability of profit, about 80%.
Many investors will cut the trade when the losses exceed two times the credit received.
For example, if the loss is greater than $100, they will exit the bear call spread for a loss (to prevent greater loss).
When to adjust and how to adjust will come with practice.
Some investors may adjust by watching the delta of the short strike.
For example, they may consider adjusting if the short call was at 15-delta when it started and then it rose to 22-delta.
Typical adjustment involves rolling the spread further away.
The Monthly Income Framework
Portfolio Allocation Guidelines
The “two-percent rule” says that the maximum loss on any trade should not exceed 2% of portfolio size.
This percentage can be adjusted by the individual investor and typically could range from 1% to 5% of portfolio size.
Because options naturally have leverage characteristics, it is typical for an investor to allocate only 20-30% of their portfolio to options.
Position sizing calculator
Risk Management Rules
Monitor buying power, which can increase or decrease as volatility changes the risk of undefined-risk positions.
Monitor delta dollars at the trade level and at the portfolio level, as this tells you how much exposure you have in the market and whether you are too directional one way or the other.
The key is consistency and avoiding oversizing, which is the most common way traders blow up their accounts.
Monthly Income Goal-Setting
It is good to set monthly and annual goals but be realistic.
Typical monthly goals might be a 1% to 3% return.
Annual goals of 12% to 24% are within reason.
Remember that in order to achieve higher returns, you have to be exposed to higher risks.
Advanced Income Strategies
Iron Condors
If you combine the bull put credit spread example and the bear call spread example together, you get an iron condor:
Date: November 15, 2024
Price: SPY @ $585.78
Sell to open one contract December 31 SPY $555 put @ $3.34
Buy to open one contract December 31 SPY $550 put @ $2.87
Sell to open one contract December 31 SPY $615 call @ $1.31
Buy to open one contract December 31 SPY $620 call @ $0.81
Net credit: $97.50
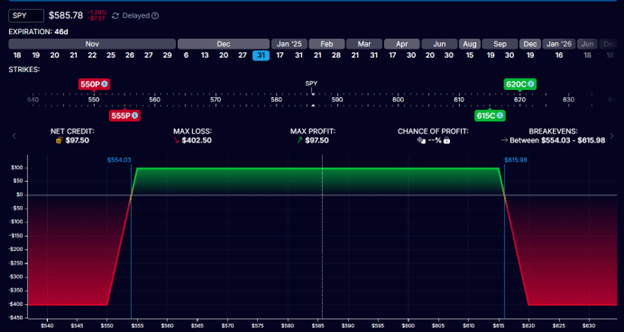
Its risk-to-reward ratio is 4-to-1, an improvement over the individual spreads’ ratio of around 10-to-1.
By market laws, this means that this condor has a lower probability of profit than the individual spreads alone. It has a 64% probability of success.
This is because the individual spread has only one direction in which it can lose, while the condor has two directions in which it can lose.
The condor requires the price of the stock to stay range-bound in order to win.
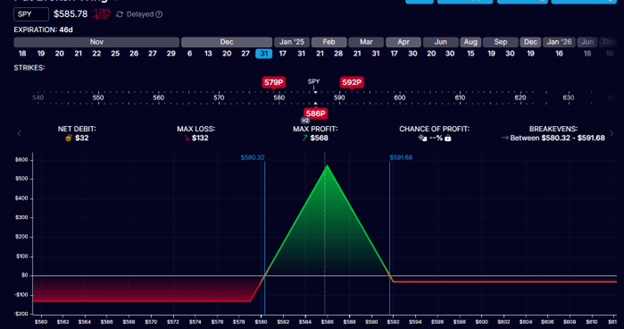
Butterfly
Whereas the condor sells premium at strikes far from the current price, the butterfly sells premium at the money with the two short legs near the underlying asset’s current price.
Date: November 15, 2024
Price: SPY @ $585.78
Buy one December 31 SPY 592 put @ $12.28
Sell two December 31 SPY 586 put @ $9.72
Buy one December 31 SPY 579 put @ $7.48
Net Debit: $32
Calendar Spreads
The calendar option spread is also known as the time spread because it involves options with two different expirations.
Here is an example of a calendar in which the short put expires in 27 days, and the long put expires one week after that.
Date: November 15, 2024
Price: SPX @ 5870
Sell one December 13 SPX 5870 put @ $66.65
Buy one December 20 SPX 5870 put @ $75.90
Debit: -$925
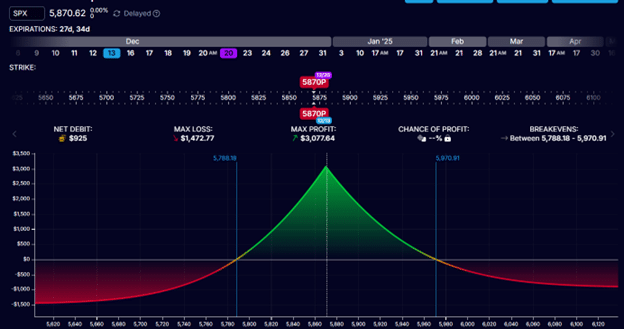
The underlying asset used in this example is the S&P 500 index with the symbol SPX.
Unlike the ETF SPY, which can be bought and sold like a stock, the SPX index is cash-settled.
You can not buy shares of SPX.
Therefore, you can not be assigned shares of SPX at expiration.
Cash going into and out of your account would reconcile any gain or loss.
The two options can be put options or call options.
But they both need to have the same strike prices for it to be a calendar spread.
Diagonal Spreads
If the two options do not have the same strikes, it is a diagonal spread.
The example below is a diagonal spread using call options on RUT, the Russell 2000 index.
The RUT index is about 10 times as large as its equivalent ETF with the symbol IWM.
Date: November 15, 2024
Price: RUT @ 2306
Sell one December 13 RUT call @ $45.75
Buy one December 20 RUT call @ $47.50
Debit: -$175
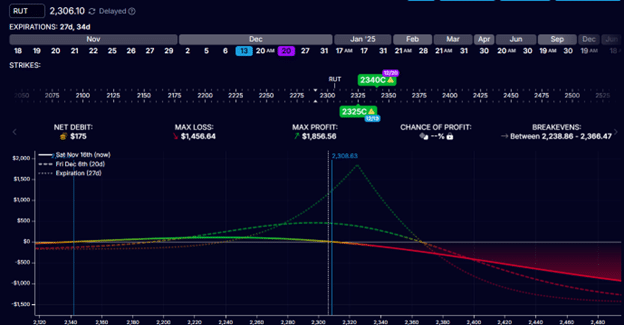
The strikes need not be centered near the current price.
Diagonalizing the calendar gives the trade a slight directional bias, as can be seen by the tilt in the T+0 line.
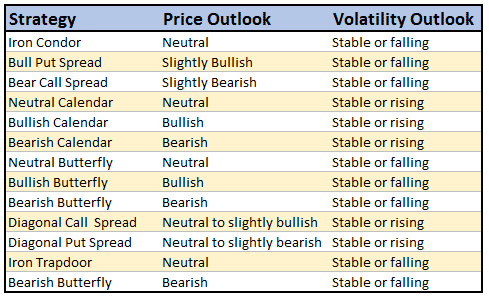
When to Use Each Strategy
When trading options, selecting the right strategy is crucial to aligning with your market outlook.
The table below provides a quick reference guide to help match your expectations for price movement and volatility with the most appropriate options strategy.
Whether you’re bullish, bearish, or expecting neutral market conditions, this guide simplifies the decision-making process by highlighting strategies that thrive in specific scenarios.
Use it to refine your approach and enhance your trading outcomes.
Risk Management Master Plan
Position Sizing Guidelines
When learning, keep the position size as small as possible.
Then, scale up slowly with time to 20% to 30% of the portfolio to options.
Even many experienced traders may use up to only 50% of their portfolio in options.
It is wise to scale up in stable market conditions and scale down in uncertain markets.
Some reasons one might want to reduce size would be:
- In extremely high VIX environments or when the market is in backwardation.
- During earnings season, stocks can make large, unpredictable moves.
Stop Loss Strategies
Owning a covered call is somewhat similar to owning stock.
You have to know when to exit before you get into the trade.
If your rule is to cut the loss at 7% of stock decline, then do the same for covered calls.
Keep the max loss of each individual option strategy to no more than 1% to 5% of your portfolio size.
Keep the average loss relatively close to your average gain.
If you take profit at 10% gain, then cut loss at 15% loss.
You don’t want one loss to wipe out ten wins.
Portfolio Heat Map
Know the mix of your portfolio.
Is the portfolio net long or net short?
Is that in line with the market sentiment?
Or do you want to balance the portfolio between bullish and bearish strategies?
Diversify across strategies, days to expiration, and underlying assets.
Use heat maps to determine whether your positions are heavily weighted in any one sector or type of stock.
Keep your delta dollars in mind and know the level of market exposure.
Maximum Loss Limits
Set loss limits for your trades.
For zero-DTE traders, set a loss limit for the day, week, or month.
Have a maximum loss limit for the overall portfolio.
For example, one may set a rule to stop trading if portfolio losses are 10%.
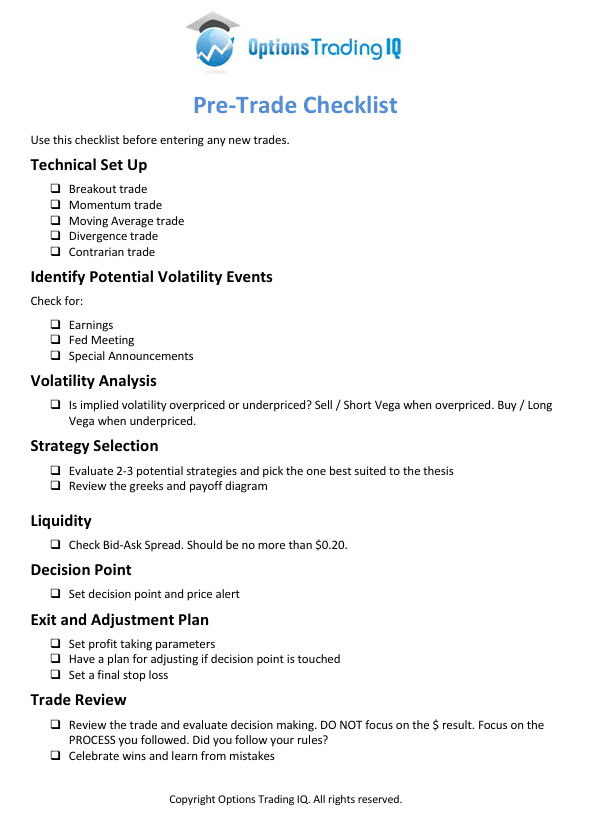
Feel free to use this pre-trade checklist to help with your decision making and risk management.
Real Examples And Case Studies
Below you will find some example trades to look through:
No Stress Iron Condor Trade Example
GS Condor Example with Adjustments
To view more example trades go to the below link and search “example”
Option Education – The Best of Options Trading IQ
Conclusion
We’ve gone over a lot, starting with an introduction to options via covered calls and cash-secured puts.
We progressed into talking about credit spreads and more advanced option income strategies such as iron condors and time spreads.
Through examples with stocks, ETFs, and indexes, we learned how to read the payoff diagram and the nature of income strategies.
Bonus Resources
Free eBooks:
How to Fix Losing Option Trades
Ultimate Guide to Option Greeks
Excel Templates:
We hope you enjoyed this article on Options income strategies.
If you have any questions, please send an email or leave a comment below.
Trade safe!
Disclaimer: The information above is for educational purposes only and should not be treated as investment advice. The strategy presented would not be suitable for investors who are not familiar with exchange traded options. Any readers interested in this strategy should do their own research and seek advice from a licensed financial adviser.


