


A bull put spread is a very common trade for options traders. It has a directional bias as hinted in the name and also benefits from time decay, so it is popular with income traders.
Contents
- What Is A Bull Put Spread
- Maximum Loss
- Maximum Gain
- Breakeven Price
- Payoff Diagram
- Risk of Early Assignment
- How Volatility Impacts Bull Put Spreads
- How Time Decay Impacts Bull Put Spreads
- Risks
- Bull Put Spread vs Bull Call Spread
- Short-Term vs Long-Term Bull Put Spreads
- Bull Put Spread Examples
- Summary
What Is A Bull Put Spread
A bull put spread is an options strategy used when a trader is seeking to profit from a moderate increase in the price of the underlying stock.
To execute the strategy, a trader would sell and out-of-the-money put option whilst simultaneously buying a further out-of-the-money put option with the following conditions:
- Both put options must use the same underlying stock
- Both put options must have the same expiration
- Both put options must have the same number of options
- The put option you buy must have a lower strike price than the put option you sell
Since the higher strike put being sold is more expensive than the lower strike put you buy, it means your opening position is positive and you receive a net credit.
To be profitable, your objective is to defend the net credit that you have received.
The bull put spread profits as the stock price rises, with maximum gain limited to the initial net credit received.
This means the strategy has limited risk as well as limited profit potential.
Given its nature, the strategy is generally used when the market is in an upward trend, although the trade can also make money in flat and slightly falling markets.
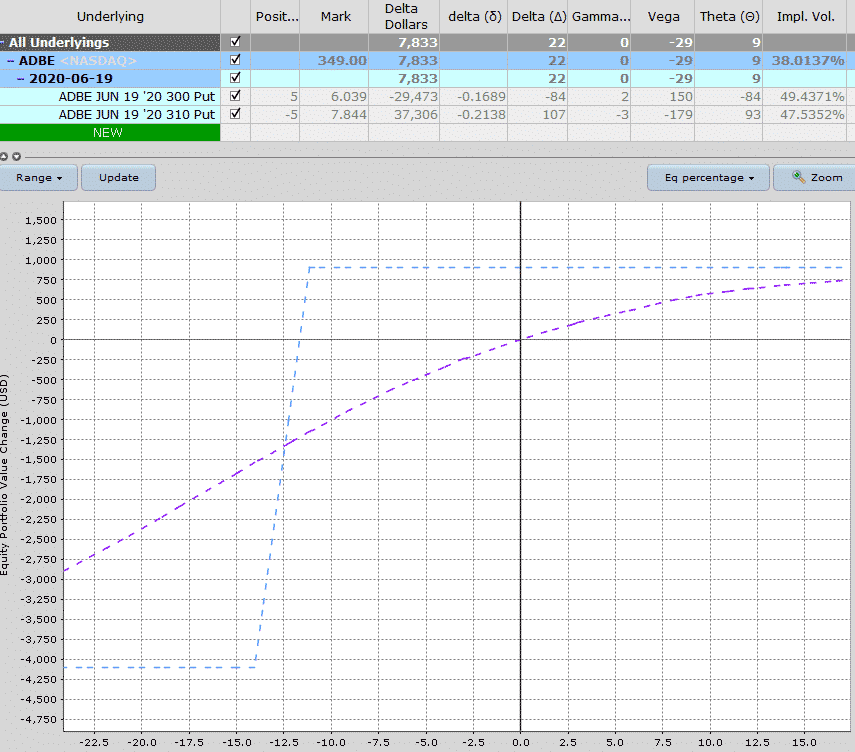
Below is an example using ADBE that we will use for the following sections.
Date: May 4th, 2020 (Star Wars day!)
Current Price: $349
Trade Set Up:
Sell 5 ADBE June 19th, 310 puts @ $7.85
Buy 5 ADBE June 19th, 300 puts @ $6.04
Premium: $905 Net Credit.
Breakeven Price: $308.19
Maximum Loss: $4,095
Return Potential: 22.10%

Maximum Loss
Maximum loss occurs when the underlying stock price closes below the lower strike price on the expiration date.
When this occurs, the trader loses a sum equal to the difference between the strike prices of the two puts, less the net credit they received when they executed the trade.
To calculate the maximum loss, use the following formulas:
Maximum Loss = (Strike Price of Short Put – Strike Price of Long Put + Premium Received)
As an example, you believe ABC company is going to rally soon and you want to use a bull put spread strategy.
It’s currently trading at $54 so you sell a put at $50 and buy a put at $45.
For executing the trade, you receive a net credit of $150.
Unfortunately, it turns out you were wrong about the bullish move and the price of ABC declines to $38 and both options expire in-the-money.
As a result, the put at 50 will have an intrinsic value of $1200 while the put at 45 will have an intrinsic value of $700.
The spread (the difference between the higher and lower strike) is $500 and when taken away from the initial net credit of $150, it means that you will lose $350.
Applying that logic to our ADBE trade, the short put is at $310 and the long put is at $300 which is a difference of $10.
Then we subtract the $1.81 in premium received which gives a maximum loss of $8.19 per contract.
The trade was for 5 contracts each representing 100 shares, therefore $8.19 x 500 = $4095.
Another quick way to calculate the maximum loss is to take $5,000 (5 contracts x $10 width) and subtract the $905 premium received.
Same answer, just a different way to get to it.
Maximum Gain
The maximum gain occurs when the underlying stock price closes above the higher strike price on the expiration date.
When this occurs, both options expire worthless and so the trader earns the maximum gain which is equal to the credit taken when the position was entered.
Placing the strikes further apart results in a higher premium received, but also higher capital at risk.
To calculate the maximum gain, use the following formulas:
Maximum Gain = Net Premium Received – Commissions Paid
Which can only be achieved when the price of the underlying at expiry is higher than the strike price of the short put.
Using our earlier example ADBE example, if the stock finishes above $310 on the expiration date, both options expire worthless resulting in the maximum profit of $905 being achieved.
Breakeven Price
The breakeven price for a bull put spread is found by applying the following formula:
Breakeven Price = Strike Price of the Short Put – Net Premium Received
Taking our ADBE example that would be $310 less $1.81 = $308.19.
Payoff Diagram
Looking at the Payoff Diagram, we can see that below the lower strike price, both options are in-the-money but the changes in their values will offset one another, resulting in a constant loss.
Between the lower strike price and the higher strike price, the profit grows as the underlying price increases.
Finally, when the price moves above the higher strike price, both options are out-of-the-money and total profit is equal to the initial net premiums received.
Risk of Early Assignment
There is always a risk of early assignment when having a short option position in an individual stock or ETF. You can mitigate this risk by trading Index options, but they are more expensive.
Usually early assignment only occurs on call options when there is an upcoming dividend payment. Traders will exercise the call in order to take ownership of the share before the ex-date and receive the dividend.
Short puts can also be assigned early. The important thing to be aware of is that early assignment generally happens when a short option is in-the-money.
For this reason, I usually try not to let the short put go in-the-money with a bull put spread.
How Volatility Impacts Bull Put Spreads
Volatility will not have a huge impact on bull put spreads. The short put will benefit from falling volatility and the long put will benefit from rising volatility.
Therefore, the two tend to mostly offset each other.
That being said, the impact of volatility can depend on where the stock is trading in relation to the strikes in the bull put spread.
Vega is the greek that measures a position’s exposure to changes in implied volatility. If a position has negative vega overall, it will benefit from falling volatility.
If the position has positive vega, it will benefit from rising volatility. You can read more about implied volatility and vega in detail here.
How Time Decay Impacts Bull Put Spreads
Time decay can vary depending on where the underlying stock is trading. Traders placing a standard out-of-the-money bull put spread will start their trade with positive theta.
This means they will make money from time decay as time passes, with all else being equal.
If the stock trades below the bought put, the position will switch to having negative time decay and the passage of time will hurt the trade.
If you think about it logically this makes sense.
If the stock is above the short put, we want time to pass as the trade will move slowly towards the maximum gain.
If the stock is below the bought put, the trade will move closer to the max loss as time passes.
DELTA
Being a bullish trade, the delta of a bull put spread will always be positive no matter what stage of the trade you are in or how it is set up.
The trade does well when prices rise. Pretty obvious, right?
What else do we need to know about delta when it comes to trading bull put spreads?
Well, delta can be used as a rough approximation of the probability of the underlying stock reaching a certain level. For example, if we sell a 10-delta put, there is a roughly 10% chance of that put option expiring in-the-money.
Now, unfortunately it’s not quite that simple, that’s why I said roughly a 10% chance. It’s not an exact science and there are many different variables that go into the options pricing model.
Delta can be used as an estimate of probability and is certainly useful to know. But, don’t assume that if you sell 20 delta puts you are going to win 80% of the time. It doesn’t work out that way in real life.
Be aware of the limitations of using delta as a probability.
GAMMA
Gamma is one of the lesser known greeks and usually, not as important as the others. I say usually, because you’ll see further down in this post why it can be really important to understand gamma risk.
I won’t go into too much detail on gamma here, because it will be explained in more detail below when we compare long-term and short-term bear call spreads.
RISKS
It goes without saying that as a bullish trade, we have a risk that the price of the underlying will fall causing an unrealized loss, or a realized loss if we close the trade.
Some other risks associated with bull put spreads:
ASSIGNMENT RISK
Another risk of the trade is the risk of early assignment. While this doesn’t happen often it can theoretically happen at any point during the trade. The risk is most acute when a stock trades ex-dividend.
If the stock is trading well above the sold put, the risk of assignment is very low. E.g. a trader would generally not exercise his right to sell SPY at $260 when SPY is trading at $300.
The risk is highest if the stock is short put is in the money.
One way to avoid assignment risk is to trade stocks that don’t pay dividends, or trade indexes that are European style and cannot be exercised early. However, this should not be the primary factor when determining which underlying instrument to trade.
Otherwise, think about closing your bull put spreads if they are close to being in-the-money.
EXPIRATION RISK
Leading into expiration, if the stock is trading just above or just below the short put, the trader has expiration risk.
The risk here is that the trader might get assigned and then the stock makes an adverse movement before he has had a chance to cover the assignment.
In this case, the best way to avoid this risk is to simply close out the spread before expiry.
While it might be tempting to hold the spread and hope that the stock rises and stays above the short put, the risks are high that things end badly.
Sure, the trader might get lucky, but do you really want to expose your account to those risks?
Bull Put Spread vs Bull Call Spread
No prizes for guessing that these are both bullish trades and that one uses puts and the other users calls.
The other major difference between the two is that the bull put spread is a credit spread (we receive option premium) whereas the bull call spread is a debit spread (we pay option premium).
Traders sell a bull put spread and option premium is received into the traders account.
For a bull call spread, traders buy the spread and therefore have to pay money out of their account.
So, how do you determine which trade is right for you?
To be honest, it really doesn’t matter because they are both almost identical trades.
Let’s look at an example so we can better compare the two.
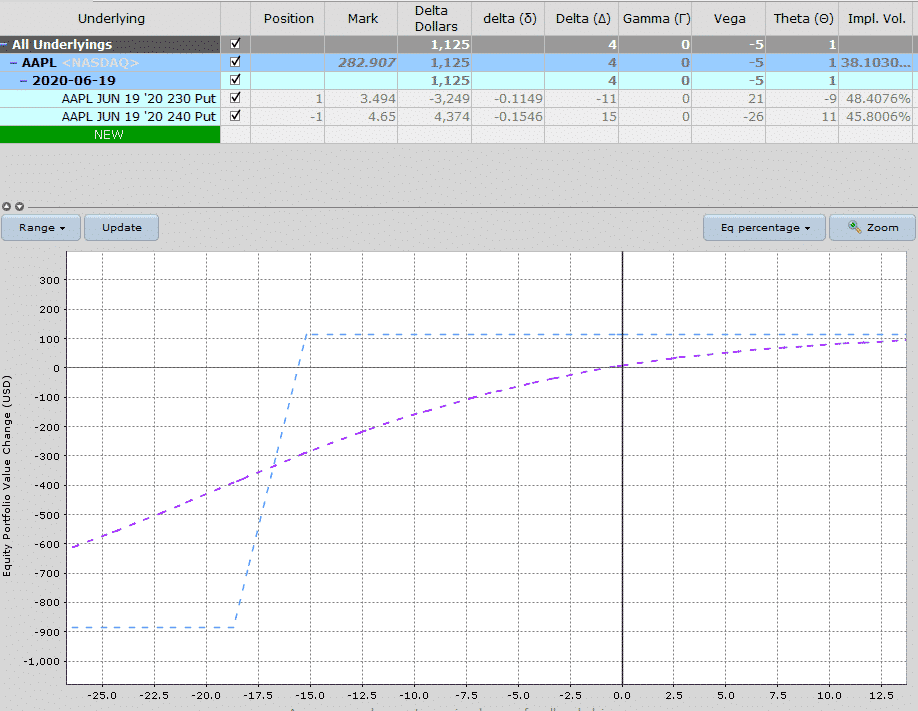
With AAPL trading at $282 let’s compare selling a $240-230 bull put spread with buying a $230-240 bull call spread.
Firstly, the bull put spread. This spread is trading for around $1.15 meaning the trade selling this spread would receive $115 in premium and would have $885 at risk. The delta is 4, gamma is 0, vega is -5 and theta is 1.
AAPL BULL PUT SPREAD
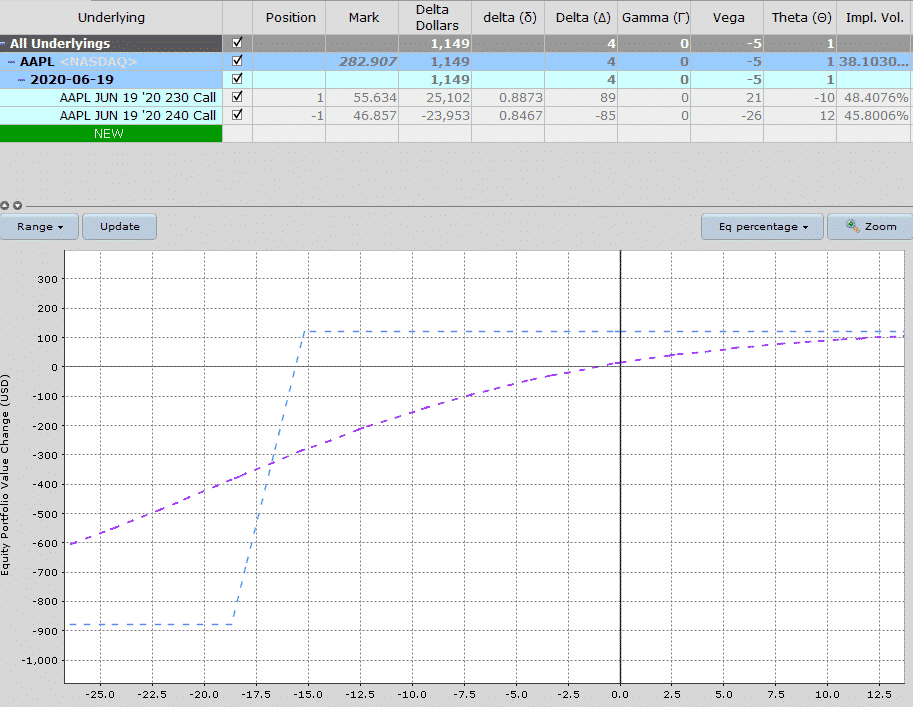
Instead, if we bought a bull call spread which would involve buying the $230 call and selling the $240 call the trade would cost $878 and have a profit potential of $122. The delta is 4, gamma is 0, vega is -5, and theta is 1. Identical to the bull put spread.
The extra $7 in profit potential is possibly due to the early assignment risk that is faced due to selling a $240 which is deep in-the-money. Otherwise, it is essentially the same trade.
AAPL BULL CALL SPREAD
The main thing to keep an eye on when deciding on a bull put spread vs a bull call spread is the implied volatility skew.
If the puts have a high level of implied volatility compared to the calls, then a bull put spread may be more advantageous and vice versa.
Just check the max gain and loss for each and see if there is any major difference. In practice, most of the time, there is not going to be much difference.
Typically, traders will use bull put spreads as an income generating trade and therefore place the spread out of the money.
Traders using the bull call spread, would usually take a more speculative view.
They might buy an out-of-the-money bull call spread, something they can do fairly cheaply with the aim of making a large profit.
Short-Term vs Long-Term Bull Put Spreads
I harp on about this quite a lot with my mentoring students, but short-term trades of any kind are very risky. The reason is because of gamma as I alluded to earlier.
Short-term trades have very high gamma, which means they are very sensitive to changes in price.
Trades with high gamma will see their delta change at a much faster rate than low gamma trades.
If you want a full tutorial on gamma, you should read this article.
Long-term trades have a much lower gamma and therefore are not as sensitive to changes in price.
Let’s compare a short-term and a long-term bull put spread:
Here we have a couple of SPY bull puts spreads at $265-260. The first trade has an duration of 11 days to expiry and the second trade has 145.
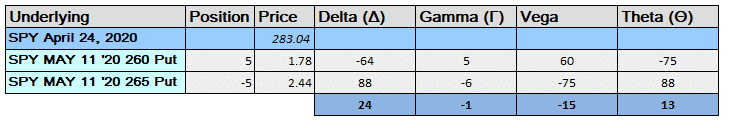
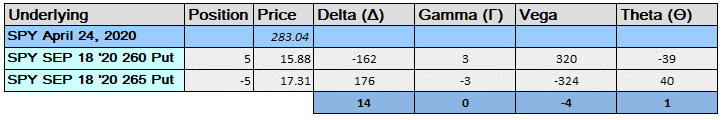
From the data above, we can see some key difference, mainly in the greeks of delta and vega.
Delta on the short-term trade is 24 which is almost double the long-term trade delta of 14.
Vega is much higher in the short-term trade as well at -15 compared to -4.
As you would expect with a short-term trade, theta is high at 14 and very low in the long-term trade.
Gamma is very low in both trades.
A short-term bull put spread is going to experience much higher P&L fluctuations than a long-term bull put spread. That can be a good or a bad thing depending on whether the stock rises or falls.
Bull Put Spread Examples
One of my favorite option strategies is to find beaten down Dow Jones Industrial stocks and sell long-dated, deep out of the money put spreads.
I’ve talked about a similar strategy in the past called Dogs of the Dow.
The Dow Jones index contains some of the biggest and best companies in the US. The bluest of blue chips. If you find that one of these stocks is down 20 odd percent, chances are they are going to recover at some point.
It’s unlikely they’ll drop another 20%. Unlikely , but not impossible. There is always risk with any strategy.
Back in May 2019 INTC was one such Down stock that had been beaten down due to the trade war with China.
You can see on the chart below that INTC was deeply oversold having dropped from $58 to $44, a drop of 24%.
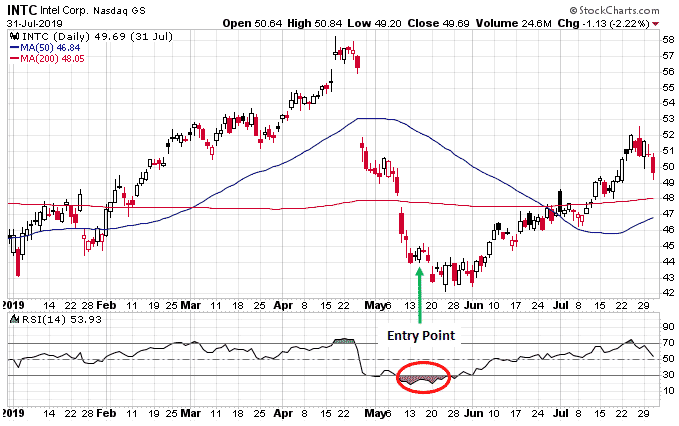
On May 15th I sold 5 of the January 17th 2020 $35-30 put spreads for $0.52.
Trade Details
Date: May 15, 2019
Price: $45
Trade Set Up:
Sell 5 INTC Jan 17th, 2020 35 puts @ $0.93
Buy 5 INTC Jan 17th, 2020 30 puts @ $0.41
Premium: $260 Net Credit
Max Risk: $2,240
Return Potential: 11.61%
Breakeven Price: $34.48
Decline to breakeven: -23.38%
Looking at this trade, you can see it had an 11.61% return potential and could withstand a further 23.38% decline at expiry before hitting the breakeven price.
The duration of the trade was 248 days so the return was equivalent to a 17.09% return per annum.
I ended up closing the trade early once INTC rallied as there was no point holding the exposure for the full duration.
The spread was bought back for $0.11 on September 11th for a total return of 9.15% in 120 days or 27.84% per annum.
Here’s another example, this time on BUD, not a Dow stock, but a solid blue chip company nonetheless and who wouldn’t want to invest in a beer company?
Trade Details
Date: February 12, 2019
Price: $74
Trade Set Up:
Sell 1 BUD Sept 20th 70 puts @ $3.02
Buy 1 BUD Sept 20th 50 puts @ $0.43
Premium: $259 Net Credit
Max Risk: $1,741
Return Potential: 14.88%
Breakeven Price: $67.41
Decline to breakeven: -8.91%
With this one, I went a little close with the short strike and also went wide on the spread. The return potential was slightly higher than the previous example and the decline to the breakeven point was also lower.
The rationale for the trade was that BUD had rallied off the lows and was holding above the 20-day moving average which was flattening out and starting to rise.
The short strike was placed right around the 20-day moving average which was likely to hold as support.
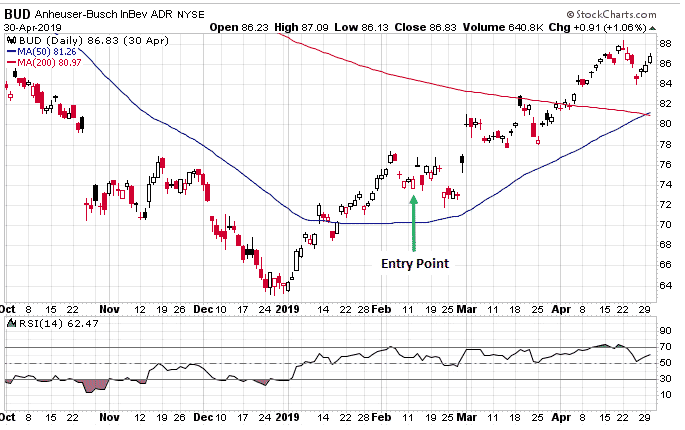
Two months later, BUD has risen substantially, and I was able to take profits early on this one.
The spread was closed on April 23rd for $0.47 after being initially sold for $2.59.
That equated to a 12.18% return in 71 days or 62.60% annualized.
Most of the time these trades work well, particularly in bull markets.
The INTC and BUD examples worked out well, so let’s look at an example on EWZ that didn’t work.
Trade Details
Date: November 8, 2019
Price: $43
Trade Set Up:
Sell 5 EWZ Sept 20th 37 puts @ $2.14
Buy 5 EWZ Sept 20th 32 puts @ $1.02
Premium: $560 Net Credit
Max Risk: $1,940
Return Potential: 28.87%
Breakeven Price: $35.88
Decline to breakeven: -16.56%
At first glance, this trade looks like a really good opportunity. A 28.87% return potential in 10 months or around 33% annualized with a 16.56% decline to the breakeven price.
Unfortunately, the coronavirus hit in February/March and EWZ dropped sharply.
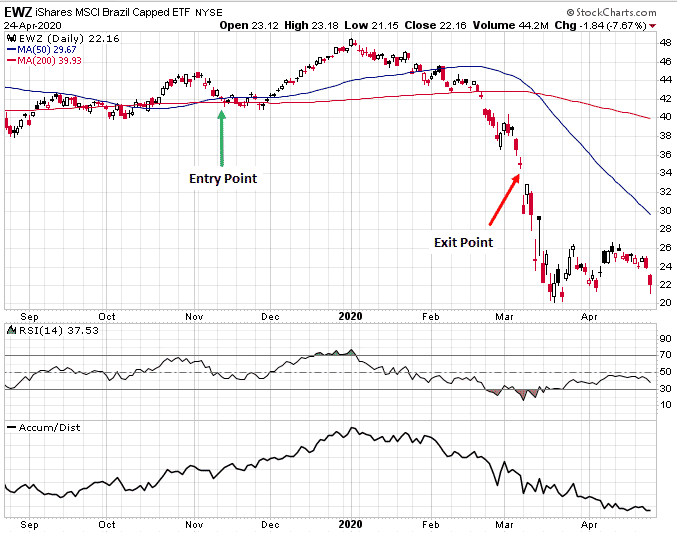
On March 6th, EWZ dropped through support at $36 and I was stopped out of the trade at $2.31 for a total loss of $595.
This represented a 30.67% loss or 93.29% annualized. Stop losses are very important with any strategy and looking back I should have closed this earlier, but such is life.
Summary
- Selling bull put spreads is a popular trade with income investors who have a neutral to bullish view on a stock.
- Bull put spreads are defined risk, defined profit trades.
- P&L on short-term trades will fluctuate much more than on long-term trades.
Trade safe!
Disclaimer: The information above is for educational purposes only and should not be treated as investment advice. The strategy presented would not be suitable for investors who are not familiar with exchange traded options. Any readers interested in this strategy should do their own research and seek advice from a licensed financial adviser.


Hi, this is a very great article. Highly informative and helpful. I have a question and not sure if you can help me. How do u calculate the combined delta of a bull put spread?
Hi Alex L, you simply add the delta of the short put and long put. So, in the first ADBE example above, there are two ways you could calculate it using either the strike delta or position delta.
Strike Delta:
0.2138 – 0.1689 = 0.0449
Then, to convert this to Position Delta: 0.0449 x 5 x 100 = 22.45
Position Delta:
107 – 84 = 22 (same as above except for rounding)
So the combined position is roughly equivalent to being long 22 shares of ADBE.
Let me know if that makes sense? If you have further questions, please send me an email.
Hi Gavin – quick question about spreads, specifically Bull Put Spreads. If at expiration price of underlying expires below both strikes, do you have to take any action to execute the long put or does that happen automatically? What if the underlying closes between the two strikes? I use IBKR.
I’m learning to sell options for income, So far just selling naked puts with the “wheel” occasionally turning over to a covered call. Doing very well so far but I’d like to add some protection against corrections. I’m thinking that Bull Put Spreads can provide more profit potential from my limited Buying Power and also do it more safely. Is this correct?
thanks and regards …Bill D
Hi Bill,
Yes BPS are a more efficient use of capital, just be careful not to take on too much risk with too many positions.
If both puts are ITM, your broker will basically buy and sell the shares, so nothing really to do, but best to check with your broker. My suggestion also is to never let the short strike go ITM in the first place. Unless the BPS is a quasi-wheel trade where you plan on taking assignment if it drops.
HI Gavin, for above examples, do you agree that it can be more profitable to add OTM bear call spread to get more premium. That will be similar to iron condor.
Yes, that is something that I will do quite regularly.