


OptionNet Explorer is a valuable software for studying options strategies.
It is also referred to simply as ONE for short.
While we all love to use free tools whenever we can, OptionNet Explorer is not free (there is a cheap 10-day trial).
It has a subscription-based pricing model, which you can find on its website.
Contents
Introduction
While many other tools out there can show us the expiration risk graph, the T+0 line, and the Greeks, the feature that ONE has that makes it worth its price is its ability to back-trade option strategies.
I rather use the word “back-trade” rather than “backtest” because many people think of backtesting as automated backtesting.
This is not what ONE does. Instead, it lets you turn back the clock and simulate option trades using historical option pricing data.
Just like a student pilot will use a flight simulator to learn how to fly a plane, think of ONE as a flight simulator for options trading.
By practicing your option strategy over a wide range of market conditions in the past, you will become more proficient in your strategy faster.
Paper trading in real-time is fine.
But if your trade takes one month to run to completion, then it takes you a month to gain the experience of one trade.
With ONE, you can simulate the passage of one day by clicking a button.
Hence, you can gain experience in one trade in a matter of minutes.
Options traders practicing their craft have been known to back-trade ten years of market data.
Some can show you reams of spreadsheets of back-traded results gained through simulated hypothetical back trades.
Understandably, there is some learning curve when starting with OptionNet Explorer, but it will be well worth it.
To show a brief overview of some of the features in OptionNet Explorer, let’s pretend that we have the below post-earnings trading strategy we want to study.
If there is a gap up or down after a stock’s earnings announcement, the strategy is to initiate either a bull put credit spread or a bear call credit spread, respectively.
The spread should have the short strike close to the 15-delta on the option chain and be about 35 days to expiration.
Adjust the width of the spread and number of contracts to receive a total credit of about $200 to start.
Immediately, set a good-till-cancel order to take profit at 5% of the max capital at risk. Have a mental stop loss of 15% of max risk.
However, the trader can exit loss earlier based on price action if the trade is not going in the desired manner.
For example, Microsoft (MSFT) had an earnings announcement on the evening of October 24th, 2023.
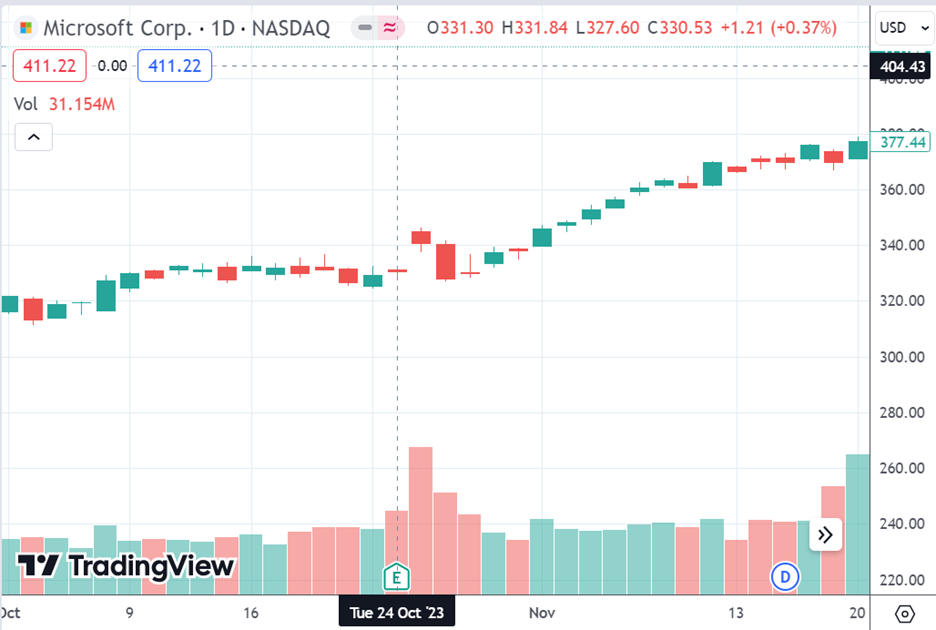
It gapped up the next day, on October 25th.
OptionNet Explorer can set the calendar back to October 25th, 2023, and even at a particular time of day (in 5-minute increments).
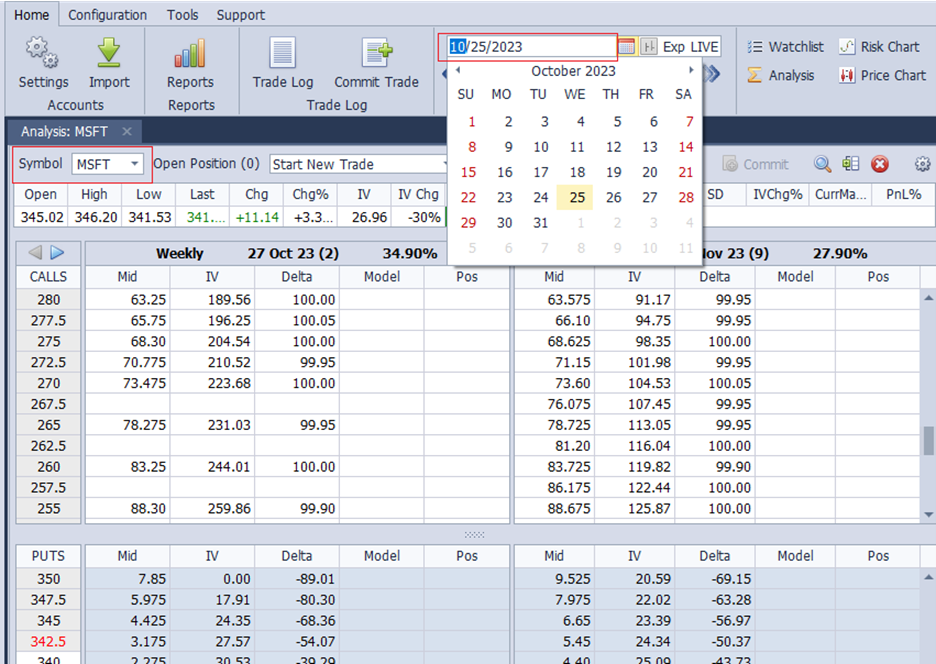
With the symbol set to MSFT, the option pricing and all data shown are pulled from OptionNet Explorer’s database of the historical data from that date and time.
So now we can pretend that we are putting on a bull put credit spread back on October 25th:
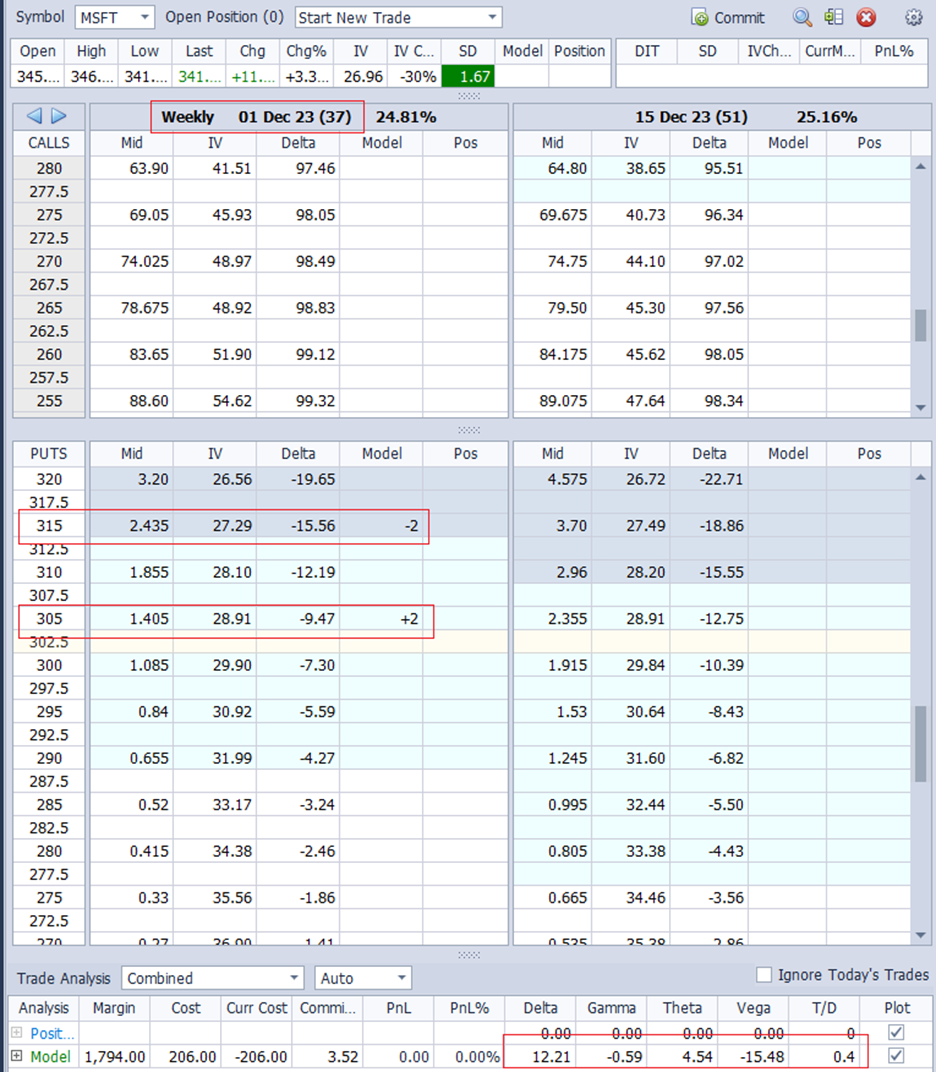
The “-2” in the Model column means that we plan to sell two contracts of the 315 put options with the weekly expiration of December 1st, 2023, 37 days from now (see number in the parenthesis).
The “Delta” column shows this option is located at the -15.56 delta on the option chain.
We are also buying two options (hence the +2) with the 305 strike price on the same expiry.
At the bottom of the table, ONE shows us the Greeks of this configuration to be:
Delta: 12.21
Gamma: -0.59
Theta: 4.54
Vega: -15.48
It computes the Theta/Delta ratio for us as being 0.4.
In another panel, you can see the expiration and current-time payoff graphs (the T+0 line):
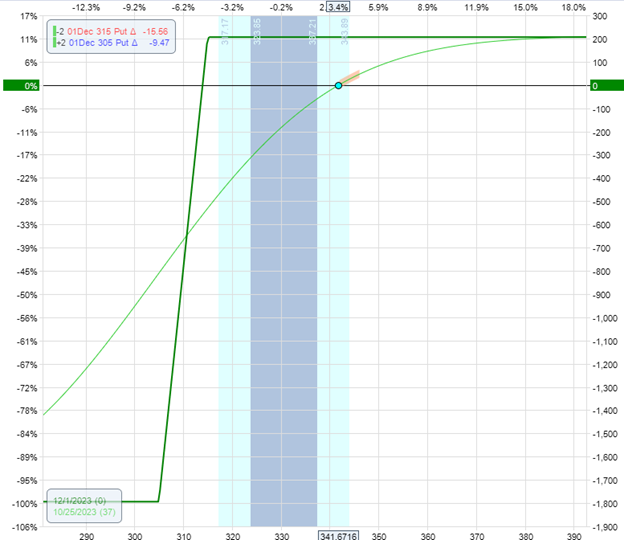
The horizontal axis at the bottom is the price of the underlying.
The vertical axis on the right is the P&L (profit and loss) of the position in relation to the underlying price.
From this, we see that our max potential reward is around $200, and our max potential risk of this trade is about $1800, giving a 9-to-1 risk-to-reward ratio.
Since all the numbers are within the strategy’s guidelines, we can pretend to place this order by clicking on the “Commit” button in ONE, and it will show us the order with the bid/ask spread.
It shows that if we get filled at the mid-price, we will get a credit of $1.03 for each contract on a per-share basis.
If you don’t think getting filled at mid-price is realistic, you can adjust the price in the slider closer to the bid.
As expected, the “Spread Price History” shows that this spread drastically dropped in price right after the earnings were announced.
Clicking “Save” will commit this order, and ONE will start tracking our P&L.
The Next Day
We can advance time by clicking these buttons:
We jumped ahead 24 hours to the next trading session to see that our position was down -$140 and down 7.8% of the max capital at risk (see below).
The max capital at risk is shown as $1794 under the “margin” column.
This graph has extra curved lines because I have turned on 5-line projections to see what the T+7 lines and T+28 payoff lines look like.
These are the project payoff curves seven and 28 days from now.
What happened?
Why is our trade down $140 in one day?
Now we have a sense of the possible P&L variance of this strategy from day to day.
No need to switch back to your charting software. We have a candlestick chart right inside OptionNet Explorer:
I’ve added Bollinger Bands, a moving average, MACD, and implied/historical volatility to the chart. You can add other common indicators or remove them completely as you like.
Seeing that MSFT is dropping through the earnings gap, we decided to exit this trade and record the -$140 loss in our backtesting spreadsheet.
Could This Trade Be Repaired?
Maybe instead of exiting, we can adjust the trade by adding a bear call credit spread to reduce our position delta.
The screenshot below shows that the short put, which started at the 15-delta, has now gone to the 24-delta on the option chain, which indicates that the credit spread is in a bit of trouble:
We decided to add a one-contract bear call spread, selling the 365 and buying the 380 strikes, as shown above.
The “Trade Analysis” panel shows that this would decrease our position delta from 16.22 to 7.25. It also increases our theta from 3.94 to 8.73.
The risk graph has been updated to show our resulting unbalanced iron condor position:
I’ve also turned on the Greeks histogram at the bottom of the graph to show how Delta and Theta would change as the price of the underlying moves left or right along the horizontal axis.
We see that the sweet spot with the highest theta (blue histogram with the value 10) is when the underlying price is near the middle of the expiration graph.
This is also where the delta histogram is the lowest.
Having seen how much our P&L can change in one day, this time, we will monitor our position more closely at a frequency of, say, once an hour. We can click the advancement buttons below the calendar like we did.
Or we can save our fingers by letting ONE play out the movement of our position one hour at a time.
As we watched this, we saw that on November 1st, one hour after the market opened, the trade came back into profitability:
Okay, let’s close the trade.
OptionNet Explorer kept track of our P&L, including the credit/debit of the adjustment and commission (whose value you can configure).
It showed that we had made $4.50 with seven days in the trade (DIT):
While this trade was not considered a success, at least we could bring it back into profitability from a drawdown.
Alternative Adjustment
What if we had made a different type of adjustment?
Instead of a bear call spread, what if we had added a put debit spread with a different expiration?
No problem. In the “Trade Log,” we can delete the adjustment we made on October 26th and then go back to that date.
We now are adding a put debit spread on the December 15th expiration that is 50 days away – buying the 340 put and selling the 330 put:
Additionally, this results in a decrease in delta and an increase in theta:
With the resulting expiration graph looking like a shark fin:
In this case, the trade at a 9% loss doesn’t look like it is working:
On November 7th, we terminated the trade with a loss of -$160.
Conclusion
Of course, we cannot draw conclusions based on one or two trades.
Repeat this process for different stock symbols across many post-earning events and across both bullish and bearish years until you accumulate enough data to run more significant statistics.
Maybe even try credit spreads of different days-till-expirations.
By analyzing our spreadsheet, we see that sometimes simply exiting gives us better results, and other times adjusting the trade gives us better results.
We can see how many trades worked out, how many trades did not, and the average length of time in the trade.
What is important is to see the expectancy of the strategy.
In our experiment of 33 trades, we had total profits of positive $1169 with eight losses and 25 wins.
Therefore, we have a positive expectancy of this strategy based on our limited backtest.
Not only is OptionNet Explorer an invaluable tool to help us with arriving at such statistics, but the practice of manually back-trading will give you intimate knowledge of a strategy so that you get an intuitive feel for when a trade is working and when it is not, when to exit, and when to adjust.
We hope you enjoyed this article on using OptionNet Explorer to study options strategies.
If you have any questions, please send an email or leave a comment below.
Trade safe!
Disclaimer: The information above is for educational purposes only and should not be treated as investment advice. The strategy presented would not be suitable for investors who are not familiar with exchange traded options. Any readers interested in this strategy should do their own research and seek advice from a licensed financial adviser.


Are the supported symbols listed anywhere?
Pretty much any stock that is optionable.
Great post! But the images are not showing. Thanks for sharing!
Weird. Looks fine on my side.
Hi Gav, do you use the CEV and Volatility Surface of Options Model in the Configuration Tab? If I select either of them, some Greeks will change. I don’t know when to use it and what it means for.
I just use the default settings
Hi Gav,
Same here with images. The last one I can see is the 1st Pay Off diagram.
Cheers
How strange. They all look fine for me. Maybe try a different device / browser. That’s concerning though and I’m not sure why you can’t see them. Hopefully that isn’t happening for all articles.