


Today, we are looking at a MACD Crossover Strategy backtest.
In the previous article, we talked about various ways of using the MACD indicator to take a directional trade.
In this article, we will back-test one particular set of rules to see how well the MACD Crossover Strategy works.
Contents
The Rules
We are going to take bullish and bearish MACD signals if the signal is in line with the dominant trend as determined by the 50-day simple moving average.
If the price is above the 50-SMA, we only take the bullish MACD signals.
If the price is below the 50-SMA, we only take the bearish MACD signals.
We are not going to distinguish between bullish continuation signals and bullish reversal signals.
We take either crossover regardless of if it happens above or below the zero line.
For the bullish directional trade, we use a bull put spread with the short strike around 15 to 20 delta with 3 to 4 weeks to expiration.
Skip trades that span stock earnings announcements.
For the bearish trade, we use bear call spreads with similar specifications.
For simplicity, we will not make any adjustments to the credit spreads.
However, we believe that in live trading, it would be beneficial to do so when spreads are threatened.
In this back-test, we take profit at 80% of the credit received or if we have captured a 10% return on the margin used in the trade.
We assume that a good-to-cancel order is placed to take profit.
A stop loss can be set when we see that the loss has exceeded 15% of the margin used in the trade.
We are looking only once a day at 2 hours after the open.
We assume that there is no automatic order to take stop losses.
So it is possible that the loss can exceed the 15% mark by the time we look at the check-point time.
In the event that neither take-profit nor stop-loss are triggered, and it is seven days before expiration, we exit the trade at the check-point time and take whatever gains or loss it has at the time.
The Results for SPX
For the one-year time period from July 1, 2021, to June 30, 2022, there were eight valid MACD cross overs on SPX, which were not filtered out by the 50-SMA trend rule.
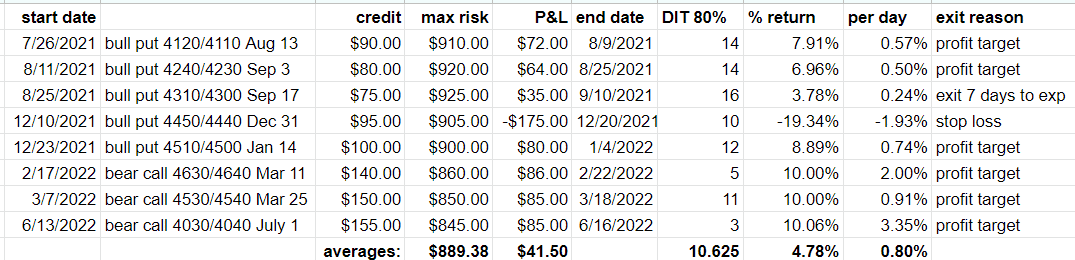
Of the eight trades, six of them reached the profit target.
One exited due to the stop-loss rule. And one exited seven days before expiration.
In aggregate, the eight trades gave a total of $332 in profits.
Note that this is for one contract of an SPX credit spread.
If you are using ten contracts, multiply this number by 10.
Typically, the losing trade will lose a larger amount than the winning trade.
We are getting positive results because we are getting enough winning trades to overcome the losses.
Taking into account losing trades, the average P&L per trade is $41.50, with an average risk of $889 per trade.
Our average percent return per trade is 4.7% on the capital at risk.
With an average hold time of 11 days, this is decent results.
Note that this time period tested has a good mixture of a bull market in the second half of 2021 and a bear market in the first half of 2022.
Five of the trades were bull put spreads, and the remaining three were bear call spreads.
The Results for RUT
Doing a similar test for RUT, but for the year 2018, we get an aggregate profit of $281 for the seven trades that were triggered for that year.
The result of a 4.4% return on risk is quite similar to that of SPX.
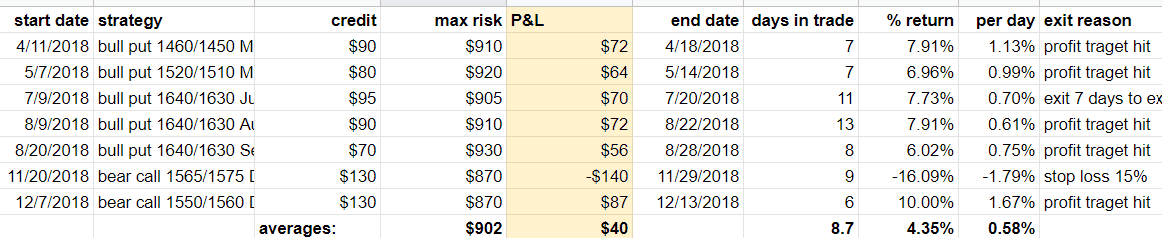
We picked the year 2018 because it was somewhat of a mixed year.
First, the market went sideways, then it went up, and then it went down.
Yet, the strategy performed as well as expected.
The Results for Stocks
The strategy can also be applied to stocks.
But we prefer to do them on higher-priced stocks so that we get better strike selection and can get a bigger credit per trade.
Doing a manual back-test using OptionNet Explorer for the years 2020 and 2021, we randomly selected a few stocks to test some MACD signals.
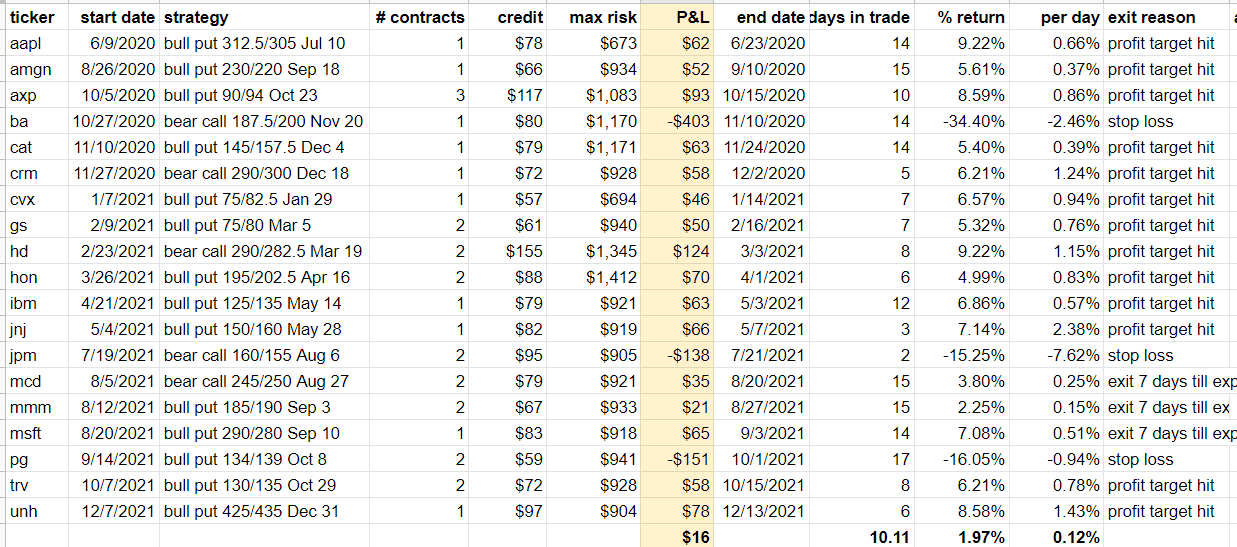
The result of an average 2% return on risk per trade is not as good as the test done on the indices, but at least it is still positive.
Not sure if this is because a stock has an individual stock risk that indices do not or whether it is because of the different time periods tested.
Also, in percentage terms, stock moves much more than indices do.
We wanted to test in the year 2020 to see how the strategy performs during the Covid correction.
Starting with Apple (AAPL), we were looking for a signal in the first half of 2020; but no signals were generated.
When the MACD bearish crossover happened, the price of Apple was still above its 50-day moving average.
Hence no trigger.
The next MACD crossover occurred during the recovery when the MACD line crossed above the MACD signal line.
But Apple was under its 50-day moving average when that happened.
So we were not allowed to take the MACD bullish signal.
To fill in tests for that period, we use the Dow Jones Index ETF (DIA).
It gave a bearish signal on February 24, 2020, at the start of the correction, and then it gave a bullish signal on March 26, 2020, which coincides with the recovery.

Both the trades were successful.
FAQs:
Was this an automated back-test?
No, it was done manually using OptionNet Explorer, which has historical intraday options data.
A better word is that we back-traded it.
With the use of options and somewhat not-trivial rules in this strategy, it is quite difficult to automate — it will take more time to automate than just manually back-trade it.
What is a good back-testing software?
We have not found any back-testing software where we can input all the rules of this particular strategy and just tell it to run.
Something like this will need to be custom programmed.
Can this strategy be applied to Forex?
This particular strategy uses credit spread to take a directional view.
This strategy’s advantage is derived in part from the time decay of credit spreads and in part from the indicator.
As such, this strategy can not be used in Forex because there are no options on Forex.
That being said, you can certainly use the MACD indicator on Forex, and many Forex traders do use MACD.
But you will need to look to them for any back-test results.
Conclusion
The MACD crossover strategy with a trend filter apparently gives pretty good signals.
When used in conjunction with far-out-of-the-money credit spreads, our limited back-test shows that it is a viable strategy as long as you have a reasonable take-profit and loss management plan.
While the back-test was limited in nature, we did try to do a variety of indices, ETFs, and stocks across bullish, bearish, and sideways markets.
The rules, as used in this back-test, generate very few signals. In one year, the SPX only generated eight signals.
While, in a sense, this may be good in that the strategy is very selective and only picking out the best setups, it will miss quite a few profitable setups.
So this may be a good strategy to use in parallel with other strategies.
We hope you enjoyed this article on the MACD crossover strategy backtest.
If you have any questions, please send an email or leave a comment below.
Trade safe!
Disclaimer: The information above is for educational purposes only and should not be treated as investment advice. The strategy presented would not be suitable for investors who are not familiar with exchange traded options. Any readers interested in this strategy should do their own research and seek advice from a licensed financial adviser.


I really enjoy you backtest posts. Thanks.