


Contents
- Introduction
- General Overview
- Back Testing
- Reporting Features
- Broker Interfaces
- Loading Broker Data
- FAQ
- Conclusion
Introduction
OptionNet Explorer is a leading options trading software package that provides traders with a powerful and easy to use tool.
It is great for backtesting and perfecting trading strategies.
It was made with the vision of allowing regular traders to have access to tools that professional traders demand.
This helps traders create complex stock and options strategies without compromising on productivity or accuracy.
The software provides traders with two key functions:
- The ability to design, backtest, and monitor strategies using free historical data.
- The ability to connect to select brokers and push through live trades so that you can monitor their performance in OptionNet.
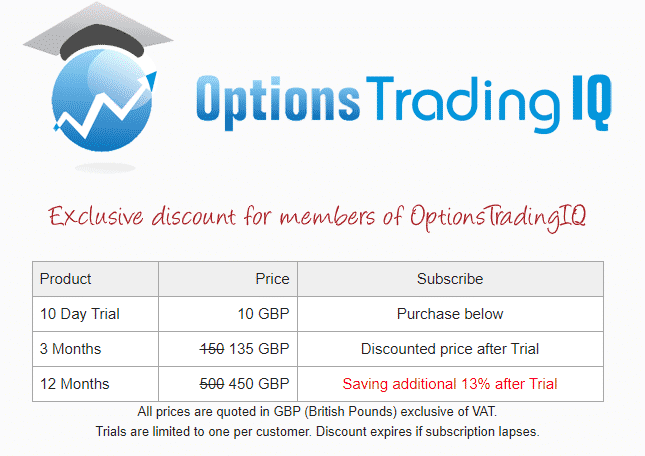
New users have several subscription options available, from a 10-day trial through to 3 month and 12-month options.
Options Trading IQ readers can use this link to get a discounted free trial.
This article will review the features and functionality of OptionNet Explorer so you can make an informed decision on whether this software is right for you.
General Overview
When you start the software up, you are greeted with the main screen which is split into three key sections.
The first section is the top bar, which contains key menu tabs and functions.
From here we can do a number of useful activities, such as viewing trade logs and automated reports.
We can also switch between multiple accounts, backtesting our data, and monitoring live positions.
In the very top left dropdown, there is the ability to select an account from the dropdown list.
You can have up to 200 or so accounts which is useful if you need to organize your trades in different ways. For example, by different strategy, market, risk profile, etc.
Just to the right of that, we have the trading date & time section which is used to access historical data.
Here a specific trading date and time can be selected, and the platform’s free data will populate the main screens for you.
You can go backward by multiple intervals, such as by day or by hour, or even by 5 min intervals.
For ease of use, they also have buttons to enable you to quickly jump to important points.
This could be the high of the day, end of the day, or next the adjustment point.
Two Main Data Windows
Beneath this section, we have the two main data windows.
The left window is where we can select the position we are monitoring (or if creating a new position).
Here we can display a large selection of data points relating to options.
This includes the performance of the underlying and characteristics of the trade like the Greeks and implied volatility.
It’s from here we can also enter trades for both backtesting and live trading, which we’ll cover in more detail later.
On the right-hand side, we can chart and table the performance and characteristics of a position.
We can generate risk profile charts, price action, and fundamental statistics.
To get the best feel for the system, we’ll walk through the features of the tool from a backtesting perspective, followed by a live trading perspective.
Back Testing
The first thing we’ll look at is the ‘Open Position‘ section, found under the main tab.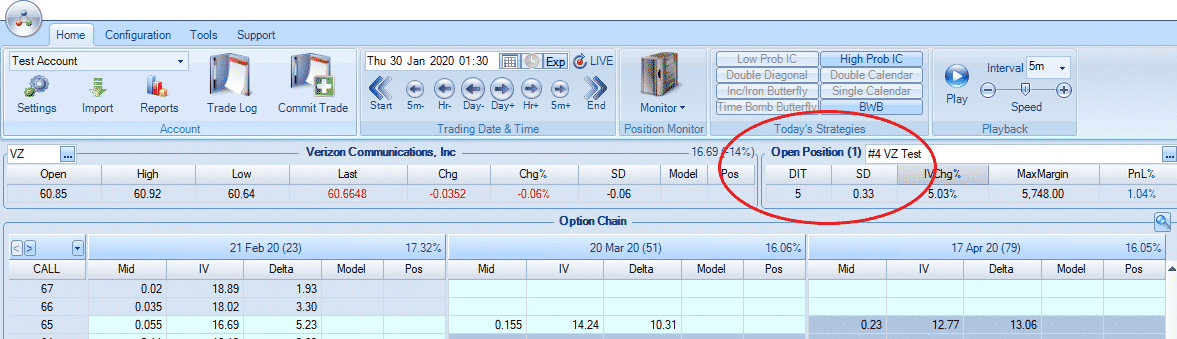
This section is where you select your current active position – whatever you select here will update all the other sections and windows.
When selecting from the dropdown, you can elect to either start a new position or an existing one, so that you can make adjustments.
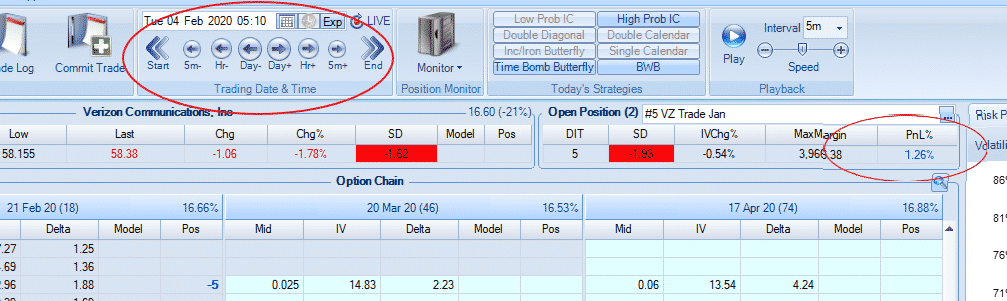
In this case, we’ve selected a position called VZ Test, which the tool will then provide some data points underneath.
This includes the number of days you’ve been in the trade (5 in this case), profit and loss %, standard deviation and IV change %.
If you look at the bottom of the screen, (under the option chain) you will see the specific Greeks for that position along with other key trade analysis insights such as accumulative profit/loss.
The accumulative profit/loss information is particularly useful as every time you make an adjustment.
Your broker might not include the realized profit and loss for that part of the trade, whereas OptionNet Explorer will keep a tally of that for you.
Let’s create a new position and see how we can backtest it.
Under the Open Position dropdown, we select ‘start new trade’.
Next, we have to select what underlying we will use – we can do this just to the left of Open Position by clicking on the dropdown and selecting by underlying name or description.
In this case, we’ve selected Verizon Communications (VZ).
The system then pulls relative data for VZ for the given day, such as Open, High, Low, etc.
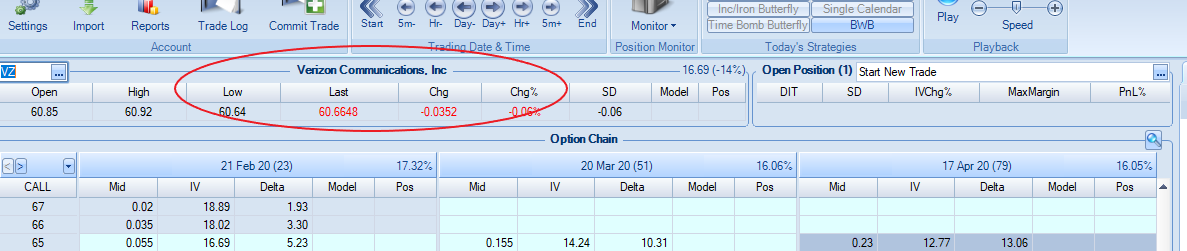
Option Chain Data
Just below that section, we have the Option Chain, which you’ll be familiar with from your regular trading.
The Option Chain provides you with several useful customizations so you can generate a view that’s most meaningful for your trading style.
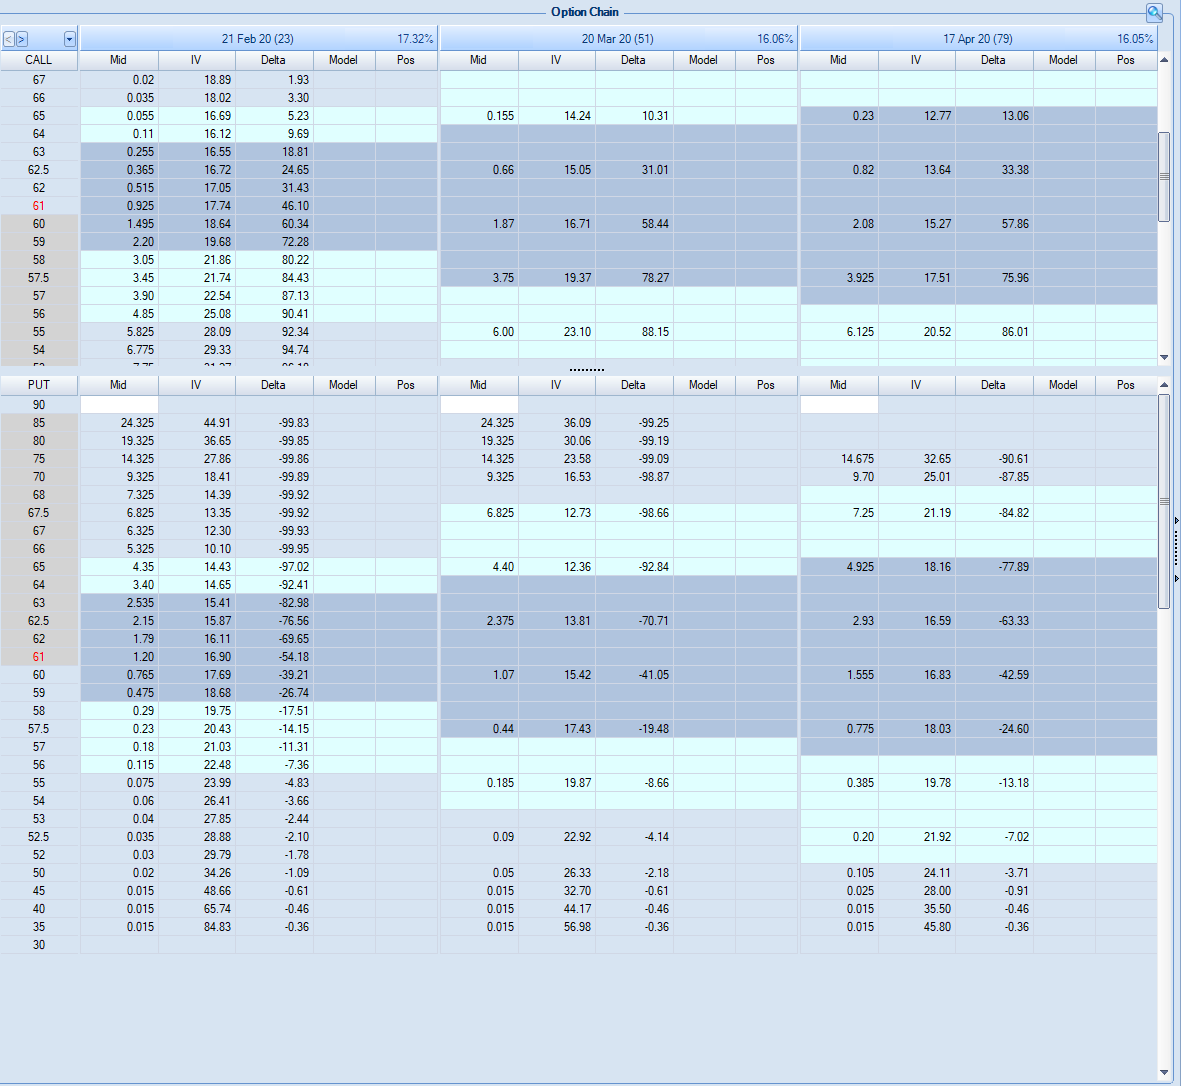
For example, rather than seeing Delta as I have here, you might prefer to see Gamma, Vega, or even non-greek information like the original price, open interest, and traded volume.
One particularly interesting option is the PnL data, which will show you how each individual leg of your trade has performed and contributed to your trade.
To change any of the columns, just left-click on them and then select from the dropdown.
One useful but not immediately obvious feature in the Option Chain table is the number in brackets next to each date.
This shows how many days are left until expiration.
Now that we’ve selected VZ as our underlying and the Option Chain has been updated, we now enter the trade.
We want to do under the ‘Model’ column in the Option Chain.
Here you add the number of contracts you’re looking to buy or sell (e.g. +5 to buy and -5 to sell 5 contracts).
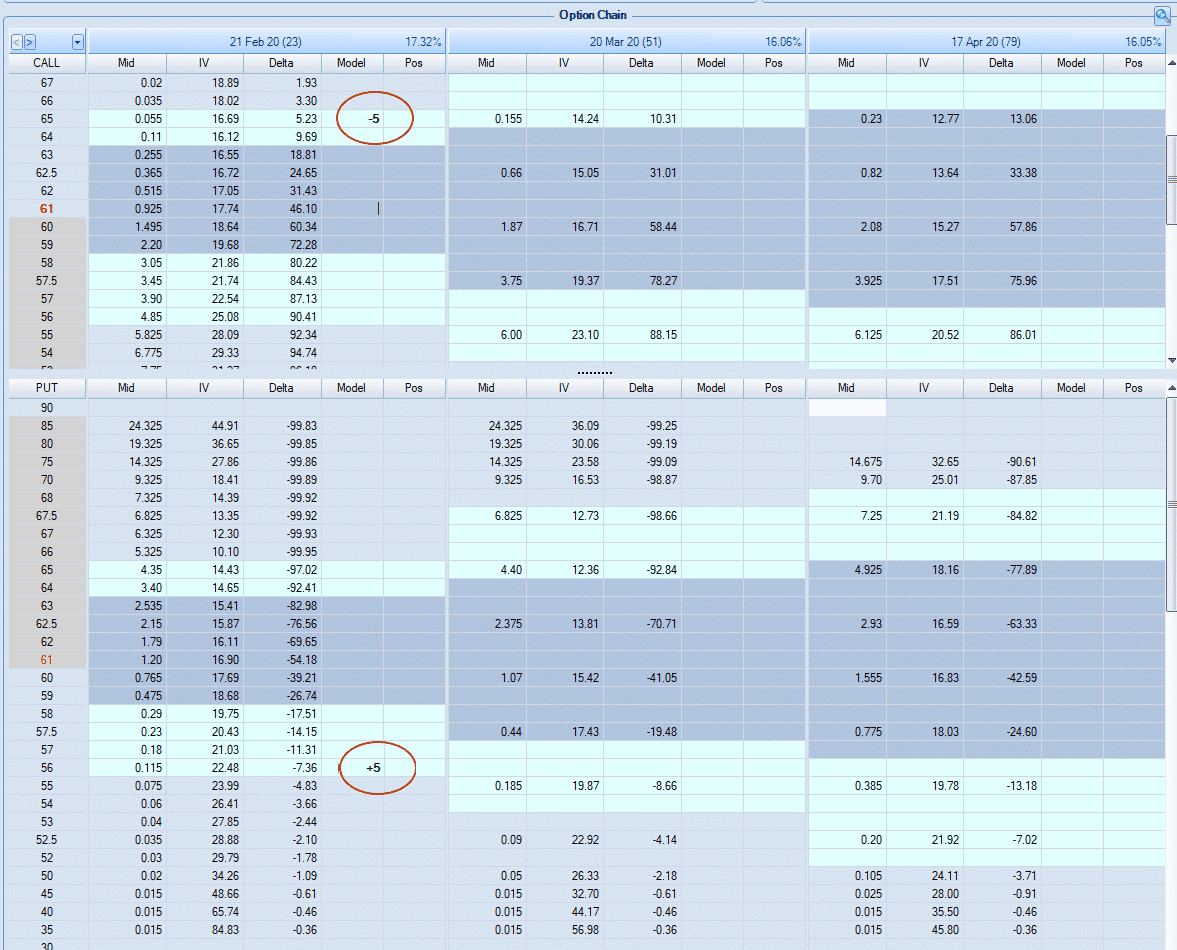
You’ll notice that a risk chart is instantly plotted on the graph on the right-hand window (risk profile).
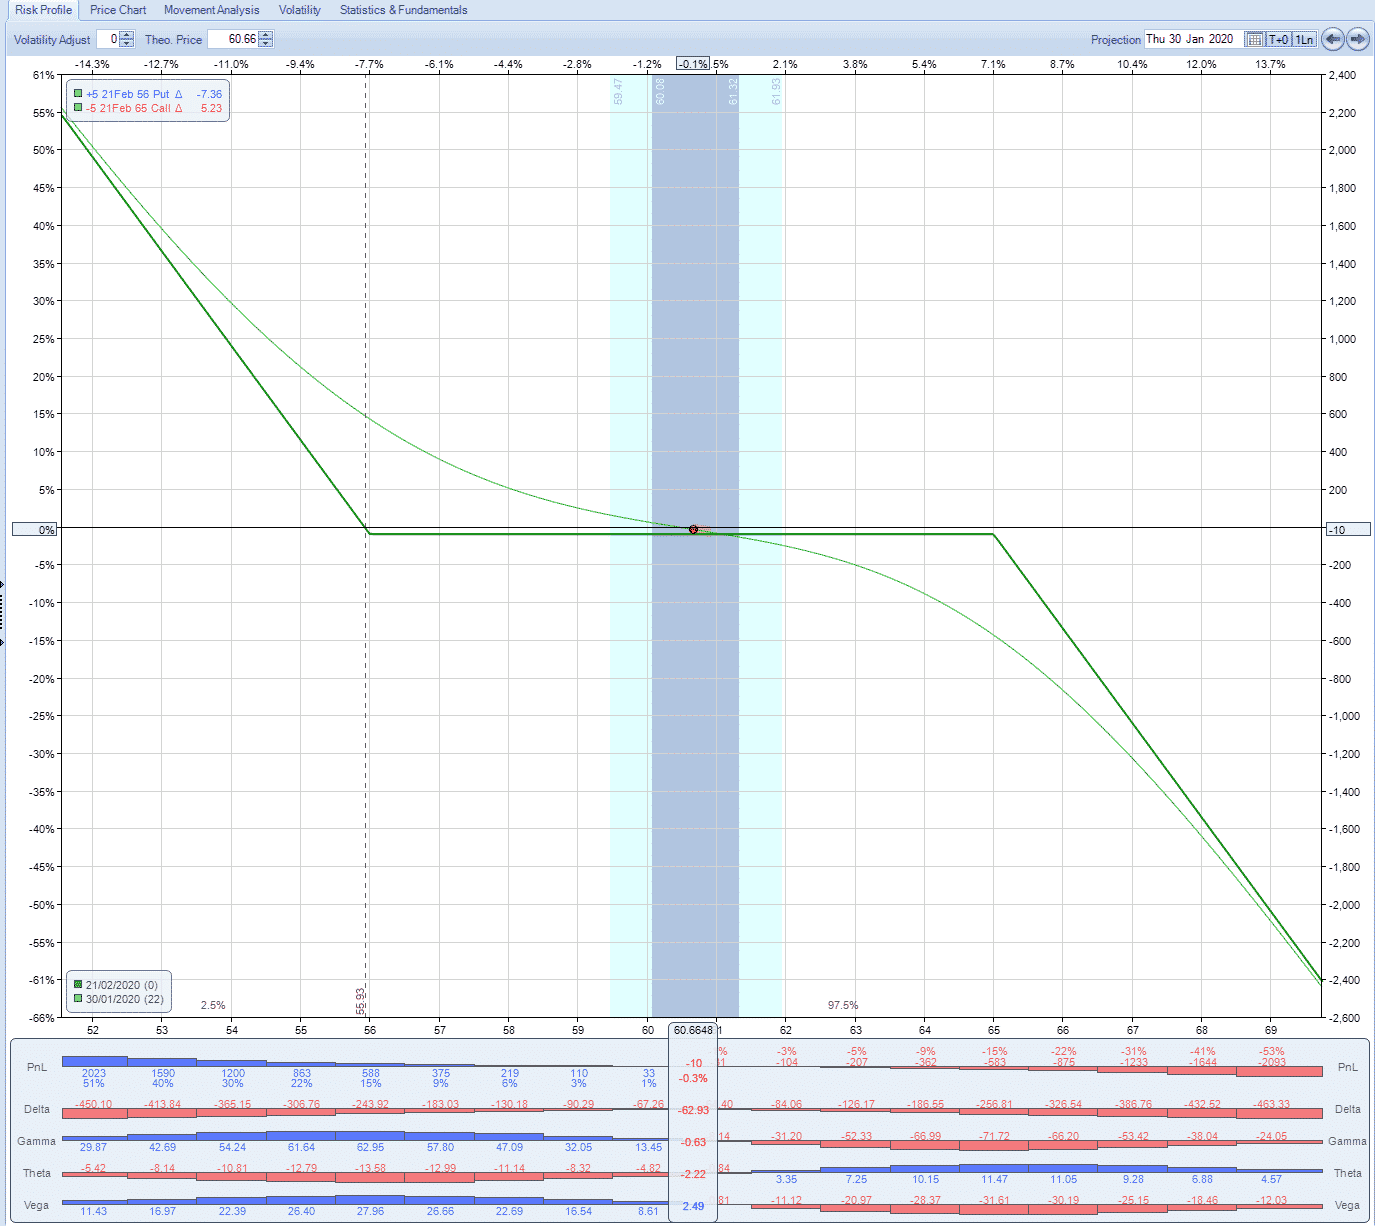
The graph on the right is the main risk profile chart display.
The Greeks
At the bottom of the risk profile chart are the Greeks in a histogram bar chart.
You can customize the number of Greeks displayed by clicking on them and selecting from the menu.
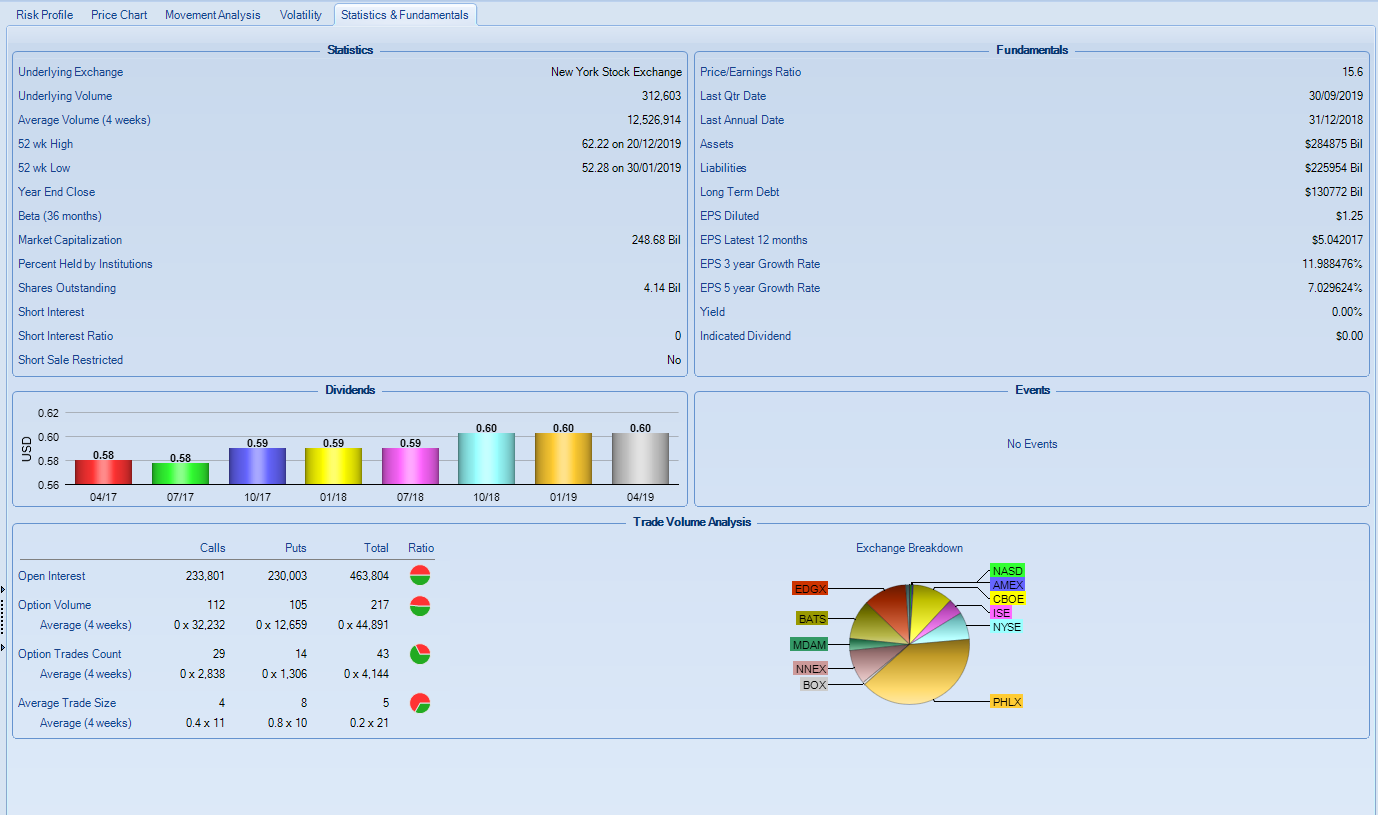
You’ll notice there are also other tabs on the chart window, which include graphs and data covering the price chart for the underlying, movement analysis, volatility, and statistics & fundamentals.
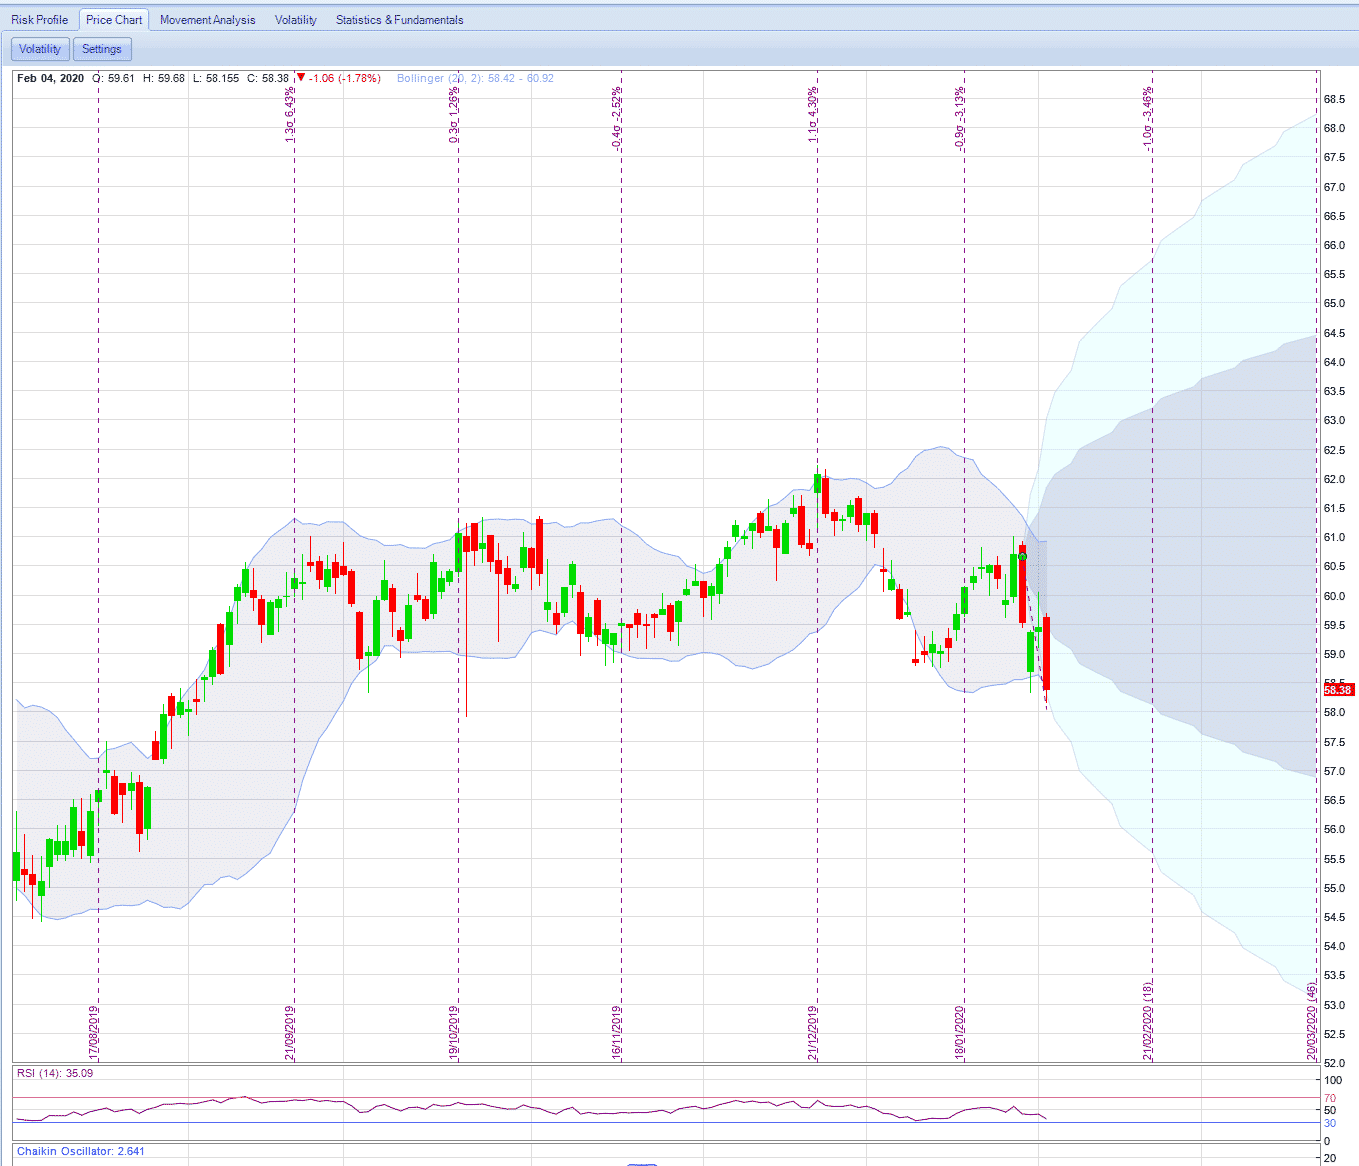
For example, navigating to the price chart we can see the price action for the underling.
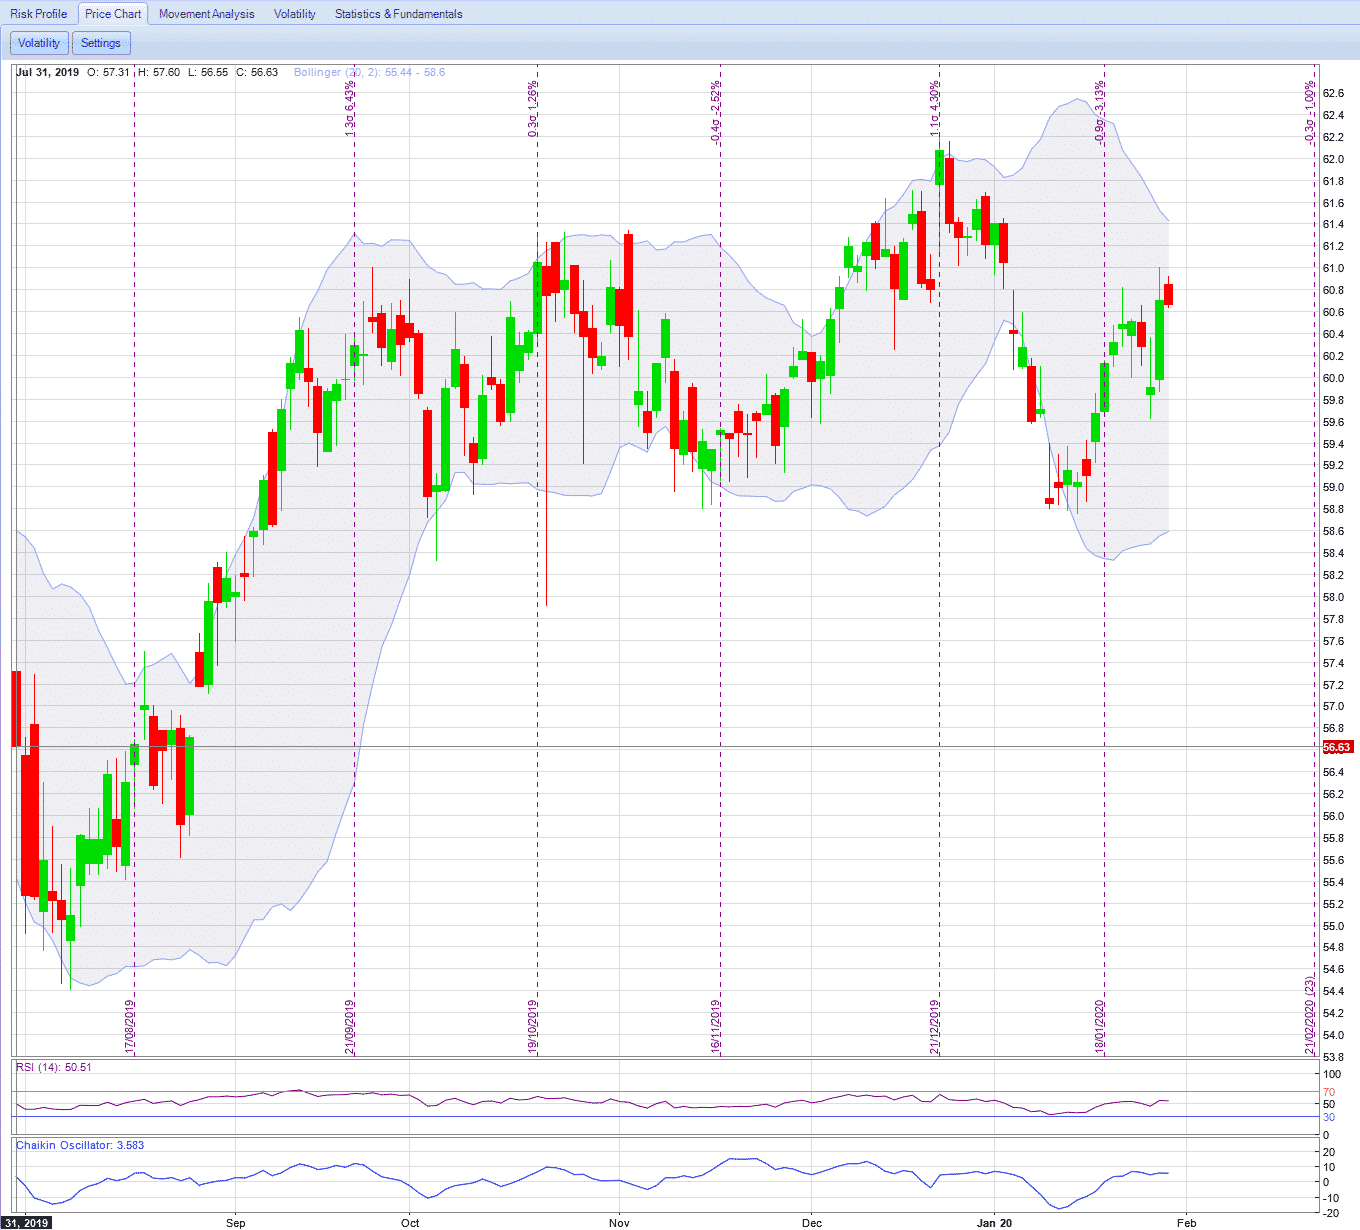
You can click on the settings button to extensively customize how the chart looks.
You can add multiple indicators to the chart, such as Bollinger Bands, moving averages, RSI, etc., with different indicators for the main screen (top of the chart) and the bottom of the chart.
These indicators can be customized as well.
For example, with Bollinger Bands, you can set your own desired Period and Ratio and with the RSI you can add a Period and Range.
Movement analysis gives you a breakdown of the movement of the underlying for a specific period of time.
The statistics & fundamental tabs gives you statistical data, dividends, events, etc.
Once you’re happy with the trade you click the “commit trade” button in the top left-hand corner.
A popup screen will appear asking you for a few details.
Type in an easy to remember name. Add a category (e.g. if it’s a butterfly, you can enter that in).
You can change the spread price if you want to get a slightly better price or use a slightly worse price to account for slippage.
Trade Comments
Finally, you can add comments to remind you why you’ve entered the trade.
While this feature is optional, it will help you when reviewing backtest results.
When you save that trade, the Option Chain will be updated so that the values you entered into the model column will move to the position column.
This indicates that the trade has taken place and you have a position.
You can confirm your position in the trade log, found next to the Commit Trade button.
In there you can see all the trades completed and tweak parts of the trade if you wish.
You can also make a copy of any trades you have completed, which can be useful if you made an adjustment and the trade didn’t work out the way you intended.
This way you just copy the trade, delete the adjustment, and see what would have happened if you made some other adjustment.
Once your trade has been committed, you’re now ready to see how the trade performed.
This backtesting is a core and important part of the software.
By clicking on the intervals in the ‘Trading Date & Time section, you can explore how the trade performed.
You can skip forwards and backward at various intervals and jump to key periods as well.
Looking at our VZ trade we can see that after 3 days the position is profitable at 1.26%.
Playback Button
To make things a little easier when backtesting, they also feature a ‘playback’ button.
This automatically moves time forward by your chosen interval amount.

A handy slider means you can speed up/slow down this automated playback.
This allows you to quickly see how the trade performed over time, or slow it down and watch the detail.
Now that we have a live trade going, a handy feature of the platform is that it displays the potential range of the stock to both 1 and 2 standard deviations.
The dark blue cone shows the 1 standard deviation potential range for the trade, while the light blue cone shows a 2 standard deviation move.
Let’s say you’re now ready to close off a trade, there are two ways you can do this.
The first is to enter the opposite number of contracts in the Model column and then Commit the Trade.
Alternatively, the software gives you a really easy and automated way to do it.
When you click on the Model column in the Option Chain, there is a handy shortcut that will automatically enter all the contracts required to close your trade (i.e. it nets out your trade).
When you click commit trade, it will close out the trade for you as a result which is very handy if you have complex positions with contracts at multiple levels.
Factoring In Commissions
As we’re on the topic of closing trades, it’s also worth mentioning a useful feature regarding commissions.
Commissions can greatly affect the viability and profitability of a strategy and influence the sort of adjustments you may want to make.
Luckily the makers of OptionNet have realized this and offer a simple way to factor this in.
When you navigate to the ‘Configuration’ tab, you can change some of the key settings for the platform.
Specifically, for commissions, you have the option of “exclude”, “include” and you can even “include round trip”.
This will then update your Profit and Loss to reflect the impact of commissions and give you a much more realistic position.
This is particularly useful for some strategies that rely on making money from collecting premiums alone.
Reporting Features
No backtesting software would be complete without automated reporting tools and OptionNet Explorer is no different.
To help with backtesting your trades there is a reporting feature that will show every single trade you’ve made or imported.
You can find the button in the top left of the screen.
When you select a new trade (in the open position section), it automatically generates a unique trade ID for you to uniquely identify that position.
This allows you to group lots of trades into a single position.
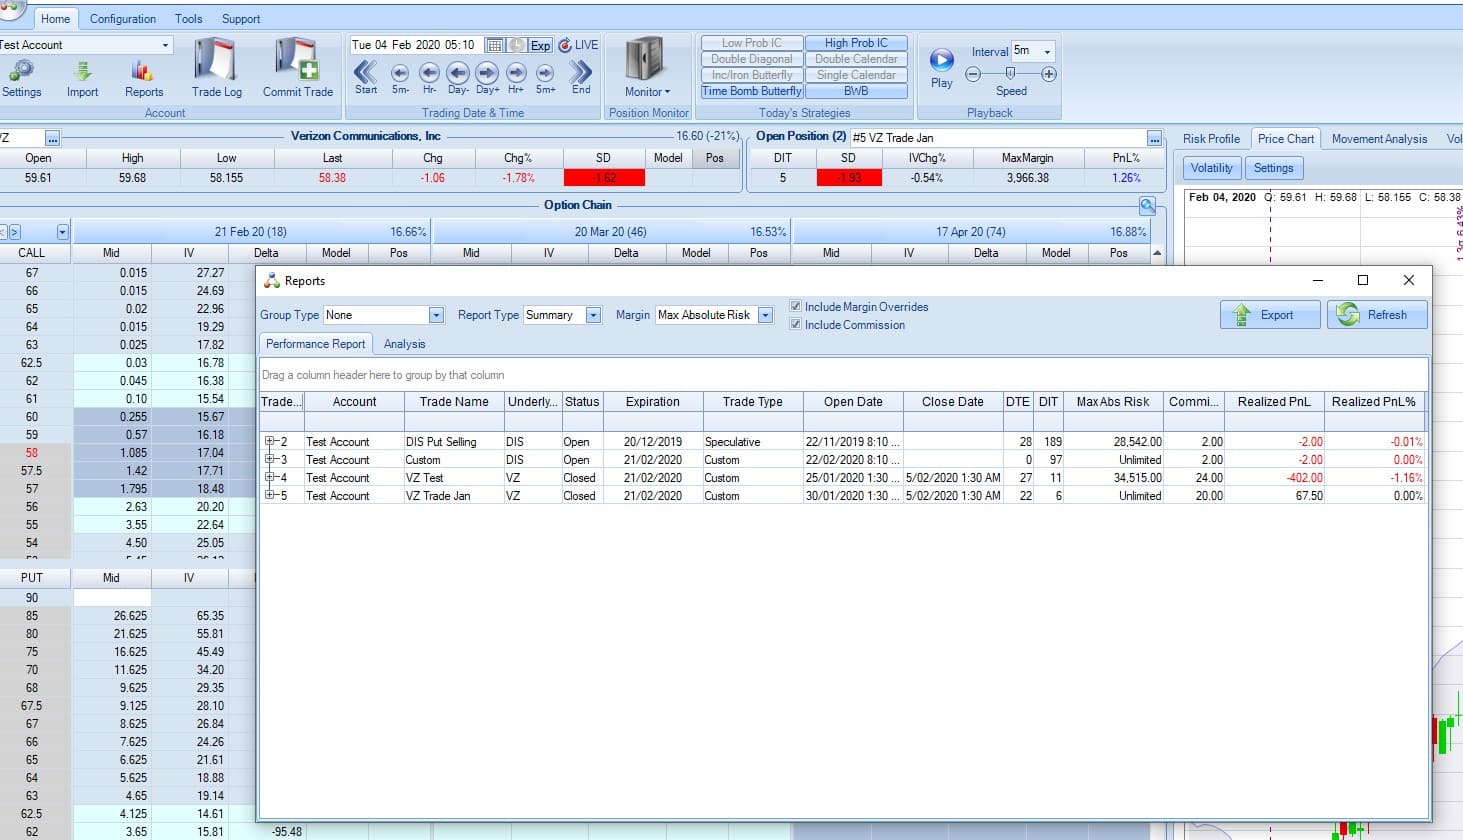
Clicking into the position, (by expanding the button) you can see a table with all the trades that made up the life of that position.
The system will automatically match up all opens with closes.
However, if you would rather see each individual trade, you can select “detail” from the report type dropdown.
The tool allows you to export the trades to Excel or a CSV.
You can group trades in different ways to make it easier to view and analyze your performance.
For example, you can do it by underlying by dragging a column to the area above the columns.
It will group everything for you automatically.

Simply dragging it back down again will clear the grouping.
The platform comes with its own preset groupings, which can be accessed via the “Group Type” dropdown box (e.g. Days To Expiration).
Here you also have the option to create your own custom grouping.
You can also filter trades, by clicking the filter button next to the column name.
One useful and powerful filter is the ability to add a custom filter based on an expression.
For example, you might want to only look at positions that were trading at the SPX and were profitable.
Filtering
To filter this way, in the custom filter expression box you would enter:
Underlying = “SPX” and PnL > 0.
The system will then filter out any trade that doesn’t meet that criteria.
To see the results of your trades, click into the analysis tab of the reports section.
Here it will show you statistics related to your performance, such as the number of winners and losers, average gain and loss in both $ and % terms, maximum drawdown, and many others.
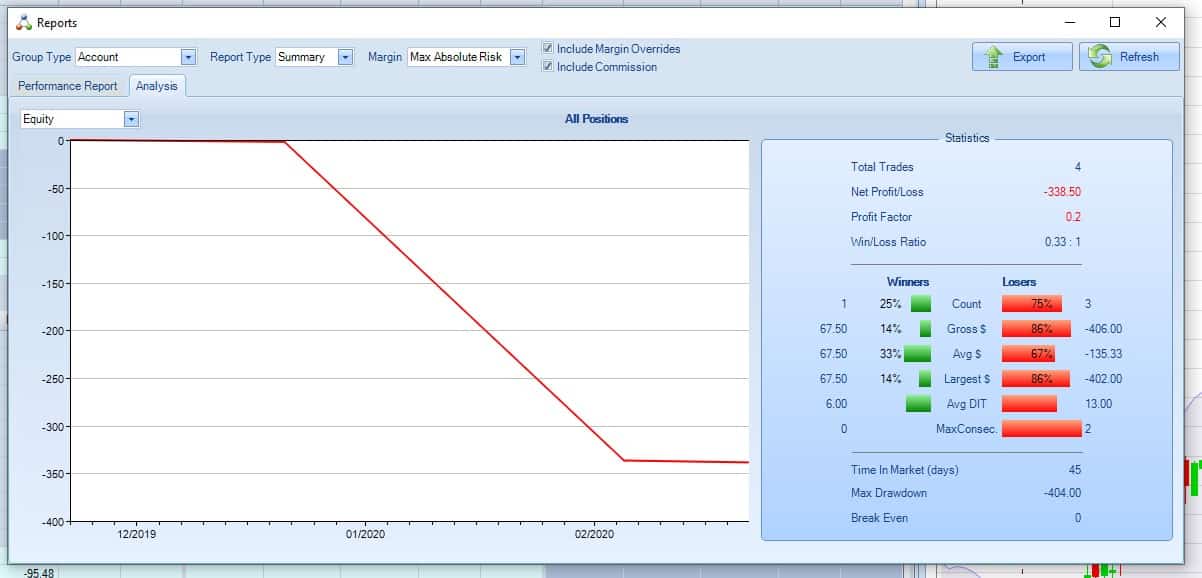
We can see that unfortunately, the performance of this particular trading strategy has been very poor.
But this is precisely what the platform is designed for, to safely backtest strategies and weed out the bad ones before deciding to commit real money.
Broker Interfaces
The broker interfaces are the second key function of the platform and there are several things you can do, depending on the broker you’re with.
If you’ve already executed some trades with your broker and would like to add the information into the platform, there’s a simple to use import function that supports multiple formats such as thinkorswim, OptionsXpress, and Interactive Brokers.
If you have a live funded account with one of your brokers, you’ll be able to draw live data from those broker accounts without paying additional fees for data.
This includes both underlying data and options pricing, providing of course that you have sufficient live data privileges with your broker.
To use the live data, you navigate to the Trading Date & Time section and then select the “LIVE” button.
Once you click that button, it will allow you to create and enter positions in real-time.
You can then commit the trade to the OptionNet database by pressing the Commit Trade button.
With the trade stored inside the program, and therefore treated only as a ‘paper trade’ for your analysis.
Sending Orders To Your Broker
Alternatively, when saving the trade you can press the “Send Order to Broker” button in the Commit Trade section to have the order sent to your broker for immediate execution in the market.
Once the trade is sent for execution, a copy is stored in OptionNet so you can continue to track it and make adjustments.
Note that for some brokers, they can’t share updates with OptionNet, so you may be required to make adjustments on the broker’s platform and then manually add those into OptionNet.
The final key feature is the Position Monitor which allows you to track multiple trades across multiple underlings and accounts.
Clicking on either the Grid or the Dock will show you all open positions updated live so you can keep track of your position performance.
The Grid will show you in tabular, data form while the dock shows you a chart of each trade.
Loading Broker Data
Another handy tool within OptionNetExplorer is the import tool which allows you to import trades from thinkorswim, Interactive Brokers, OptionsXpress and TastyWorks.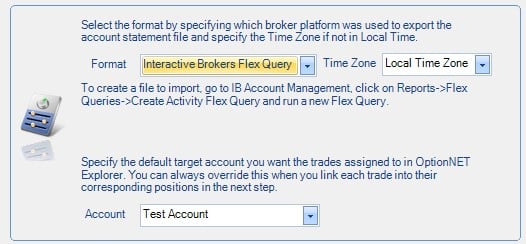
FAQ
What Is OptionNET Explorer?
OptionNET Explorer is a comprehensive options trading software that provides traders with powerful tools to analyze, trade and manage options strategies.
It offers a wide range of features such as real-time data, options chain analysis, probability analysis, options backtesting, and more.
What Are The Key Features Of OptionNET Explorer?
OptionNET Explorer comes with a rich set of features including real-time data, options chain analysis, probability analysis, options backtesting, risk management tools, and more.
Its key features include advanced charting capabilities, strategy optimization, portfolio analysis, and options pricing models.
Is OptionNET Explorer Suitable For Beginners?
Explorer is a powerful tool that is suitable for both beginner and experienced options traders.
It provides a user-friendly interface and comprehensive educational resources to help beginners get started with options trading.
Is OptionNET Explorer Free?
OptionNET Explorer offers a 7-day free trial for new users.
After the trial period, users need to subscribe to a paid plan to continue using the software.
What Are The Pricing Plans For OptionNET Explorer?
OptionNET Explorer offers three pricing plans – Basic, Pro, and Pro Plus.
The Basic plan costs $59/month, the Pro plan costs $129/month, and the Pro Plus plan costs $249/month. Each plan offers different features and benefits depending on the user’s needs.
Is OptionNET Explorer Worth The Price?
OptionNET Explorer is a comprehensive options trading software that offers a wide range of features to help traders analyze, trade and manage options strategies.
Its pricing plans are competitively priced compared to other options trading software in the market. Whether the software is worth the price depends on the user’s needs and budget.
What Are The System Requirements To Run OptionNET Explorer?
OptionNET Explorer is a desktop-based software that runs on Windows operating system.
The software requires a minimum of 4GB RAM, 500MB free disk space, and a modern processor with multi-core support.
Conclusion
OptionNet Explorer provides option traders with an easy to use system for backtesting, designing and monitoring different strategies.
With easy import functionality, extensive reporting, and access to free data, it’s a valuable tool for any options trader seeking to trade regularly and increase their profitability.
Trade safe!
Disclaimer: The information above is for educational purposes only and should not be treated as investment advice. The strategy presented would not be suitable for investors who are not familiar with exchange traded options. Any readers interested in this strategy should do their own research and seek advice from a licensed financial adviser.

* Advertising disclosure: All opinions expressed are our own. We may receive compensation from some of our partner brands in this article. However, we only promote brands we trust and have personally used.


Hi Gavin,
I’m using IB in Canada, and it’s a slow and sluggish platform to build / explore option structures – although IB is feature rich with many options and ability to trigger trades etc., it cannot track the full cost basis of option campaigns (i.e. Wheels, ICs,Calendar Spreads with adjustments) – additionally multi-leg combos are grouped together at first until adjustments (and then they no longer remain as a combo – which I heard is due to FX conversion reasons and reporting in another local currency).
Currently, I am primarily exploring various option strategies from 1 leg (simply long put, long calls for directional) to Wheeling and Short Strangles, Iron Condors, Double Diagonals etc.
Will this platform assist with managing option strategies, build option plays and understanding their behavior with manual back test and walk forward, simulate (like in ToS i heard), show actual campaign P&Ls, and stats to show what’s working and what’s not? Also, would you recommend executing trades through it to IB? I believe live option data feed can be pulled from IB as well?
Also, I read from your articles that it’s important to learn IB Risk Navigator which shows VAR, Delta Dollars, Portfolio Delta, all the risks associated with Greeks across the portfolio holdings and grouping positions by Underlying (which is what I typically do even if there are multiple campaigns within), does OptionNetExplorer offer Risk management like this and perhaps have even better implementation?
Also, do you use the automated back testing feature – and if so, is it beneficial to automate back test strategies on different underlyings / futures, spreads?
Any other tools that are recommended? I only have IB Canada (Canada market does not have tastyworks or Tos)
Do you have an affiliate link with OptionNetExplorer?
Thanks
Felix
I have the same issue with IB, and have to trade adjusted trades in Excel or Option Net Explorer.
I’ve never tried executing trades from ONE to IB so can’t comment there, but it’s worth looking in to, let me know if you have any success with it, I would be interested to hear.
OptionNet Explorer has all the greeks, but won’t show Delta Dollars and you also can’t add shares to hedge, only options. So I use a combination of IB and ONE. I should create my own software that does everything I need….
I don’t use automated backtesting, I usually walk through trades manually. CMLViz is good for automated backtesting of different ideas:
https://optionstradingiq.com/i-missed-the-boat-big-time-on-this-trade/#Second_Point_Header
For ONE – the link in this article will get you a 1-month trial for 1 GBP.
hi Gavin,
Is the discount link still valid?
Will the same discount applies once the subscription expires? thanks.
Yes and yes.
Hi there Gavin,
I think the refereral link only works for one year. After one year sub. It goes back to normal price?
Sorry for the delay, still trying to get an answer from ONE on this.
Hi Tim, here is the response from ONE – “Discounts are always offered at our discretion but generally they will apply to each renewal providing the customer maintains their subscription and adheres to our terms.”
Hi Gavin,
Thx alot for the detailed steps. Always loved your articles. On the Option net, i am not able to see an option to send to TOS. Even though i click on ThinkOrswim button on the commit trade. Do i need to setup this seperately? or is there any place where i need to link my TOS account to my onenet acc.
Can you help me with this.
Thank You,
Nag
You should just be able to go to the configuration tab and change the live feed to thinkorswim. I can’t remember where to get the host address and Port number from though.
Thanks Gavin. I did the same by setting the live feed to TOS on config, but i dont see the trade reflecting back on TOS app.
Thanks again for quick response,
Nag
Gavin,
Does software support commodity options?
Thanks,
If you give me some examples, I can check for you.
Gavin,
Does this support back testing for 0 DTE trades?
Bruce
Yes.
I can structure my trades on ONE but they are not going through to my TOS account. Can someone help me to link my ONE and TOS account so that my trades go through directly?
Have you set up the live feed under Configuration?
So, after send a Butterfly to broker (hoping it will be executed), I need to update positions on ONE manually?
I believe you can link you broker and ONE as long as you are using ToS, Interactive Brokers or Trade Station.