


With volatility picking up significantly so far in 2020, I thought it would be great to look at a couple of VIX trading strategies.
First, let’s learn a bit about the VIX before we dive into the trading strategies.
Contents
- What Is The VIX?
- How Does The VIX Work?
- How is The VIX Calculated?
- What Does The VIX Tell Us About The Market?
- VIX Trading Strategies
- Conclusion
What Is The VIX?
The VIX is the shorthand name for the Chicago Board of Exchange’s Volatility Index.
Another popular name that’s often used in the media is the “fear index.”
The VIX is frequently looked to by investors as a gauge of the level of fear and uncertainty in the market.
The VIX also makes volatility tradeable through related derivative products.
Initially, this had to be done through a futures contract.
However, now there is a wide variety of tradeable volatility products including inverse and leveraged exchange-traded products.
Though not tradeable directly, the CBOE also publishes the VVIX, which measures the volatility of volatility!
How Does The VIX Work?
The VIX measures the volatility in the market by analyzing the prices of options of the S&P 500.
The Index aims to measure the implied volatility of options expiring in 30 days for ticker SPX.
It’s important to note that the VIX uses European Options, not U.S. options.
In-The-Money European-style options are not executable before expiration.
Useful in calculating implied volatility and a frequently noted limitation of the Black-Scholes pricing model, using European-style options will yield a close approximation to reality on U.S. exchanges rather than a precise one.
The VIX is updated in real-time during normal trading hours.
Another concept to be aware of if you are trading volatility products is that since they are all tied to VIX futures contracts there will be roll yield effects.
The user @VixCentral on Twitter publishes daily updates on VIX futures contango or backwardation as well as impacts on tradeable derivatives.
How Is The VIX Calculated?
The calculation for the Volatility index looks complicated but is quite simple once you have all the variables.
The most difficult part is gathering all the information to be plugged into the formula.
The CBOE published a white paper that goes into great detail on the calculation.
Anyone can perform the calculation in a spreadsheet if you’re able to download SPX option chains in the correct format.
The options selected are standard and weekly options that expire in 23 and 37 days.
The goal here is to have a final product that reflects volatility 30 days out.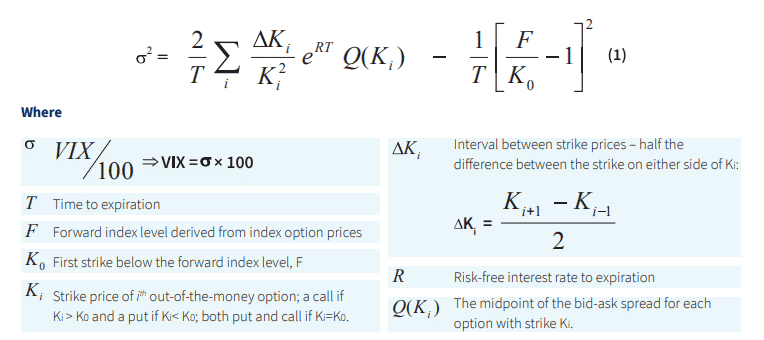 The CBOE also points out that “as volatility rises and falls, the strike price range of options with non-zero bids tends to expand and contract.
As a result, the number of options used in the VIX Index calculation may vary from month-to-month, day-to-day and possibly, even minute-to-minute.”
The CBOE has a filtering algorithm in place for times when the non-zero price requirement might distort the big picture.
“This can result in a VIX Index value that, while accurately reflecting SPX option quotes at the time, may not reflect the expected volatility of the S&P 500 Index.”
The only other term that might need to be defined here is the risk-free rate.
The risk-free interest rate is simply the rate that an investor would receive on a hypothetically risk-free investment.
The risk-free rate is used for options pricing and volatility calculations as a proxy for either the opportunity cost of a safer investment or the potential interest expense of margin (though the risk-free rate will often understate this cost).
What Does The VIX Tell Us About The Market?
The VIX tells us about the level of uncertainty in the financial exchanges.
In general, the higher the VIX, the worse the market is doing.
Though this observation depends largely on the timeframe being examined.
In a bear market rally, the VIX might remain elevated even though the daily charts are green.
A VIX under 20 is generally considered stable.
Over 30 is quite elevated and tells us that fear and volatility are present.
At the time of writing, the VIX is just under 29 which is historically very high.
It’s come down quite a bit from the levels we saw several weeks ago–it peaked at 66.
During the Financial Crisis, it peaked at 79.
What’s interesting this time is the strength of the recovery in SPX despite the elevated VIX.
SPX vs VIX Chart
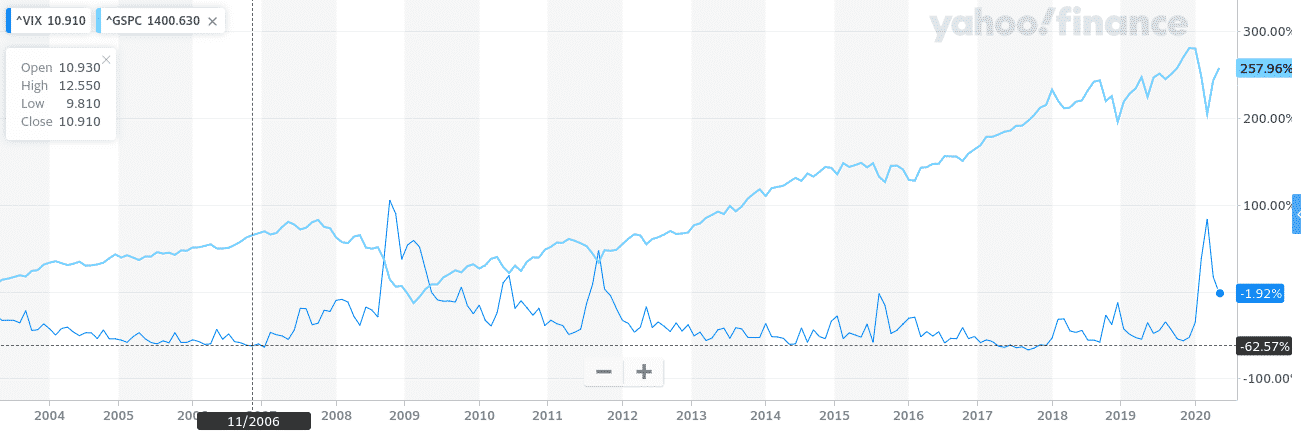 In 2008 the VIX returned to normal levels within a few months, as one would expect.
Above is a comparison chart of the VIX and the S&P 500.However, the recovery in asset prices took much longer to recover to pre-crisis levels.
The moves are much more dramatic than 2008 so that should be considered before reading too much into it.
But it’s impossible to ignore the fact the bulk of the recovery in stock prices has occurred with a massively elevated Volatility Index.
By the time the VIX settled under 30 in May 2009, the S&P 500 had just bottomed and would need another 4 years to return pre-crisis levels.
Now, we are almost 70% recovered after two months with most of that recovery taking place with a severely elevated VIX.
It’s for this reason, among others, that you’ll see many analysts, commentators, and investors saying that they “don’t buy” this recovery.
Certainly, as an investor or trader, it would have been a shame to have missed this rally–but the VIX is telling us that we should be cautious at a minimum.
VIX Trading Strategies
Now that you know a bit about the VIX and how to use it, let dive in to some ways to trade it.
The first strategy is a butterfly trade which can be used as a portfolio protection measure for the July expiration.
Buying a 30-40-50 butterfly for the July expiration gives a profit zone between 32 and 48. The VIX has very rarely closed above 50 so I like this idea to give some protection to a portfolio of stocks.
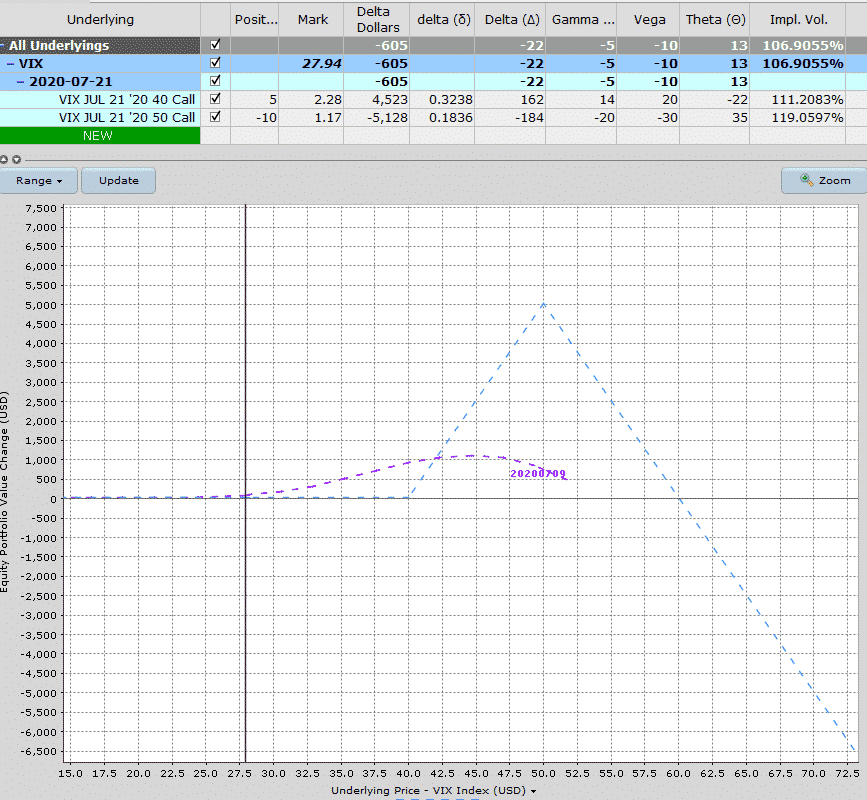
The risk with the trade is if VIX rallies sharply and shoots right through the upper breakeven point.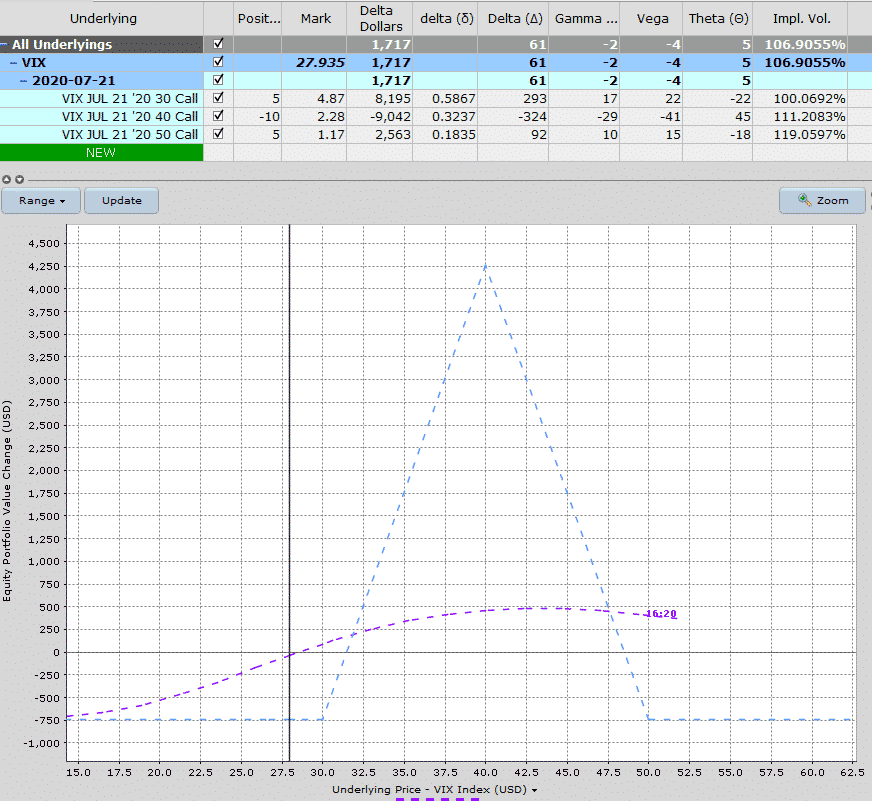 The next strategy is a ratio spread where we buy 5 of the July $40 calls and sell 10 of the $50 calls.
This trade has zero risk for a VIX reading 40 and below so there is no loss if VIX continues dropping.
The profit zone is between 40 and 60 which gives a nice wide zone with the ideal scenario being a VIX close at 50 on July 17th.
The risk again is a big rally in the VIX which sees the index fly right through 60. As the strategy involved naked calls the risk is unlimited on the upside.
VIX Ratio Spread
 The third strategy is to sell put spread to fund the purchase of long calls. In this case we have zero risk (small potential profit to cover slippage and commissions) between 25 and 50 and then huge upside potential above 50.
The risk in the trade is a VIX reading below 25 with the maximum loss occurring at 20 and below.
However, if this strategy is protecting a portfolio of long stocks, you don’t mind VIX dropping because usually that means stocks are in rally mode.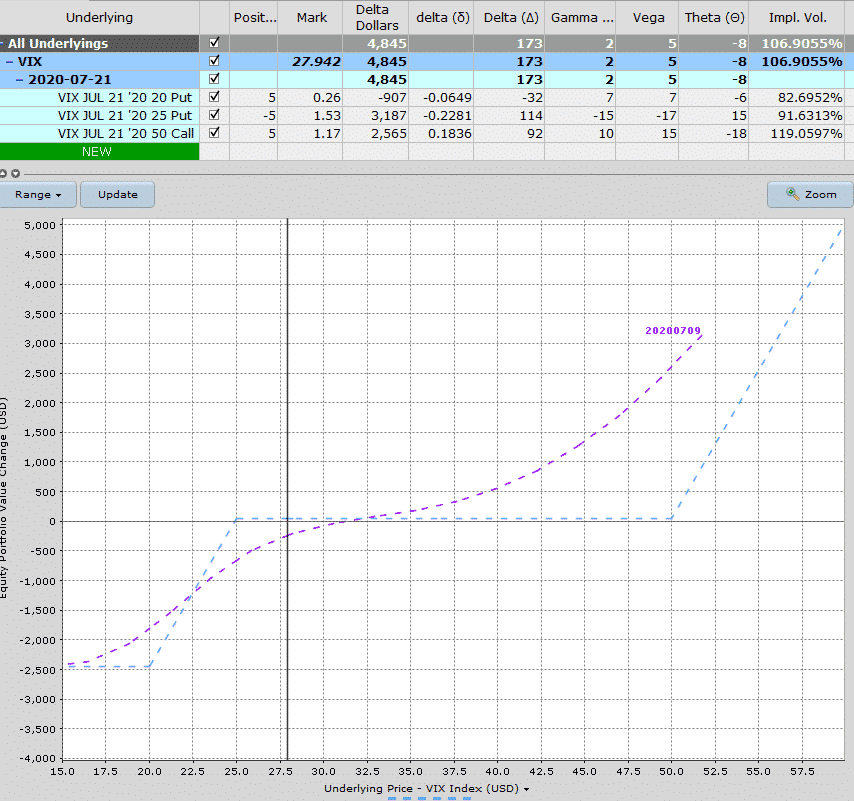 While these 3 trades varied in structure, risk and profit potential hopefully this gives you some ideas on various vix trading strategies that are available.
Traders can use these as protection methods for a larger portfolio of as stand-alone strategies.
When using them to protect a portfolio, try to keep risk below 2-3% of the portfolio value.
Conclusion
In this article you have learnt what the VIX is, how it works and how it’s calculated.
We then looked at three different trading strategies using vix with varying degrees of risk and reward.
Using VIX options can be a handy way to protect against adverse market moves.
Trade safe!
Disclaimer: The information above is for educational purposes only and should not be treated as investment advice. The strategy presented would not be suitable for investors who are not familiar with exchange traded options. Any readers interested in this strategy should do their own research and seek advice from a licensed financial adviser.


