


Today, we’re looking at a MACD Crossover Strategy.
We will show you how to set up the strategy and evaluate whether it is better than a simple moving average crossover strategy.
Contents
Introduction
The Moving Average Convergence Divergence indicator is one of the more popular indicators for traders to use to inform them of the price direction of a stock or asset.
There are a few different ways in which people use the indicator. Today, we will look at the MACD crossover strategy.
First, let’s explain all the moving parts of the indicator.
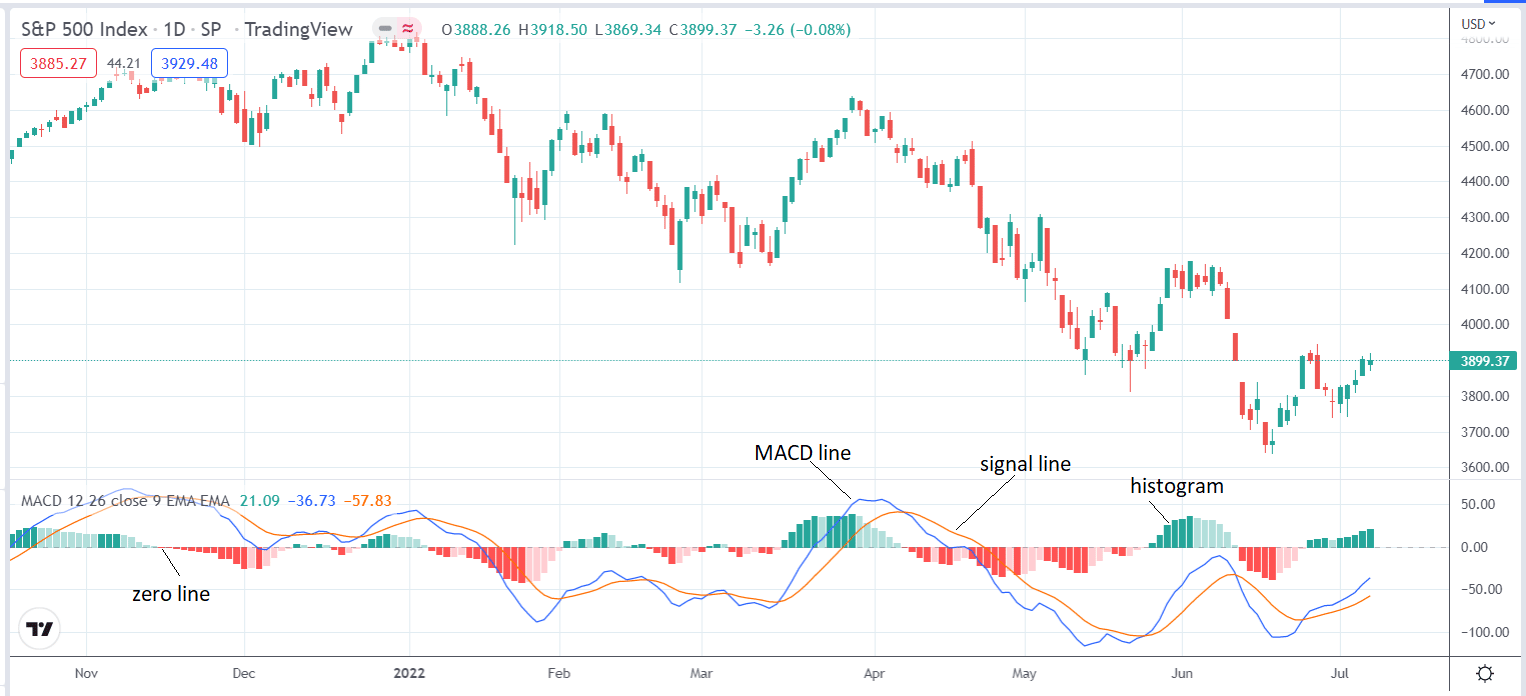
Here we see the MACD plotted in the bottom panel of TradingView for the assets SPX (S&P 500 index).
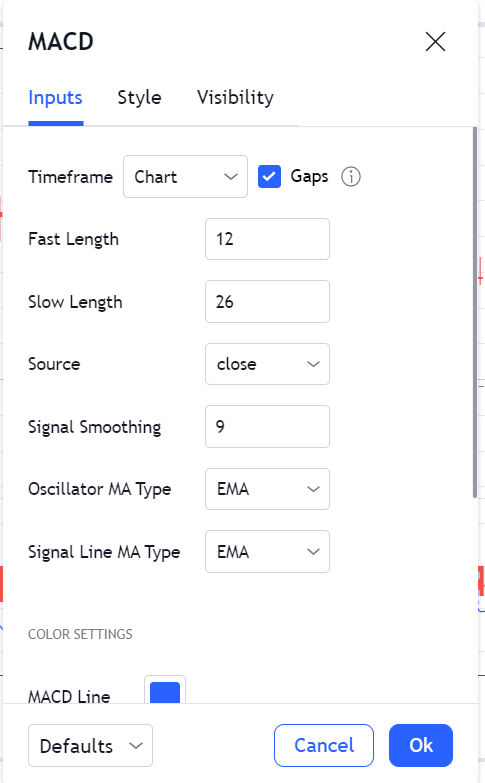
The default settings of the indicator are rarely changed. The settings are.
The MACD blue line is calculated by subtracting the 26-period exponential moving average (EMA) from the 12-period EMA.
This means that the MACD line is above the zero line whenever the shorter-term fast-moving average (12 EMA) is above the longer-term slow-moving average (26 EMA).
This condition indicates that the price action of the asset is bullish.
The orange signal line is the 9-period exponential moving average of the MACD line.
The signal line is the result of smoothing out the MACD line.
Now that we know what all the lines are, how do we know when to buy or sell?
The buy signal is when the MACD crosses above the signal line.
Going forward, we will call this the “bullish signal” instead of the “buy signal.”
You can not “buy” shares of SPX. But you can apply bullish and bearish options strategies on SPX.
If you want to buy or sell shares, you can use ETFs.
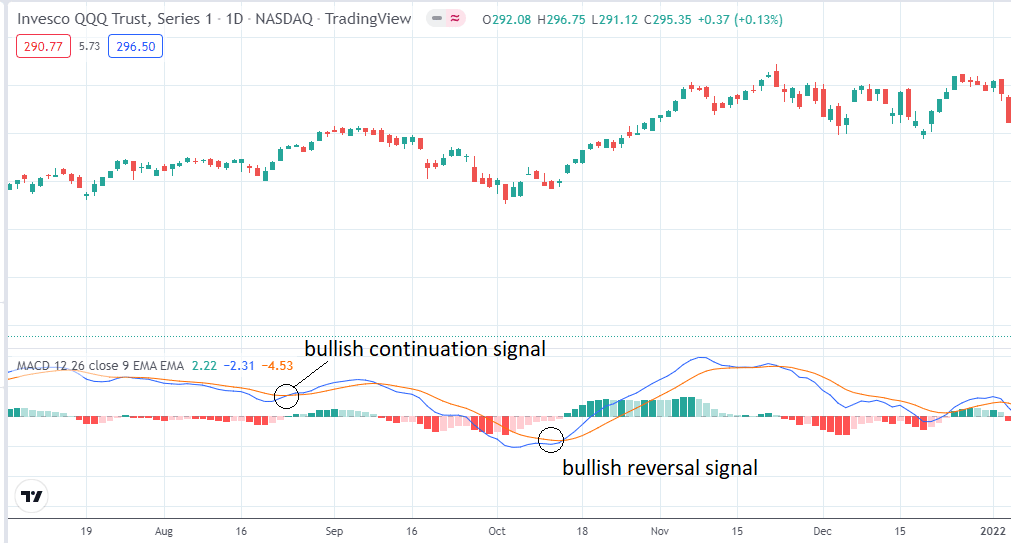
Here we see bullish signals on the QQQ (Nasdaq ETF).
Above Or Below The Zero Line?
These signals can happen above or below the zero line.
When they occur above the signal line, we further sub-classify these as bullish continuation signals since they happen when the stock is already bullish.
We say they are bullish reversal signals when they occur below the signal line.
These usually happen after a bear trend is reversing again.
Here we see bearish signals on the RUT (Russell 2000 index) whenever the MACD blue line crosses below the orange signal line.
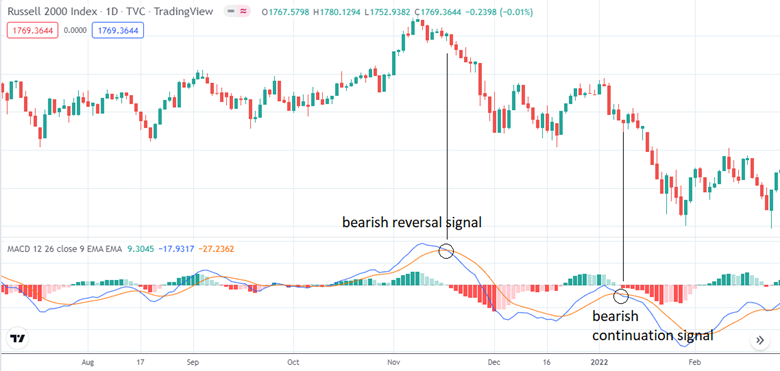
This time, the bearish reversal signals happen above the signal line. We call them this because the bearish signal happens when the asset is bullish.
You can see from the candlesticks that the bearish continuation signal occurs when the asset is already bearish.
Some traders like to take only the reversal type signals.
But these come few and far between, so other traders like to take both reversal and continuation signals.
If you don’t care if the crossover is above or below the zero line, then there is no need to be cross-eyed trying to untangle which line is crossing.
Just look at the histogram.
When the histogram is plotted below the zero line, it is colored red.
When it is above the zero line, it is colored green.
Red means that the price is generally going down.
Green means going up.
The bullish signals all occur when the histogram transitions from red to green.
The bearish signals occur when the histogram transitions from green to red.
The longer the histogram length, the greater the distance of the MACD line from the signal line.
When the histogram’s length gets shorter, it means a transition crossing is coming.
Using A Filter
Using the MACD indicator alone by itself may not be good enough.
Many traders filter the signals to buy (or be bullish) only when the dominant trend is upwards.
And to sell (or be bearish) only when the dominant trend is down. In other words, they only trade with the dominant trend.
They ignore signals that go against the dominant trend. So they ignore a bullish MACD signal if the dominant trend is down.
They ignore a bearish MACD signal if the dominant trend is up.
How they determine the dominant trend is their preference. Some do it by looking at price action.
Others will use another indicator. Plotting the 200-day moving average on the candlesticks is very common.
They say the dominant trend is up if the candles are above the 200-day moving average. And vice versa.
Shorter-term traders might use the 50-period or the 20-period moving averages instead.
Here is the 50-day moving average plotted on Microsoft.
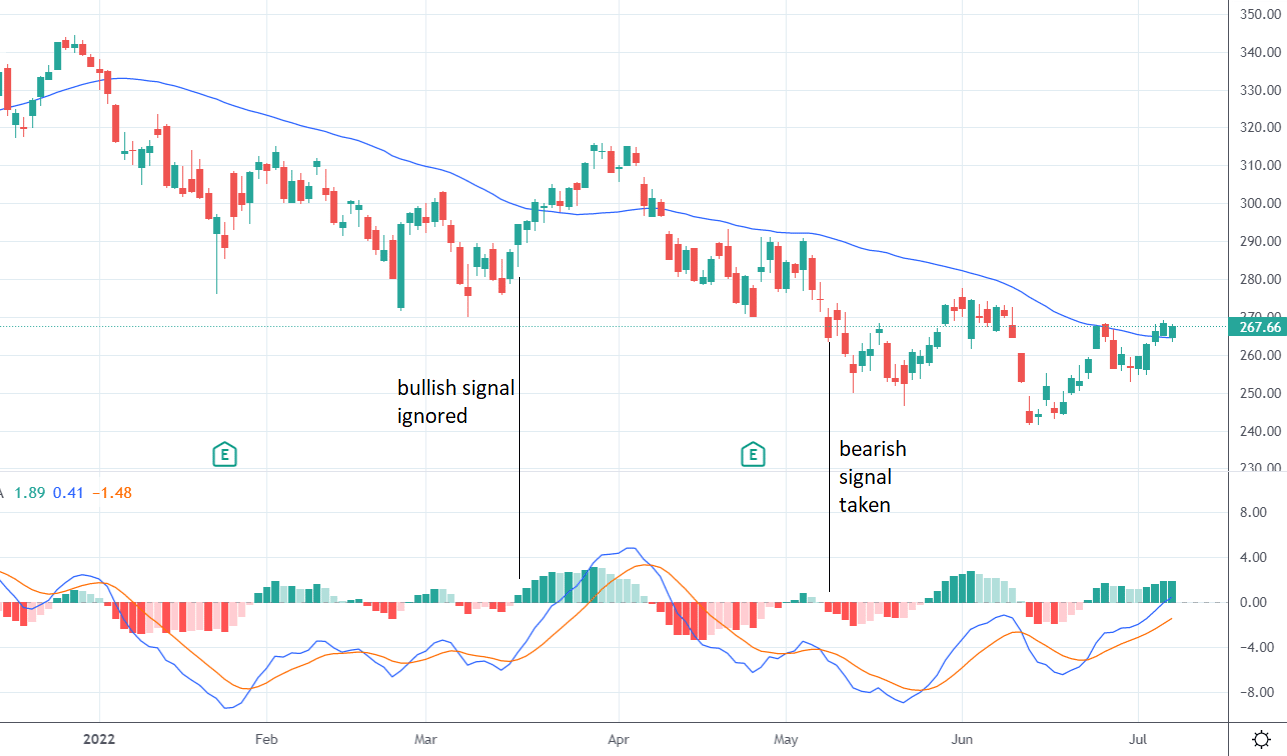
Depending on whether the price is above or below this 50-period moving, certain MACD cross-overs are ignored.
FAQs
Is the MACD crossover strategy better than the moving average crossover strategy?
The MACD crossover strategy is better because it gives earlier signals than the moving average crossover.
The moving average crossover strategy lags and often gives signals too late.
The MACD crossover strategy improves the concept and tends to give earlier signals.
You can see the two signals when we add the 26-period and 12-period exponential moving averages to the candlestick chart of Microsoft.
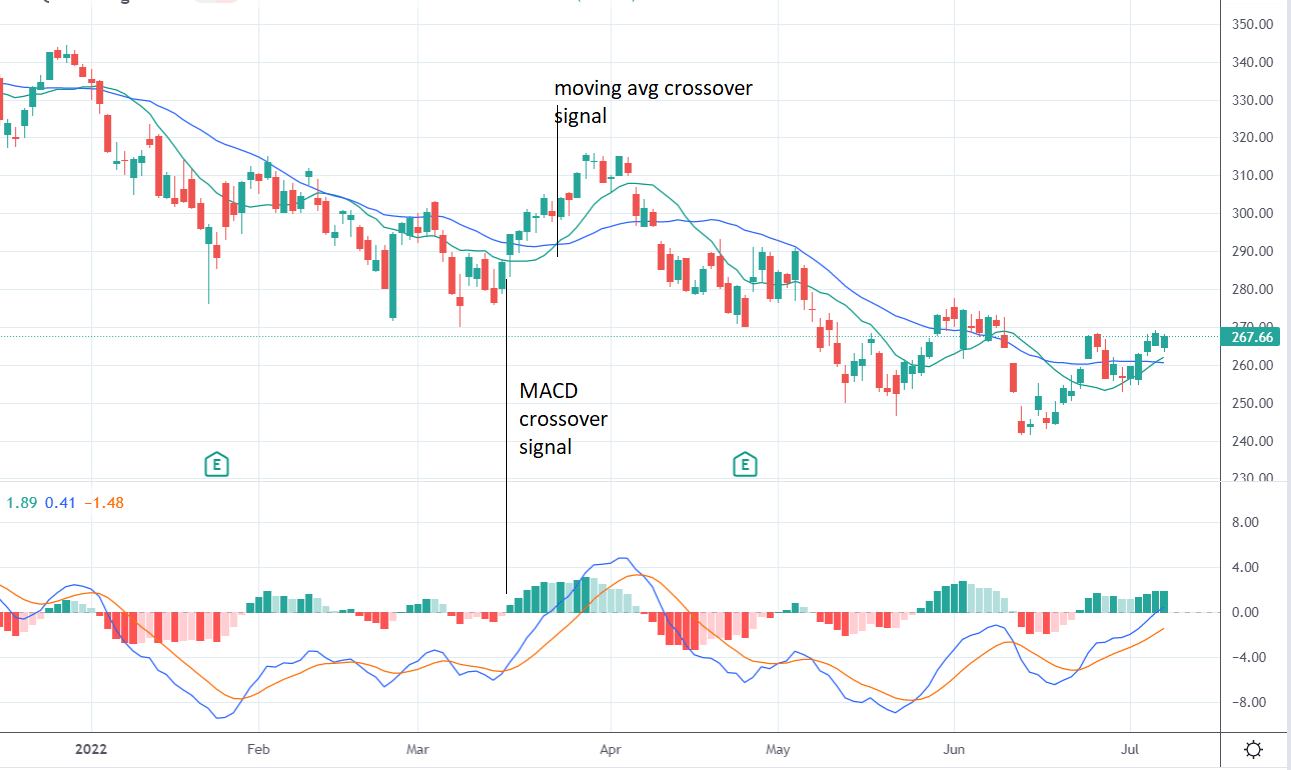
Note how the MACD crossover is triggered before the moving average crossover.
What timeframe does the MACD work on?
It works on all timeframes, from intraday charts to monthly charts.
Does the MACD work on futures?
Yes, it works on futures, Forex, and equities — anything that has liquid price movement.
Does the MACD crossover strategy work?
Yes, the MACD crossover strategy can be a viable strategy if you get the right combination of trigger conditions and take-profit and exit rules in place.
In another article, we have shown a MACD crossover strategy used with credit spreads.
The limited back-test of the strategy gave favorable results.
Conclusion
The MACD may seem complicated at first, and that’s why some people stay with moving average crossovers.
But once you get used to it, you might find it superior.
The foundational concept is that two moving averages (such as the 12 and 26-period) will diverge and then converge.
The histogram indicates the amount of divergence.
When the histogram is at its extreme (such as the high point), it will come back down, indicating that the two moving averages are converging.
When the histogram is at zero, that is when the two moving average line crosses.
Another key is to use it in conjunction with some other technical analysis so that you can filter out some of its signals to capture its best signals.
We hope you enjoyed this article on the MACD Crossover Strategy. If you have any questions, please send an email, or leave a comment below.
Trade safe!
Disclaimer: The information above is for educational purposes only and should not be treated as investment advice. The strategy presented would not be suitable for investors who are not familiar with exchange traded options. Any readers interested in this strategy should do their own research and seek advice from a licensed financial adviser.


there are error in the pictures when show the bearish signal on the RUT. The picture is still the Invesco QQQ
Thanks matteo. Fixed now.