


Make sure to download the RSI Divergence Cheat Sheet below and keep it handy as a reference guide.
Contents
- Introduction
- Bullish Diversion
- Bearish Diversion
- Examples
- Failed Example
- RSI Divergence Trading Strategies
- FAQ
Introduction
RSI divergence is a technical indicator when there is a reversion in the Relative Strength Index (RSI) before the reversal in price occurs.
In other words, the RSI indicator and prices are moving in opposite directions.
We consider the general trend for the diversion and look at the low and high points on both the indicator and price.
RSI divergence is a reversal pattern and can be bullish or bearish, indicating the price move after the pattern.
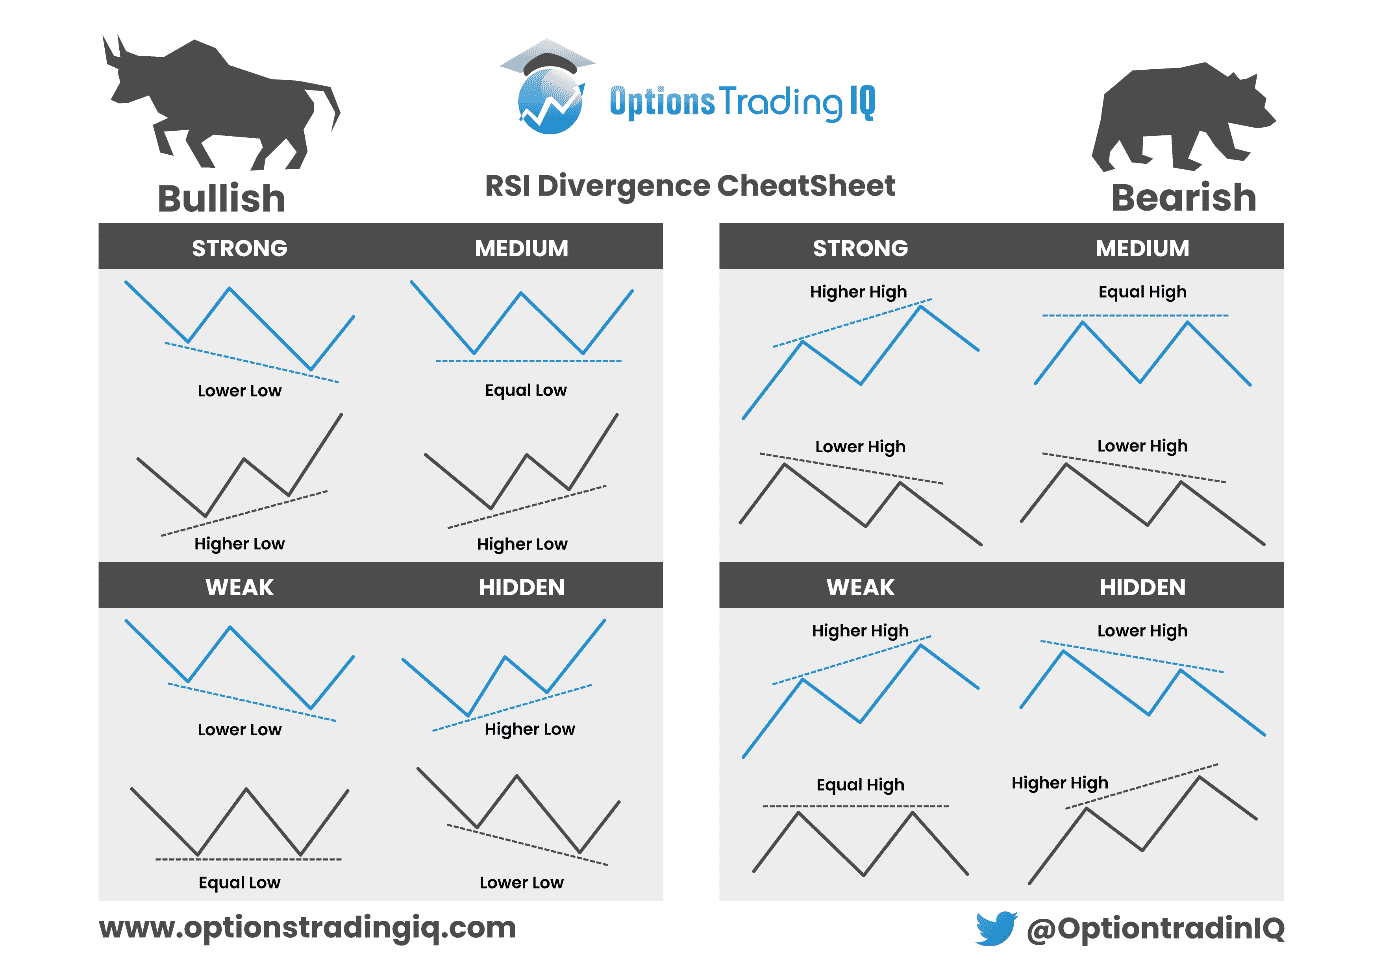
An RSI divergence cheat sheet is a handy tool to help you identify common divergences.
It consists of three types of bullish and bearish patterns based on the intensity of the divergence and one kind of divergence hidden for both bull and bear trends.
If you are a novice trader, you should always keep this sheet near you to help in the proper identification of the patterns.
Bullish Diversion
The first thing to consider for a bullish diversion pattern is that you need to look at the lower points of the price and the indicator.
Bullish diversion has three levels of intensity:
- Strong – Price makes a lower low, while RSI displays a higher low.
- Medium – Price makes an equal low, while RSI displays a higher low.
- Weak – Price makes a lower low, while RSI shows an equal low.
The hidden bullish diversion is slightly different, with the prices in uptrend making higher lows and the RSI indicator making lower lows.
At OTIQ, we ignore this type of divergence.
Bearish Diversion
Bearish divergence also demonstrates three levels of intensity:
- Strong – Price makes a higher high, while RSI exhibits a lower high.
- Medium – Price makes an equal high, while RSI exhibits a lower high.
- Weak – Price makes a higher high, while RSI shows an equal high.
The hidden bearish diversion occurs when the price makes lower highs, and the RSI indicator makes higher highs.
We also ignore hidden bearish RSI divergence.
Examples
Let’s look at some examples.
The line at the bottom is the RSI trend for 14 days.
The line above the RSI is the price trend.
For today, we are concerned only with these two lines.
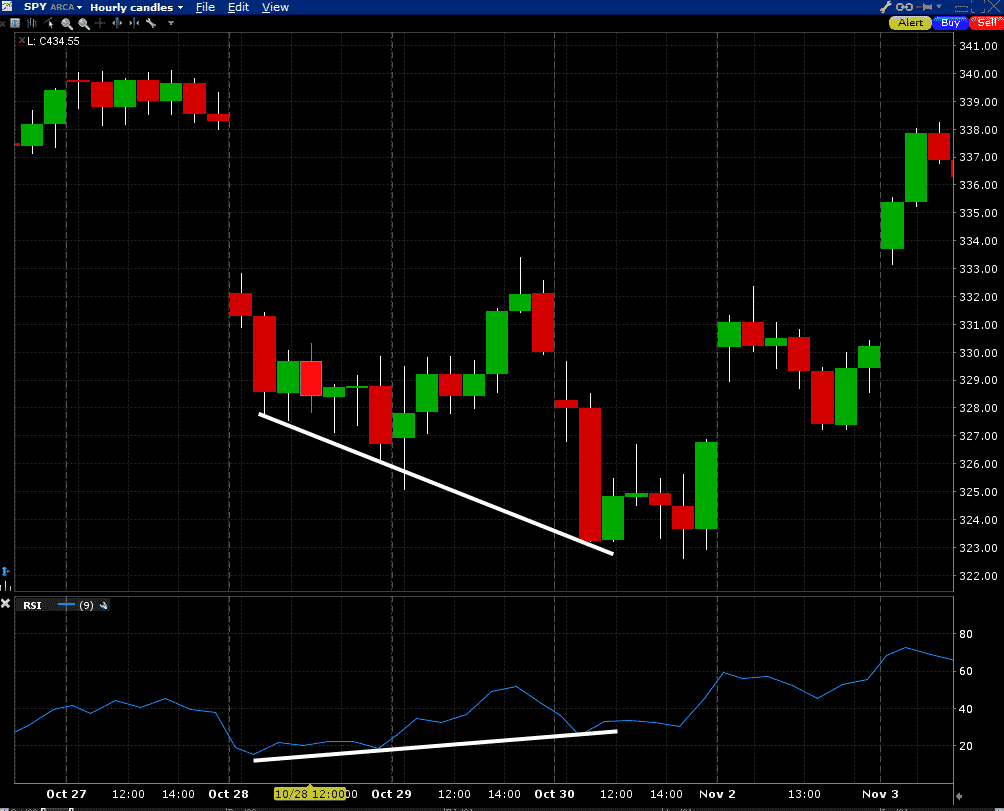
Here we have the S&P 500 prices in the above chart.
Between October 26th and November 9th, 2020, price is making lower lows, whereas the RSI index is making higher lows.
The price trend reverses after this, and the index rises in value.
This can be taken as an example of a strong bullish pattern.
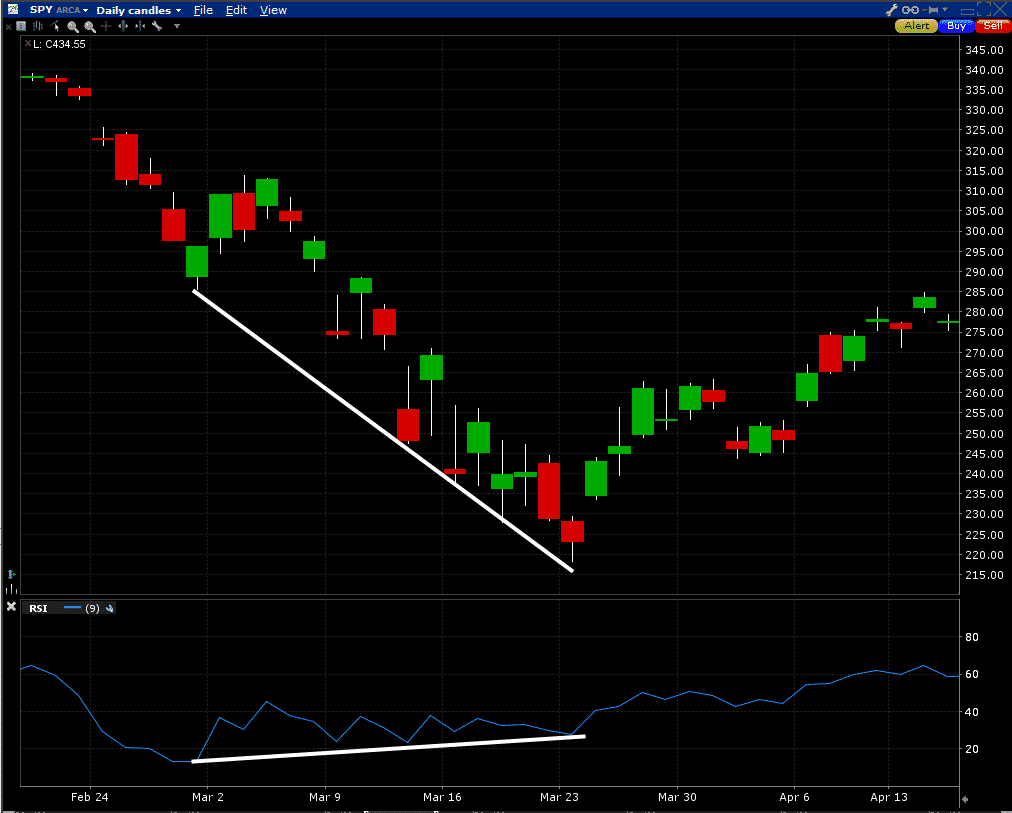
In the above chart, from the start of March 2020 to around March 23rd, price is making lower lows and the RSI indicator is making higher lows.
This is another example of a strong bullish pattern, and the prices rise after this.
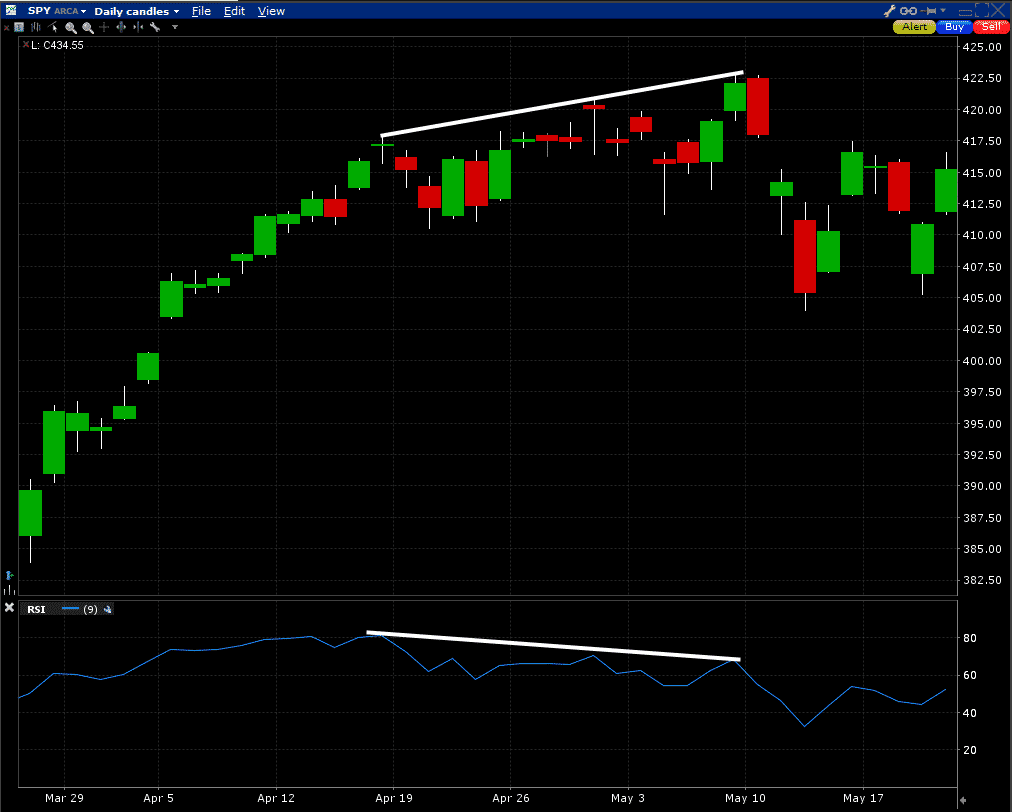
On April 29th and May 7th, the two price peaks the RSI indicator can be observed.
SPY makes three higher peaks, while RSI is trending lower.
This is an example of a medium to strong bearish pattern, and the prices fall drastically after that.
Failed Example
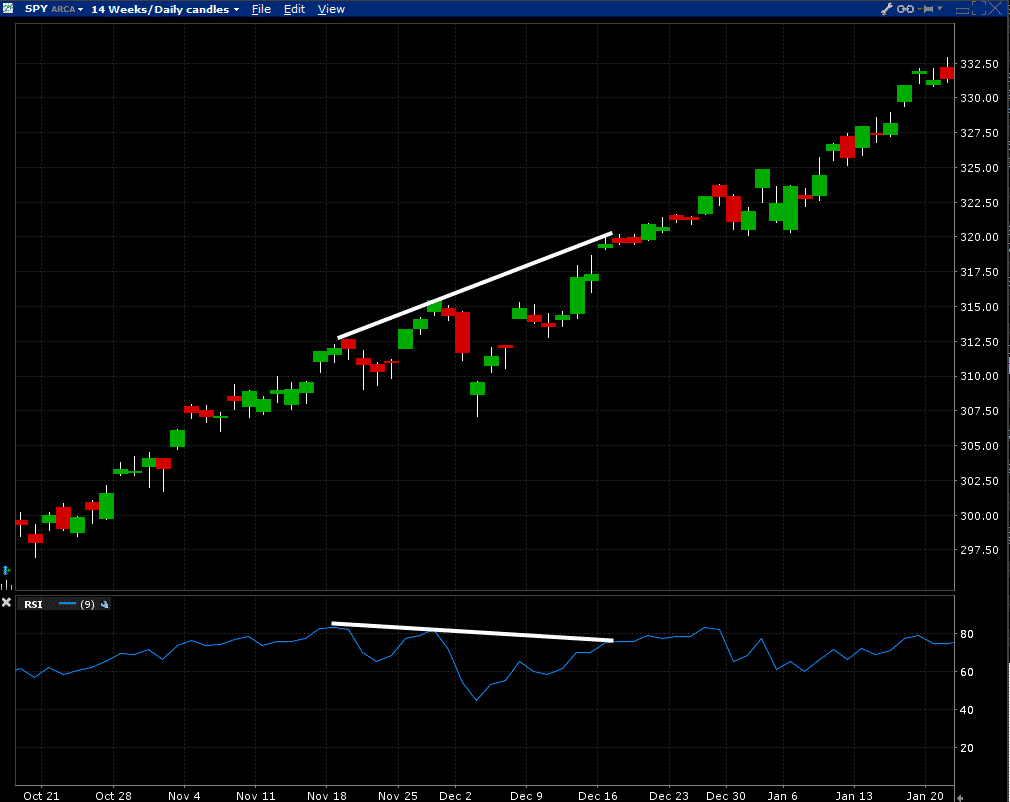
If we look at the pattern developing around November 27th and December 16th, 2019, the price is making higher highs, whereas the RSI indicator is making lower highs.
It seems an excellent example of a bearish pattern, and the price should fall after this.
However, the ETF continues upward.
This is, therefore, a failed example of a bearish divergence.
NOTE: If RSI breaks above the RSI trendline, that is the sign of a failed divergence.
RSI Divergence Trading Strategies
When a bullish RSI divergence forms, the price would rise, and it would be better to go long or buy the stock/asset.
As a trader, you need to keep an open eye from the start when the pattern starts to form because the sooner you identify the pattern, the better your chances of earning a higher return.

Let’s revisit our example of a medium to strong bearish pattern.
As the prices and the RSI indicator start to diverge, with prices making higher highs and the RSI makes lower highs, there is an indication of prices falling.
You need to enter into a short trade to profit from this.
While no indicator is foolproof, divergences are a relatively powerful indicator, and price reversals happen often.
Using it in conjunction with other strategies can increase your chances of a profitable trade.
The strategies can also be optimized using algorithms that can be accessed using trading tools available easily on the net.
While they usually cost you a few bucks, the decreased risk and better identification of trends can make it a very worthwhile investment.
FAQ
What Is RSI Divergence?
RSI divergence is a technical analysis technique that compares the price of an asset to the relative strength index (RSI) indicator.
When the price of an asset makes a new high or low, but the RSI fails to confirm that move, it’s called divergence.
This can be a signal that the trend is losing momentum and a potential reversal may be imminent.
How Do You Use The RSI Divergence Cheat Sheet?
The RSI divergence cheat sheet provides a quick reference guide for identifying and interpreting different types of RSI divergences.
Traders can use this cheat sheet to spot potential trading opportunities and make informed trading decisions.
For example, if the price of an asset is making a new high, but the RSI is making a lower high, it could be a bearish divergence and a potential signal to sell.
What Are Some Limitations Of Using RSI Divergence?
RSI divergence is just one tool among many in a trader’s toolkit.
It’s not a foolproof indicator and should be used in conjunction with other technical analysis techniques and fundamental analysis.
RSI divergence can also produce false signals and requires careful interpretation.
Traders should be aware of the limitations of RSI divergence and use it as part of a comprehensive trading strategy.
Can RSI Divergence Be Used For Any Asset?
RSI divergence can be used for any asset that has a price and an RSI indicator.
This includes stocks, options, futures, forex, and cryptocurrencies.
However, different assets may have different characteristics and require different parameters for the RSI indicator.
Traders should test and optimize their RSI divergence strategy for each asset they trade.
Is RSI Divergence Suitable For Beginners?
RSI divergence is a relatively advanced technical analysis technique that requires some knowledge of chart reading and trading psychology.
Beginners may find it challenging to interpret RSI divergence correctly and apply it in real trading situations.
It’s recommended that beginners start with basic technical analysis concepts and gradually move to more advanced techniques like RSI divergence.
What’s The Difference Between Bullish And Bearish RSI Divergence?
Bullish RSI divergence occurs when the price of an asset makes a new low, but the RSI makes a higher low.
This could be a signal that the selling pressure is decreasing, and a potential reversal to the upside may be imminent.
Bearish RSI divergence, on the other hand, occurs when the price of an asset makes a new high, but the RSI makes a lower high.
Trade safe!
Disclaimer: The information above is for educational purposes only and should not be treated as investment advice. The strategy presented would not be suitable for investors who are not familiar with exchange traded options. Any readers interested in this strategy should do their own research and seek advice from a licensed financial adviser.


