


RSI divergence is a key technical pattern I look for.
Today, I’ll show you how to spot it, and how to trade it.
The formula for the RSI indicator is derived based on the price of the stock.
That is why most of the time if you see prices go up, the RSI goes up.
When the price goes down, RSI goes down.
Except for the fact that the RSI is mathematically forced into a range from 0 to 100, it should follow the price movement.
Occasionally, we notice the subtle difference between the two where their movements are not quite in sync.
When RSI is moving contrary to the price, this is known as an RSI divergence.
We will look at some charts and examples to train your eyes to look for these small divergences.
By spotting such divergences (which can occur in both an uptrend and in a downtrend), it can give clues as to when price might reverse.
Contents
- RSI Divergence In An Uptrend
- RSI Divergence In A Downtrend
- Divergence With A Double-Bottom Reversal Pattern
- Multiple Conditions Align
- Does RSI Divergence Always Work?
- Options Strategies for RSI Divergence
- RSI Divergence Cheat Sheet
- FAQ
- Conclusion
RSI Divergence In An Uptrend
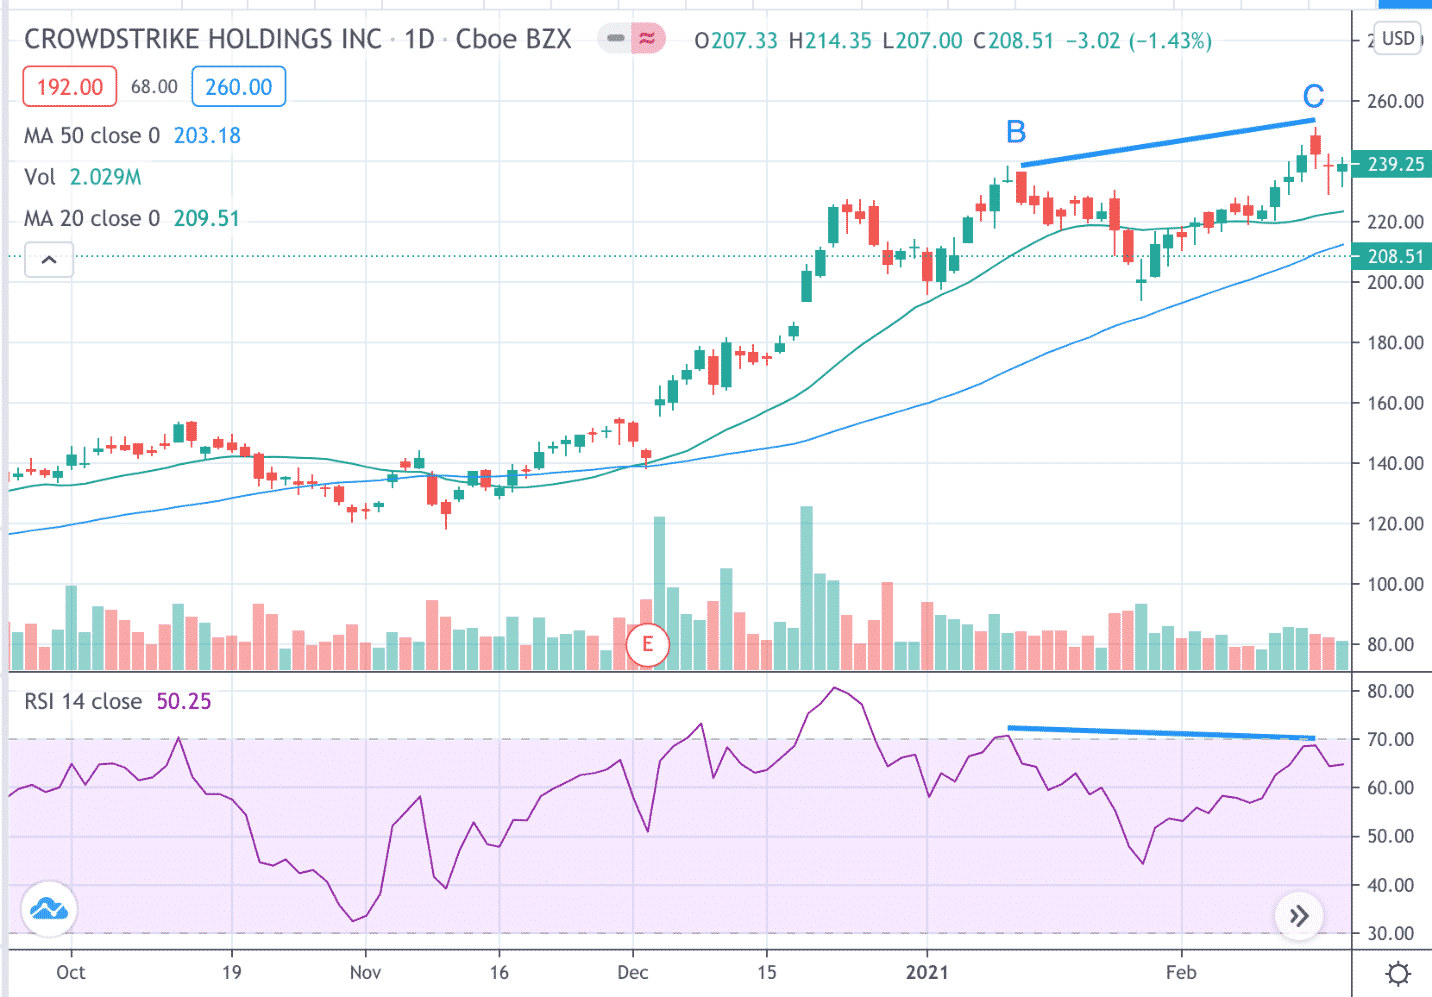
Here is a classic example of an RSI divergence on an uptrend.
We see that Crowdstrike (CRWD) is in an uptrend.
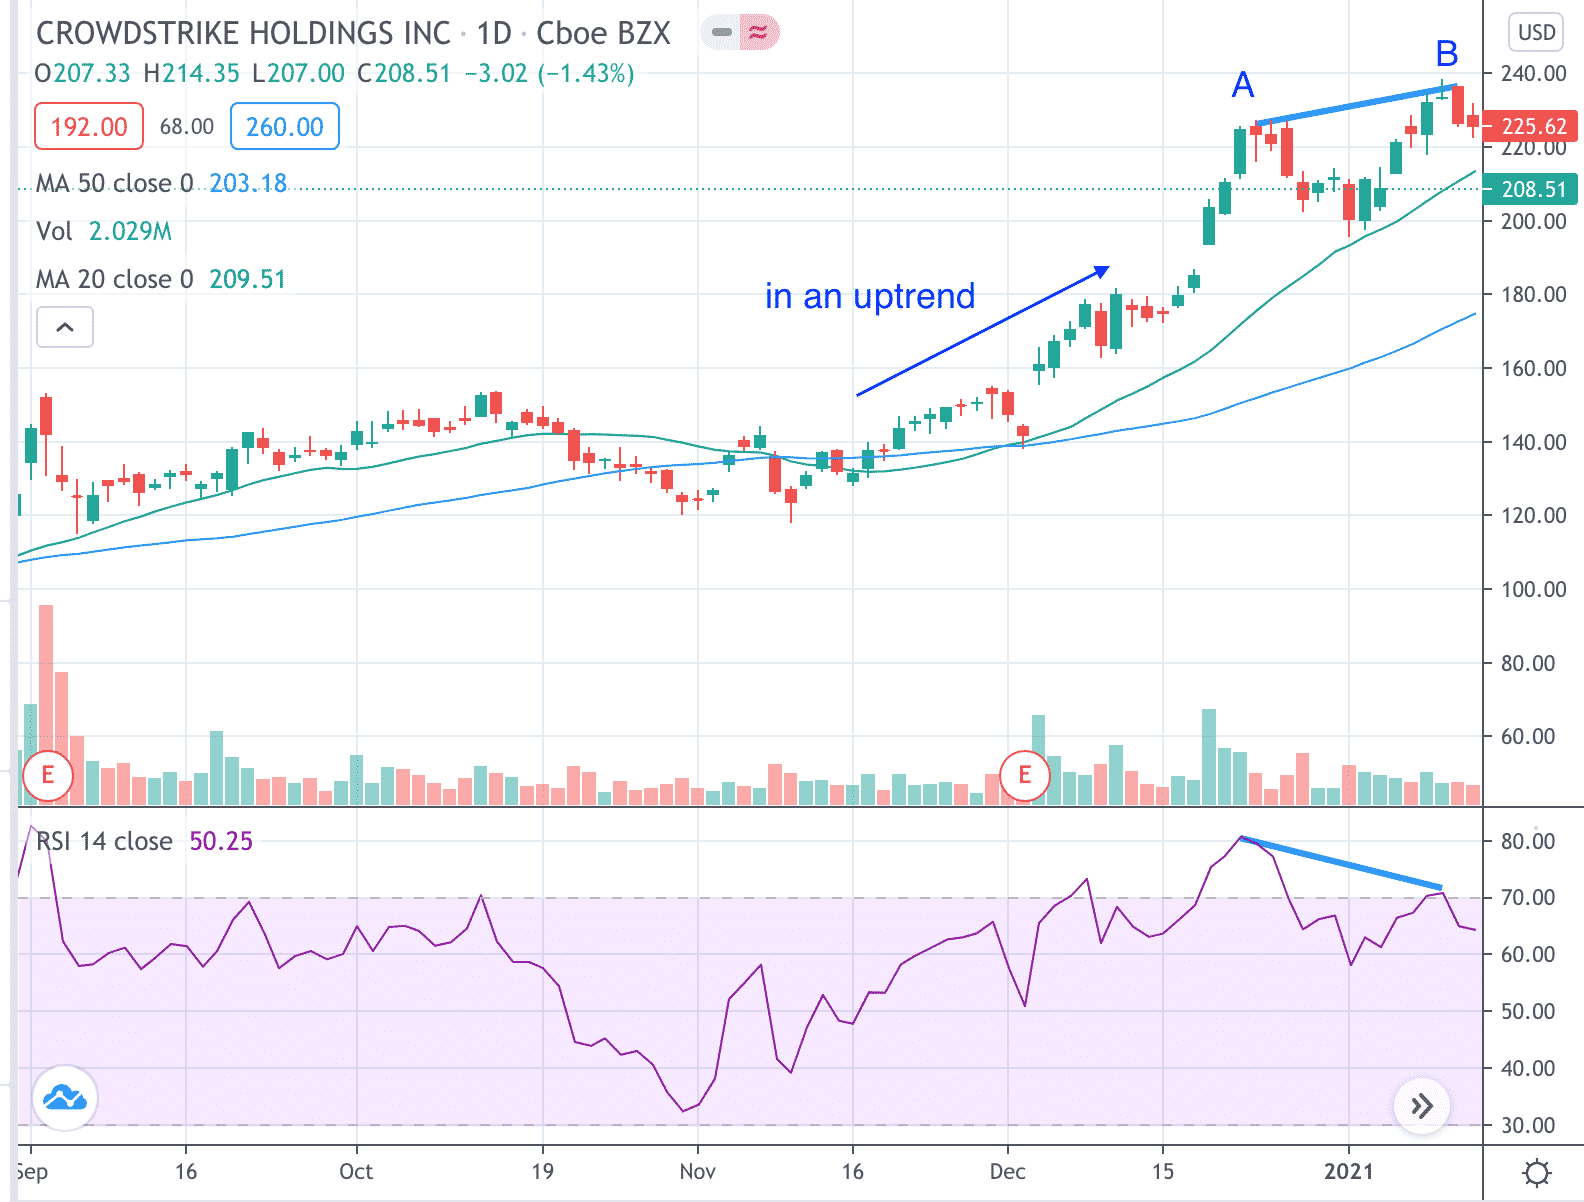
The price peaked at point A and then the price made a higher high at point B.
However, the RSI corresponding to those two points in time did not make a higher high.
In fact, it made a lower high.
The RSI is going contrary to the price. This is known as RSI divergence.
Because RSI is no longer following price, it is suggesting that move higher is slowing, losing momentum, and may possibly reverse soon.
An investor can go short on Jan 14, 2021 (the rightmost red candle seen on the chart) and would have done well.
Note that this works best if the RSI divergence is seen when RSI is in the overbought condition for at least one of the peaks.
We consider RSI overbought when it is above 70.
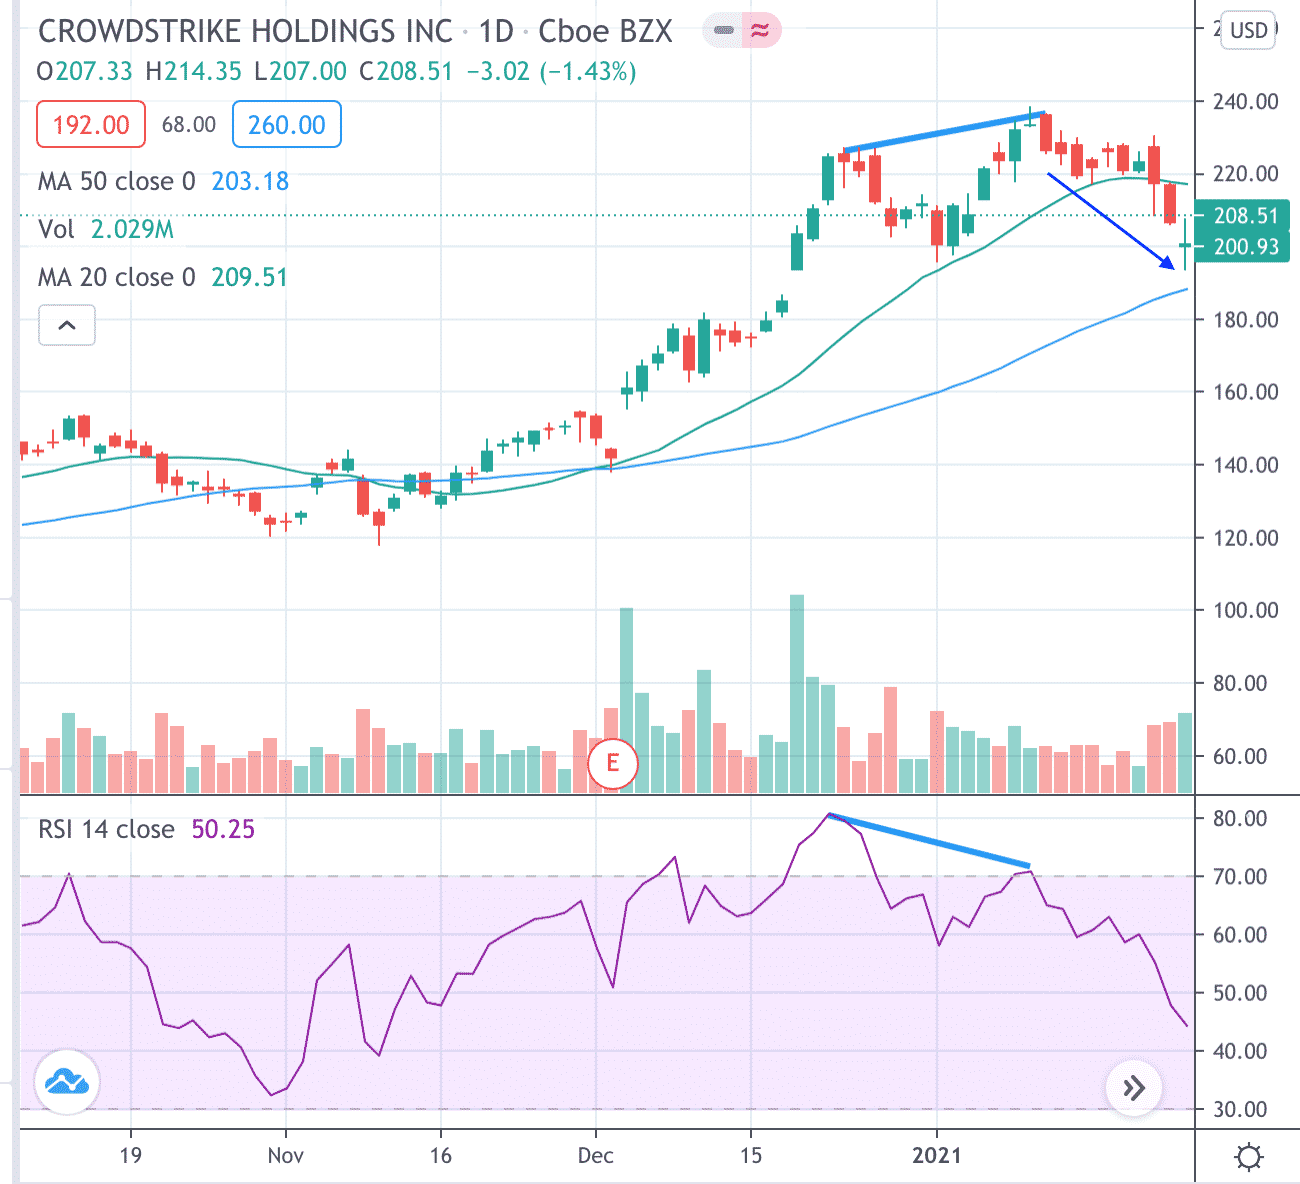
Let’s continue with the CRWD chart. The price makes it to point C, which is a higher high than the previous high at B.
Unconfirmed RSI Divergence
Can we say that there is a second RSI divergence?
Not yet.
While it is true that C is higher than B, it is not a confirmed peak.
We don’t know if it will still keep going up, and whether RSI will still keep going up.
Wait a day or two when we get a couple of down candles before confirming that C is a peak.
And at that peak, RSI peaked as well.
But the peak of the RSI is lower than its previous RSI peak.
It is a confirmed RSI divergence.
Going short again here would have worked out well also.
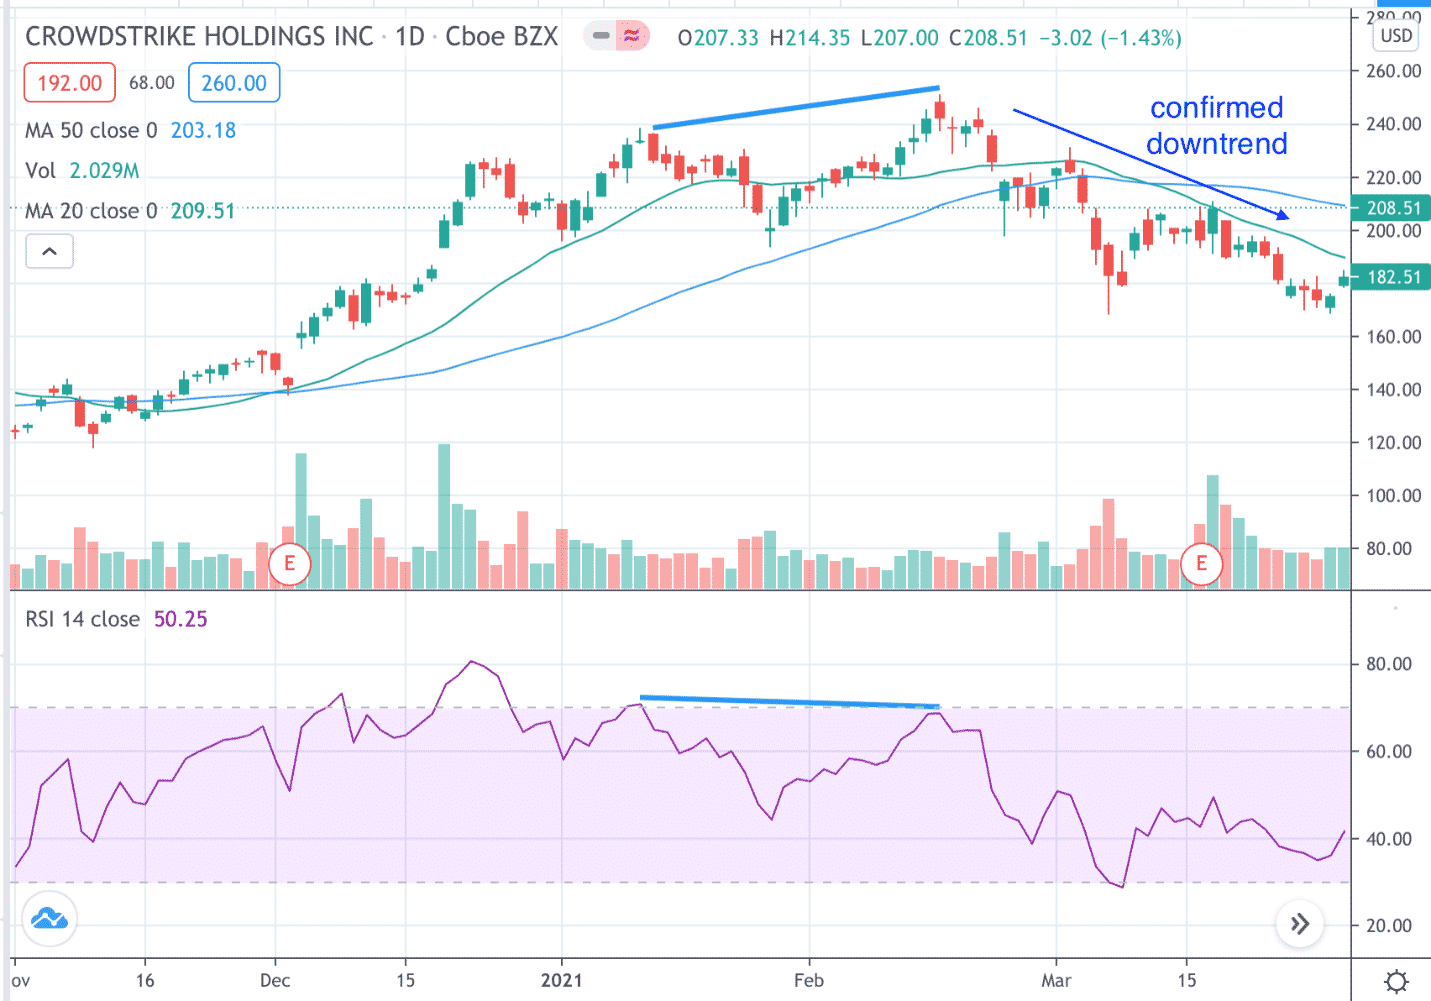
CRWD now is in a confirmed downtrend with lower highs and lower lows.
The 20-day simple moving average had just crossed below the 50-day moving average.
Do you see another RSI divergence?
RSI Divergence In A Downtrend
Yes, there is. Because CRWD is now in a downtrend, we draw a trendline on the price chart from the valley of point D to the valley of point E.
The price is making a lower low (as it should when down trending).
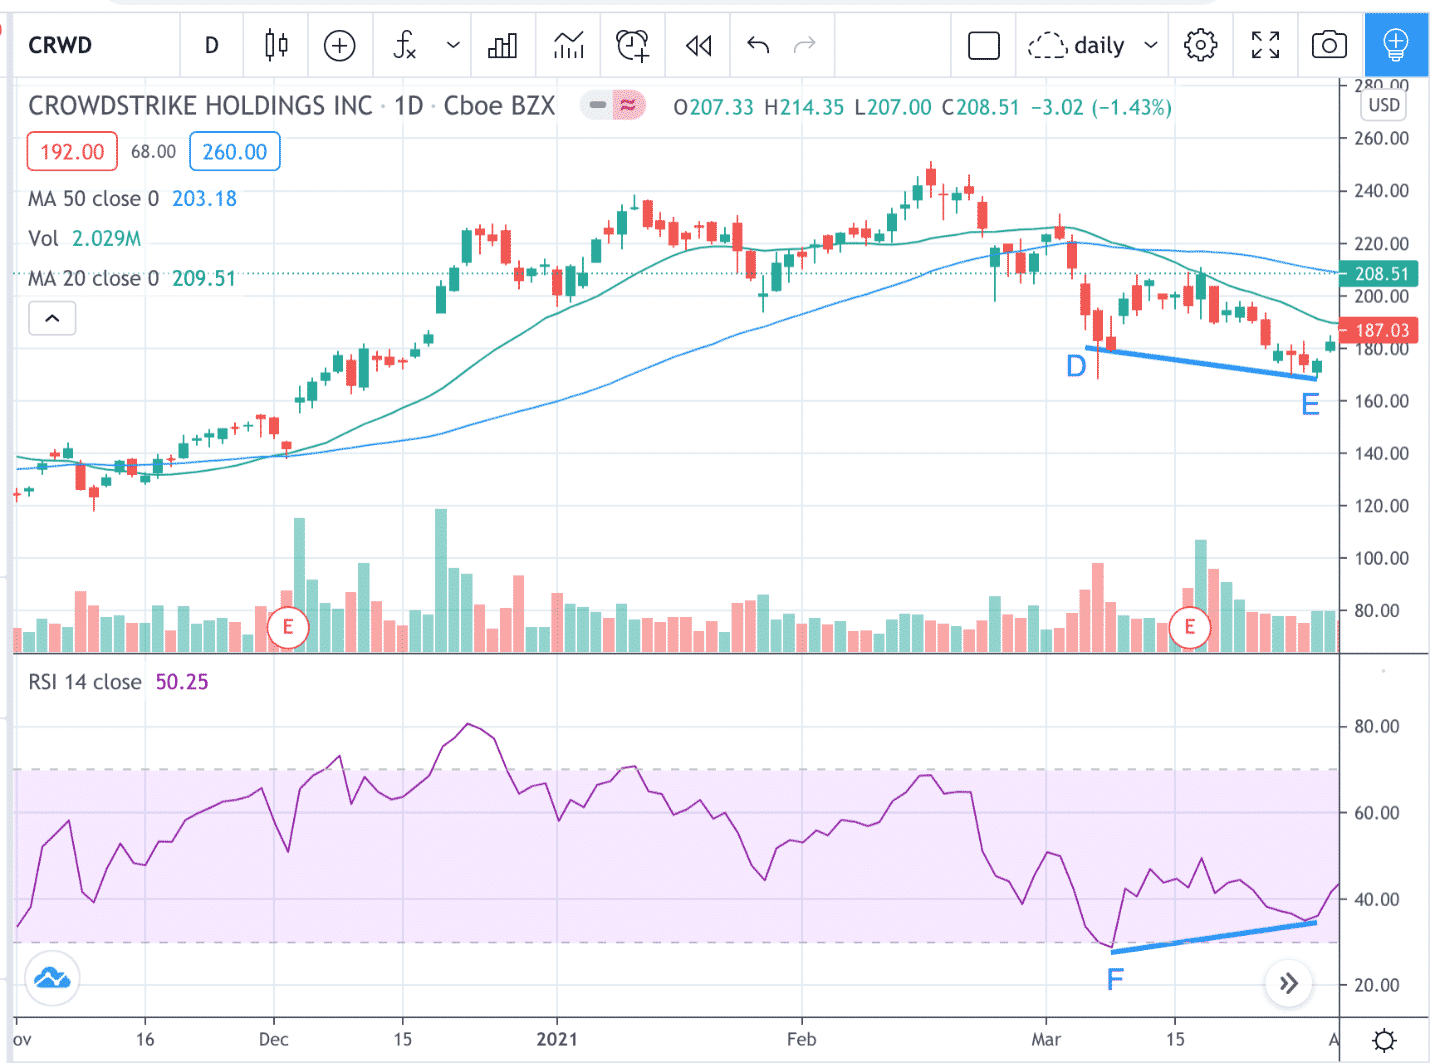
However, the corresponding valley on the RSI is not making a lower low.
It is not confirming the price move. In fact, RSI is making a higher low instead of a lower low. This is moving contrary to price.
The downtrend is slowing and losing momentum.
Furthermore, point F of the RSI is in over-sold condition (RSI lower than 30).
Going long after seeing the gap up with the green candle seen on the rightmost edge of the chart would have done well.
RSI Divergence With A Double-Bottom Reversal Pattern
Below we see Salesforce (CRM) producing a W double-bottom pattern with two equal valley lows.
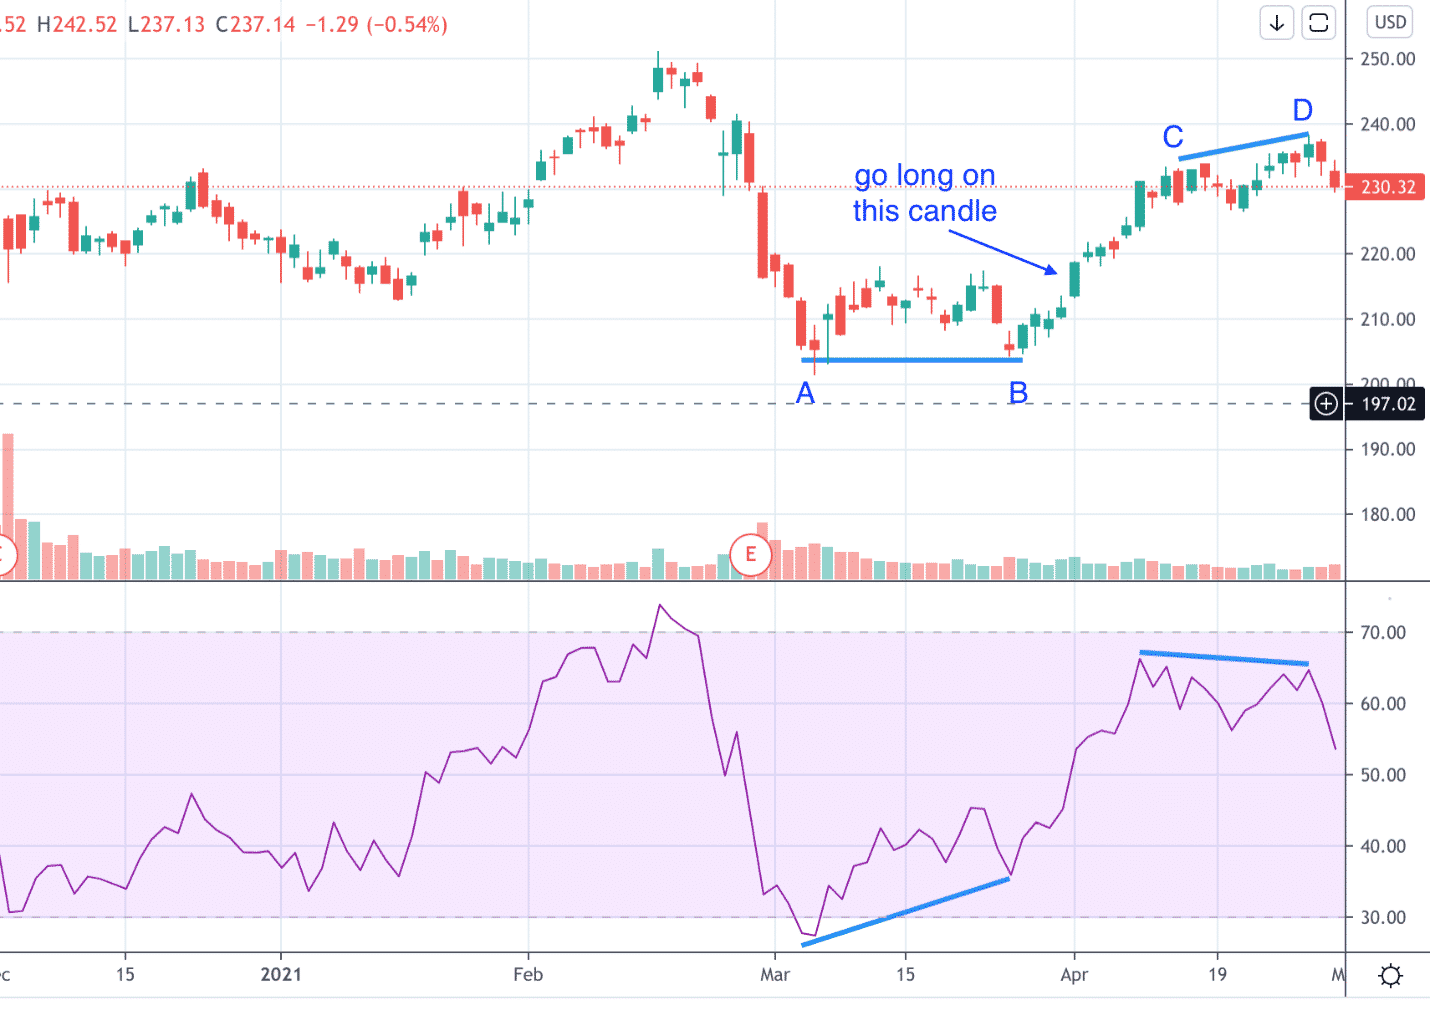
However, the corresponding valley lows in the RSI are up-trending. RSI is showing divergence and has one valley in an oversold condition.
The bullish green candle that broke above the top of the W double-bottom would be a good location for an investor to go long.
The price rallies and later produced a higher high in price — points C and D. However, the RSI made a lower high.
Another divergence. If the investor had not exited the long, then this would be a good time to exit that long position.
Multiple Conditions Align
In the next example, Walgreens (WBA) makes a higher high at point B where it produced a topping tail candle with a long upper wick.
This wick indicates rejection of the prices along the wick.
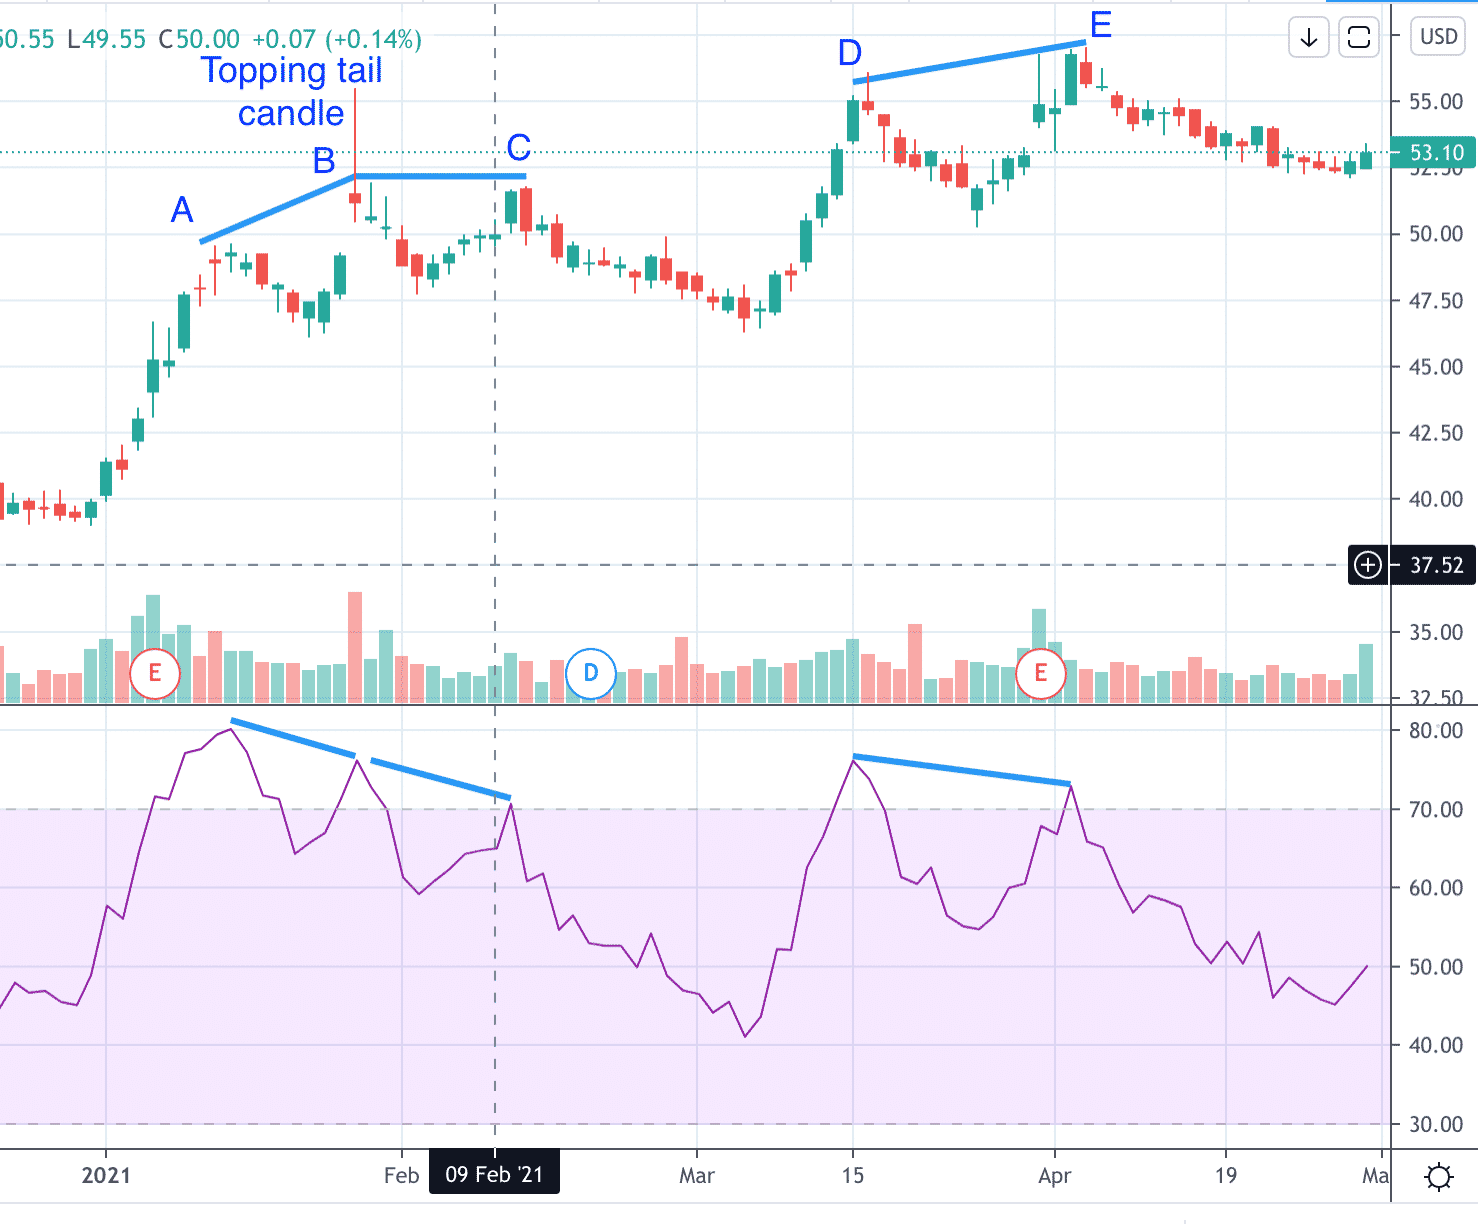
RSI is not making a higher high, and is therefore showing a divergence.
The investor would make a calculated bet that the price will not go above $56, and could have put on a bear call spread.
The price in fact is not able to get past $56 for at least another month and a half.
At point C, the price was not able to go above the previous close high.
It made only an “equal high”. But the RSI is making a lower high.
This provides another chance for an investor to put on a bear call.
Note also at point C, we see a bearish engulfing candlestick pattern.
This makes it three clues to suggest that the price of WBA is going down.
- The topping tail candle
- RSI divergence
- Bearish engulfing candlestick pattern
The more patterns you have in alignment, the better.
By the way, points D and E show yet another RSI divergence suggesting downward pressure on price.
Does RSI Divergence Always Work?
No, it doesn’t.
Here is the Dollar Index ETF (UUP) showing RSI divergence at points A and B, suggesting that price should reverse up after point B.
But it doesn’t, it continues down to C.

Points B and C show another RSI divergence.
Now we have a three-point divergence.
The valleys of A, B, C on the price chart keeps making a lower low.
But the corresponding points on the RSI indicator keep making higher highs.
These tend to be higher predictors of price reversals than two-point divergences.
After point C, the price did reverse.
Options Strategies for RSI Divergence
When RSI divergence is spotted in the oversold or overbought territory, there is a chance of a price reversal.
If an investor makes a directional bet in the direction of the price reversal with appropriate stops and targets, the wins are usually greater than the losses.
Some hypothetical investors might use the RSI divergence as a strategy as follows:
On March 9, 2021, an investor goes long on Apple (AAPL) at $121.09 with a stop at $116 and a target of $128 — a 1.36 reward to risk ratio.
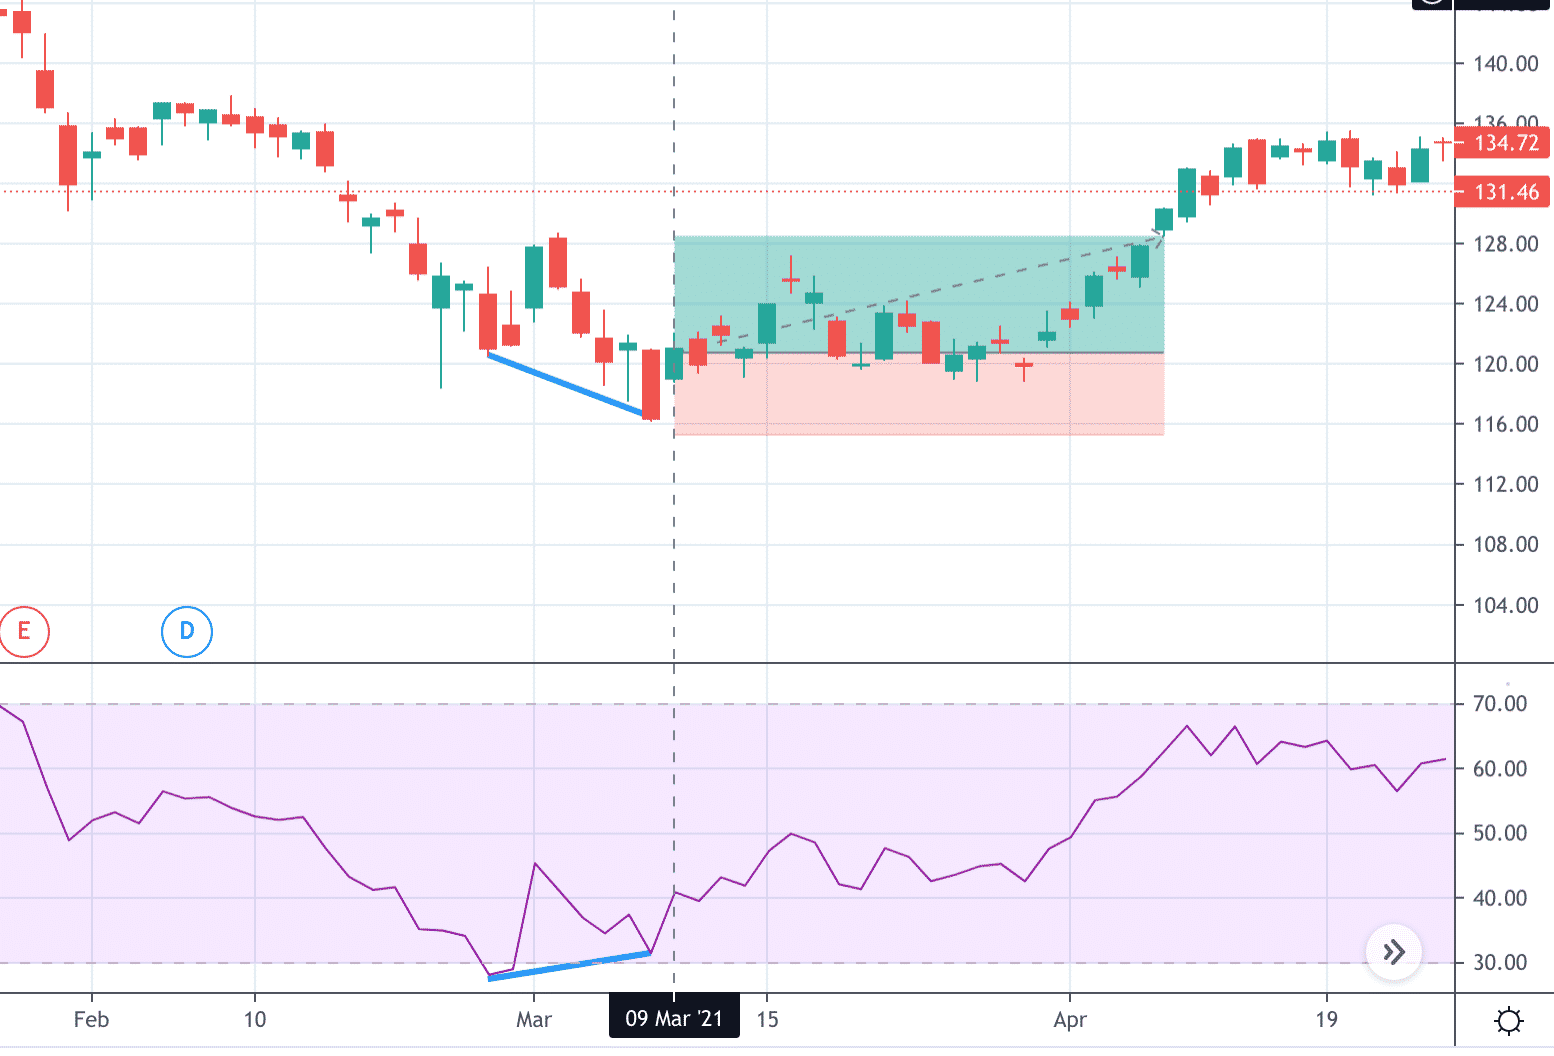
Profits are taken on April 8 when AAPL closed above $128 at $130.36. An investment of 100 shares would return a profit of $927.
While the use of stocks is capital intensive, an options investor may do the same trade using a bull call spread as follows:
Date: March 9, 2021
Price: AAPL @ $121.09
Buy one Apr 9th AAPL $116 call @ $8.08
Sell one Apr 9th AAPL $128 call @ $2.20
Initial Debit: $587.50
Max loss: $587.50
Max gain: $612.50
Reward-to-risk ratio: 1.04
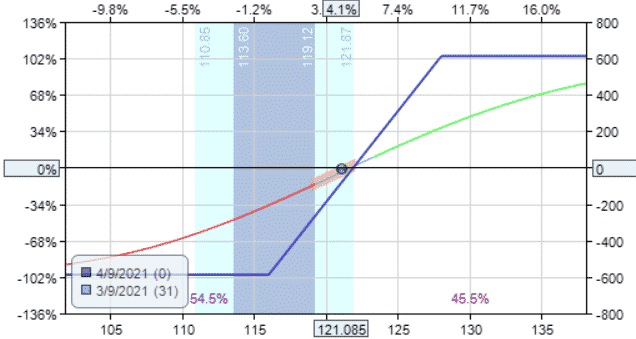
Notice that the options investor selected the strikes at the same price point as the stock investor’s target and stop-loss prices.
Based on the price action with stop and targets as before, the options investor takes profit on April 8 by closing it out as follows:
Trade Details:
Sell to close one Apr 9th AAPL $116 call @ $14.35
Buy to close one Apr 9th AAPL $128 call @ $2.43
Credit: $1192
The net profit on the option trade is $604.50
While the profit taken is less, the option investor used a lot less capital.
RSI Divergence Cheat Sheet
For those that are more visual learners, we created the below RSI divergence cheat sheet.
You can print this out and have it near your computer screens for quick reference.
Let me know what you think in the comments section below.

FAQ
What Is RSI Divergence?
RSI Divergence is a trading strategy that involves using the Relative Strength Index (RSI) to identify divergences between the indicator and the price of an asset.
It is a popular method used by traders to identify potential reversals in the market.
How Does RSI Divergence Work?
RSI Divergence works by looking for divergences between the RSI indicator and the price of an asset.
If the RSI is moving in a different direction than the price of the asset, it may indicate that a trend reversal is likely to occur.
Traders can use this information to enter or exit positions in the market.
What Are The Different Types Of RSI Divergence?
There are two types of RSI Divergence: Bullish and Bearish. Bullish divergence occurs when the price of an asset is making lower lows, but the RSI indicator is making higher lows.
This may indicate that a bullish reversal is likely to occur. Bearish divergence, on the other hand, occurs when the price of an asset is making higher highs, but the RSI indicator is making lower highs.
This may indicate that a bearish reversal is likely to occur.
How Can I Use RSI Divergence In My Trading?
Traders can use RSI Divergence to identify potential reversals in the market and enter or exit positions accordingly.
However, it’s important to note that RSI Divergence should not be used in isolation and should be combined with other indicators and technical analysis tools to make informed trading decisions.
What Are Some Tips For Using RSI Divergence Effectively?
Some tips for using RSI Divergence effectively include:
1) using it in combination with other indicators and technical analysis tools,
2) waiting for confirmation of a reversal before entering a position,
3) using appropriate risk management strategies, and
4) avoiding using RSI Divergence in volatile or choppy markets.
Conclusion
When the price is in an uptrend and RSI is overbought, draw a trendline connecting the price peaks.
Then see if RSI is contrary to that trend or not.
When the price is in a down-trend and RSI is oversold, draw a trendline connecting the valley lows.
Then see if RSI is contrary to that trend or not.
When RSI diverges with price, that suggests that price might reverse the trend, or at least that the trend is slowing.
RSI divergence is a reversal pattern.
It has more validity and weight when the price is in a trend.
Do not give it much importance if you see RSI divergence in a sideways range-bound price chart.
Trade safe!
Disclaimer: The information above is for educational purposes only and should not be treated as investment advice. The strategy presented would not be suitable for investors who are not familiar with exchange traded options. Any readers interested in this strategy should do their own research and seek advice from a licensed financial adviser.


Great indicator Gav, can give great insight on future price movement. I will surely include it when analyzing trade set ups.
Excellent.
Thanks, Gavin for the outstanding and easy explanation. Also for the cheat sheet provided. I will definitely integrate this indicator into my TA.
Cheers!
Try as I might, i can’t tell which lines are price & which are RSI on your cheat sheet – because you provided no key. Should we assume blue is price?
Yes, blue is price. Grey is RSI.
you can do similar divergences with MACD, Ergodic, CCI, etc.
100% agree.