


When trading options, prices are represented in tables and graphs in a number of different ways. One popular way of displaying price action is to use what are called candlesticks.
A candlestick is a special way to display price action in a visual way. A candlestick will contain the high, low, open and closing prices of an asset and can be set to any time period (minutes, days, weeks, months, etc). They are called candlesticks because they literally look like a candlestick with a wick at one or both ends.
In some cases a candlestick may tell you nothing except for price action details (high, low, etc). Every so often one or more noteworthy candlesticks appear which can serve as a signal for an imminent change in market conditions. One such candlestick is called the hammer candlestick.
The Hammer Candlestick
The hammer candlestick is formed when, during a given time period, a stock trades for a price that’s significantly lower than its open price but then rallies to close very close to the open price.
This causes a candlestick to form that looks like a T or hammer – it will have a small, narrow body at the top near the open and a long tail (sometimes called a shadow) that is at least twice the length of the body. The body represents the open and close prices while the tail represents the high and low of the period.
What Does A Hammer Candlestick Signify?
When a hammer candlestick occurs during a downtrend, it indicates that a potential price reversal may occur to the upside.
The reason for this is that while the price did temporarily dip quite low, there was a lot of pushback from the market (called support). This means almost all the selling was absorbed by buyers who subsequently pushed the price back up to near the open.
How Do You Trade A Hammer Candlestick Pattern?
When you spot a hammer candlestick, first check that it was preceded by a downtrend. If you see three or more declining candles preceding the hammer candle, then you can be confident the downturn condition has been satisfied.
If so, the next step is to observe the behaviour of the three candlesticks. This will help determine if a reversal is happening or if it’s a false signal.
If the price starts to moves up in the next three candlesticks after the hammer, this signifies that the hammer candlestick has likely been a correct indicator of a risk reversal. This is called a confirmation of the move.
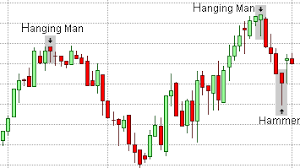
Image Credit: chart-formations.com
When executing a trade, you would typically enter after the confirmation candle. While you could do so earlier, you have a higher chance of hitting false-positives and getting whipsawed by the market.
Conclusion
A hammer candlestick is a visual indicator used to indicate that sellers have potentially capitulated and a potential price reversal may occur to the upside.
To execute a trade using a hammer candlestick, watch for a three candle downtrend preceding the hammer, followed by a three candle uptrend following the hammer.
Trade Safe!
Disclaimer: The information above is for educational purposes only and should not be treated as investment advice. The strategy presented would not be suitable for investors who are not familiar with exchange traded options. Any readers interested in this strategy should do their own research and seek advice from a licensed financial adviser.


