


Price action is not just about candle sticks, chart patterns and volume analysis.
Rather, it’s reading the sentiment of the markets, identifying areas of value, and finding high value set ups.
There are many ways to analyze price action, the key is to focus on a few key methods and know how to apply them effectively.
So today, you’ll learn 6 of my favorite price action trading tips and how to implement them in your trading.
Rock on.
Contents
- Divergence Is A Powerful Indicator
- From Failed Moves Come Fast Moves
- Consolidation Leads To Expansion and Vice Versa
- Reversion To The Mean
- Trading With The Trend Is More Forgiving Than Fighting The Trend
- Spotting When A Trend Is Over
Divergence Is A Powerful Indicator
My single favorite price action method is looking for divergence. The premise is that when a new high or low in a security is not confirmed by the indicator, it lets us know a potential reversal could be imminent.
For example, a bullish divergence occurs when price makes a LOWER low, but the indicator makes a HIGHER low.
Below is an example using AAPL. The stock made a low in December 2018, then made a lower low in January 2019. But, RSI made a higher low indicating that the strength of the selling was declining.
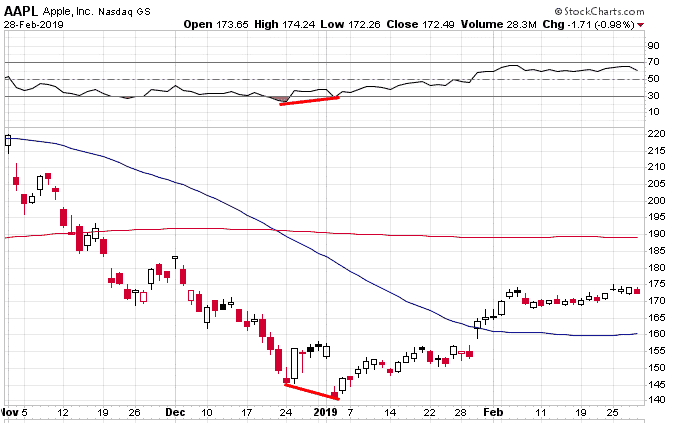
This shows that the downside momentum is slowing, even though prices are continuing to make new lows, and the trend may soon reverse.
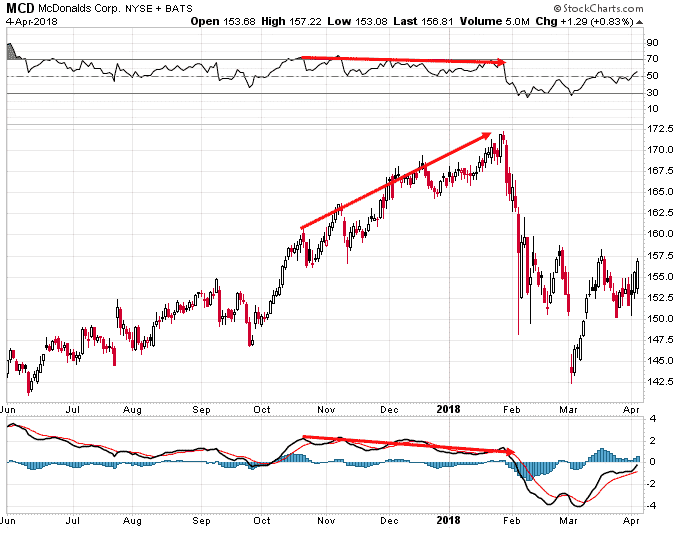
Bearish divergences occur when prices make a HIGHER high, but the indicator makes a LOWER high.
Here you can see MCD going through a nice rally, but making successively lower highs on RSI and MACD is also trending lower. Shortly after, the stock had a big fall.
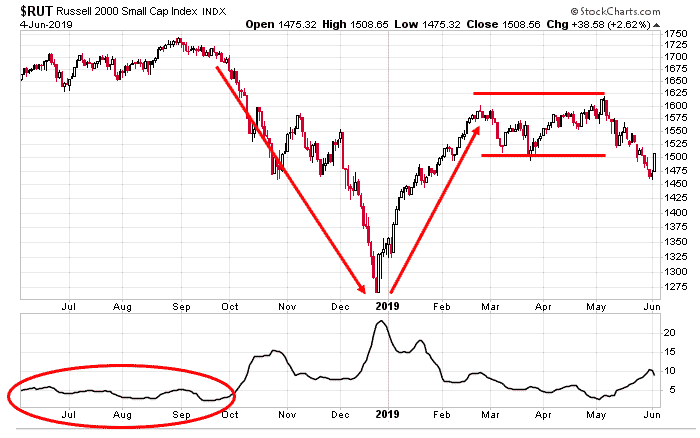
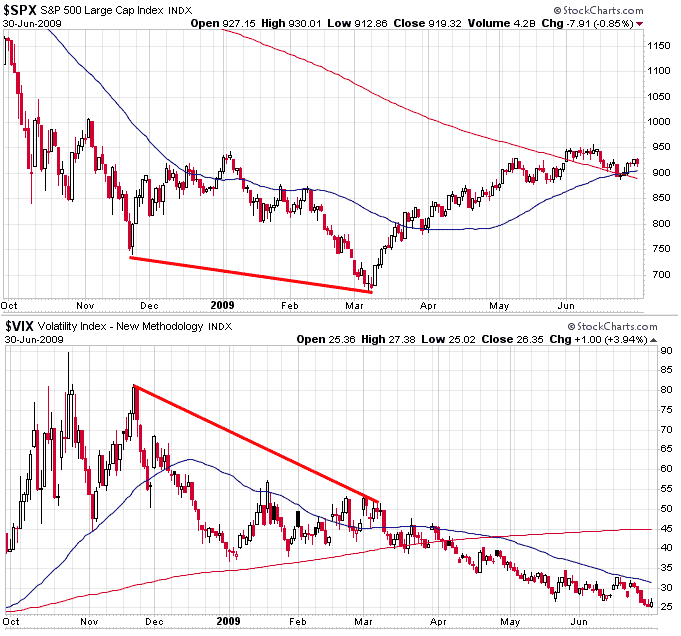
Divergence doesn’t have to use an indicator like RSI or MACD either. Another important divergence to watch for is between the SPX and VIX.
If SPX is making a new panic low, but VIX is not making a new high, this is a great sign that the bottom might be in.
The most famous example of this is from March 2009 when SPX made it’s final bottom. Even though stocks were plunging to the depths of the bear market lows, VIX was not nearly as high as it was on the prior decline.
This is telling us that there was much less panic in the market and SPX went on to start one of the greatest bull market runs in history.
From Failed Moves Come Fast Moves
This is a great tip that I learned from J.C. Parets from All Star Charts. Here’s what J.C. has to say”
“The psychology is simple. A market is trending and goes on to make a fresh new high (or new low in a downtrend). That new high above key resistance, quickly reverses leaving those late comers holding the bag. In an example of a new high, the short sellers get stopped out of the positions they initiated against former highs. And new longs come in and buy the euphoric “breakout”. So what happens? The market quickly reverses lower leaving those new longs up there having to sell in order to get out, adding to the selling pressure that was naturally already there. In addition, the short sellers that got stopped, now have to re-short the security, adding even more sellers. This is why from false moves, come fast ones in the opposite direction.”
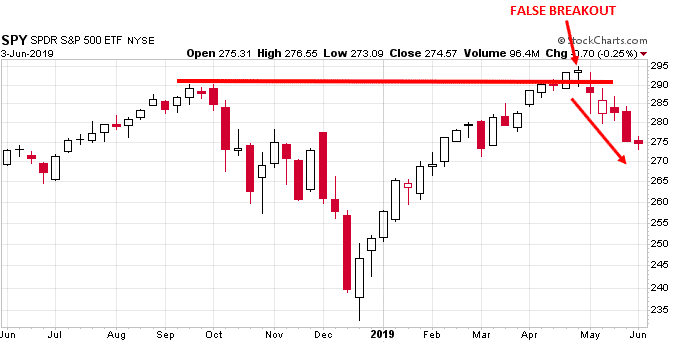
Here’s a great recent example on SPY. After briefly breaking out above the September 2018 high, SPY reversed back below the support / resistance line then continued lower over the next few weeks.
A lot of traders would have been trapped on the long side when SPY broke above resistance.
Consolidation Leads To Expansion And Vice Versa
Stocks move in cycles and generally after periods of consolidation, the stock will then enter a period of expansion.
After periods of expansion, stocks tend to consolidate and go through a tighter range for a while.
You get the idea, and here are a couple of charts to illustrate the point.
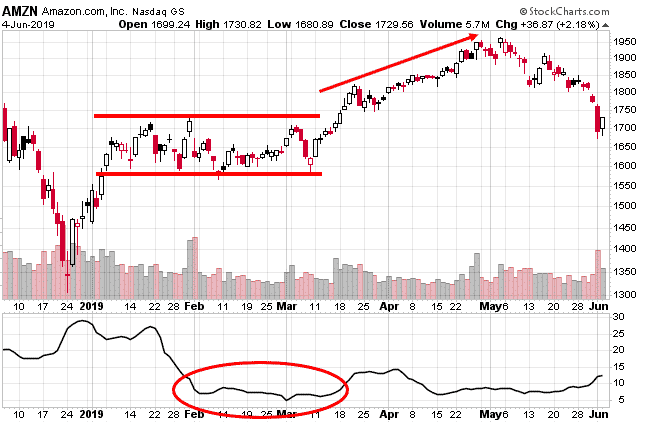
Amazon in 2019 had two months of trading in a very narrow range. Once it broke out, it went from 1750 to 1950 pretty quickly.
The indicator at the bottom of the chart is the Bollinger Band Width. This is a good one to keep an eye on, when the Bollinger Bands become very narrow for an extended period, you can be sure that a range expansion will be just around the corner.
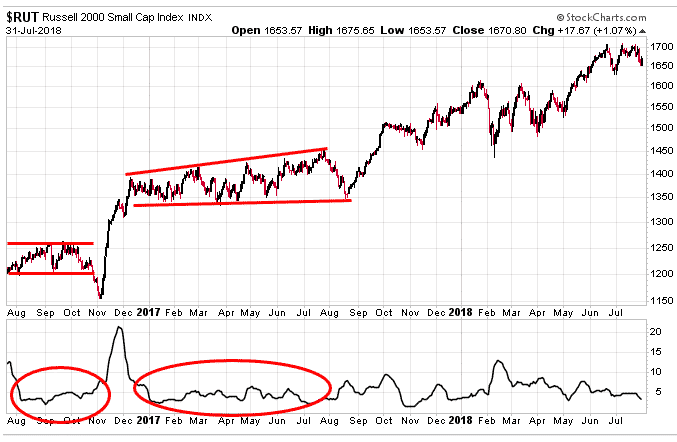
The Russell 2000 experienced a very tight range in late 2016 right before the US election. After that we saw some fireworks with a brief move lower followed by an extremely violent move higher.
After the massive up move, RUT went through a period of 7-8 months where it consolidated in a very narrow range. After that it went from 1350 to 1600 and back to 1450 over the space of a few months.
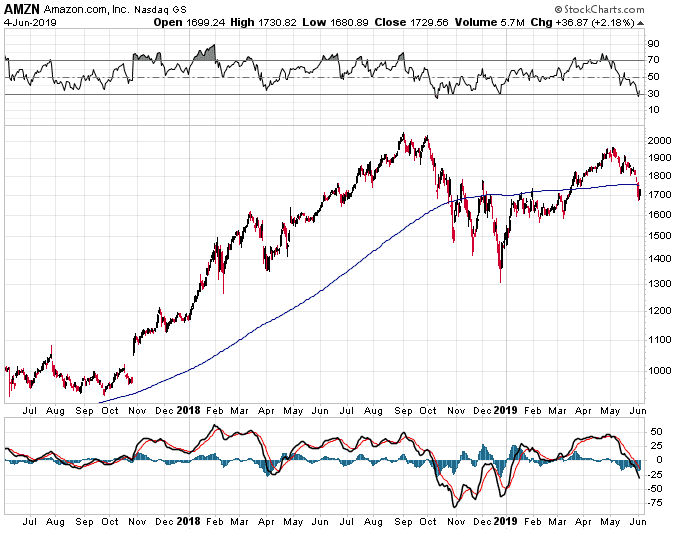
Here’s one final example from 2018-2019. Tight Bollinger Bands from July to September proceeded a sharp move lower then back up, then a two moth consolidation.
Reversion To The Mean
Reversion to the mean is a concept in finance that a stock or commodity will tend to move away from extreme values over time.
Using moving averages is a good way to see how extreme the current price of a stock is.
For example, when a stock gets a long way above its 200-day moving average, we can assume that it will come back to meet that average at some point in the future.
This can occur either through a correction in price, or a correction through time where the average “catches up” to the stock price.
In the second half of 2017, AMZN had been a long way above its 200-day line for a LONG TIME. At the time, I said this regarding AMZN:
“Stocks ALWAYS come back to the 200-day moving average eventually. It could happen in the next few months, it could take 6-12 months. It could happen with a short sharp 25% decline, or it could involve months of sideways action which the 200 catches up with price. But mark my words, at some point AMZN will touch the 200-day line again.”
Sure enough, AMZN topped out in August 2017 and by late October had come back to touch the 200-day line. Not only did it touch the 200, it overshot it by about 20%.
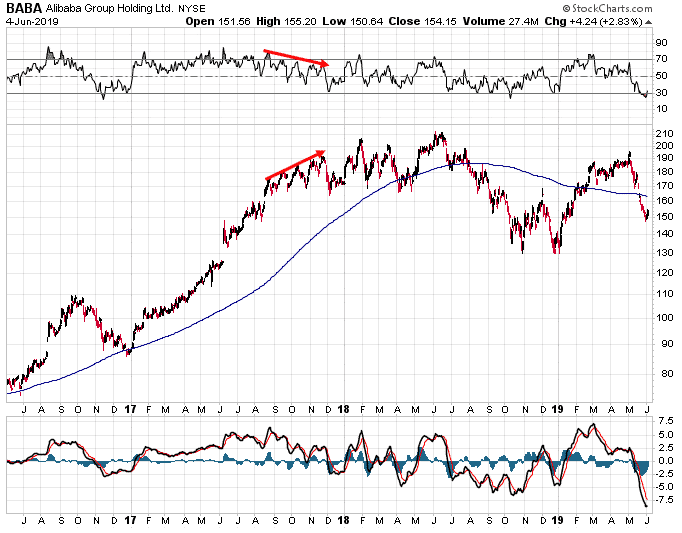
I said the same thing about Alibaba back in late 2017 at a time when no one was willing to bet against the stock. Since then BABA has traded sideways with quite a few big up and down moves, but sure enough it eventually touched the 200.
Trading With The Trend Is More Forgiving Than Fighting The Trend
Trading with the trend, will greatly increase your chances of success as a trader. It’s a much more forgiving way to trade.
One of the simplest ways to monitor the trend is via the 20-day moving average:
- Stock is above the 20-day and the 20-day is sloping upwards = bullish
- Stock is below the 20-day and the 20-day is sloping downwards = bearish
While there are some periods of chop on the chart below, it’s pretty clear to see that trading via the above method can be hugely profitable.
You can also see several examples of the 20-day moving average acting as support or resistance during the trend.
Spotting When A Trend Is Over
Some of the main things I look for when trying to spot the end of a trend:
- Divergence as mentioned above
- A key moving average is broken
- A key trendline is broken
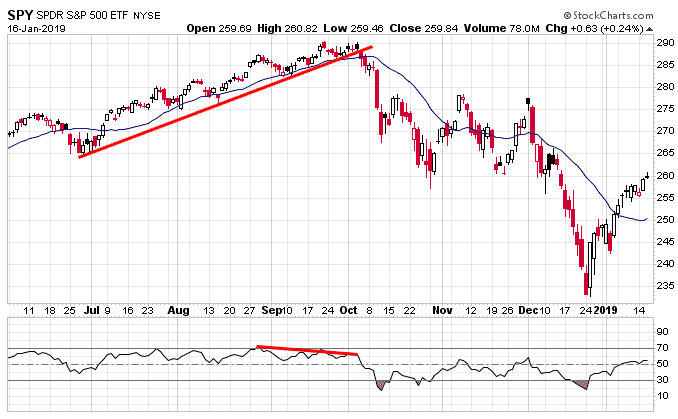
Let’s use SPY again as our example. In the chart below you can see that:
- There was negative divergence
- The moving average was broken
- The trendline was broken.
A couple of days after those 3 things occurred, SPY dropped sharply.
It can take years to learn some of these things and then to spot them in real time. I wish you all the best on your trading journey and I hope this article helped you in some small way.
Trade safe!
Disclaimer: The information above is for educational purposes only and should not be treated as investment advice. The strategy presented would not be suitable for investors who are not familiar with exchange traded options. Any readers interested in this strategy should do their own research and seek advice from a licensed financial adviser.


