


Today, we’re looking at a technical analysis formation known as the 1 2 3 chart pattern. We’ll discuss what it is and also give some recent examples.
Contents
- Introduction
- The 1 2 3 Chart Pattern
- What is a 1-2-3 Chart Pattern?
- Brief RSI Usage Overview
- BABA Example Trade
Introduction
Technical analysis can be quite intimidating if you’ve never used it before.
So, what is it and how do you start using it?
Technical analysis involves using price action and chart patterns to analyze and attempt to predict future price movement.
The other type of analysis is called fundamental analysis and uses financial statements and examination of the company itself to predict future price movement.
Which is better?
Neither are foolproof and it really depends on how you want to approach trading.
As for technical analysis, you are probably are already doing technical analysis.
Ever look at support or resistance levels?
How about indicators like MACD, RSI, CCI, or moving averages?
Ever notice a chart pattern like head-and-shoulders or triple tops?
These are all examples of technical analysis.
The 1 2 3 Chart Pattern
Today, we are going to focus on a particular chart pattern called the 1-2-3 chart pattern. I am going to couple it with a popular momentum indicator, RSI.
Once you’ve been around the markets awhile, you will learn to never base your trades on a single pattern or indicator.
We always want our patterns and indicators to provide confirmation or divergence as a way to signal a buy or sell signal for our trade.
You could just as easily combine this pattern with a trend indicator like the average directional index (ADX).
It is a trend indicator used to measure the strength and momentum of a trend and most likely what I would use.
I opted to use RSI because it’s easier to explain and I want us to focus mainly on the chart pattern.
What is a 1-2-3 Chart Pattern?
As with most chart patterns, there is a predefined set of price movements that satisfy the pattern criteria, which provides a buy or sell signal.
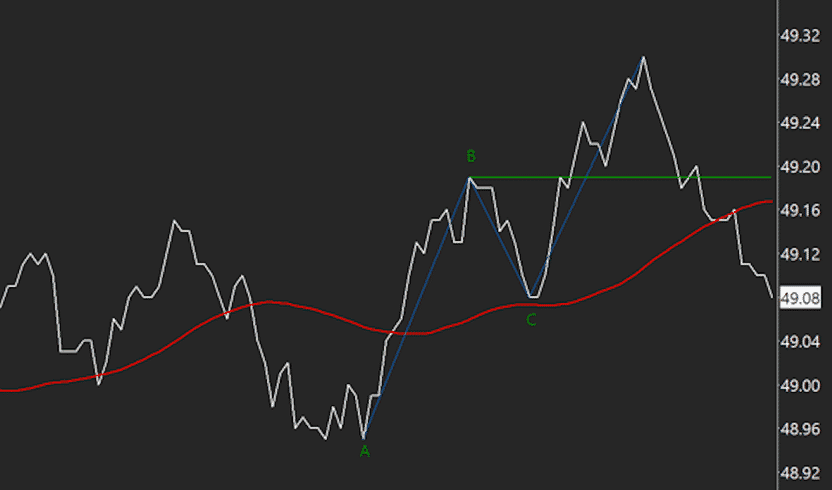
The chart below shows the price pattern of a hypothetical stock called XYZ. Assume we are using the trading timeframe you normally use.
For me, this would be a 1-year, daily chart.
The basic 1-2-3 chart pattern has 4 required elements or points on the price chart for this pattern to indicate a trade signal.
1-2-3 Chart Pattern Criteria
- Low point (point A on the chart)
- Higher high point (point B on the chart)
- Retracement from point B, but not lower than point A (point C on the chart)
- Reversal from point C past the point B level (B line on the chart) – this would be the buy signal for a long trade
I want to briefly point out that this chart pattern can also be used for short trades by reversing each of the pattern criteria above (i.e., 1st point would be High point).
I don’t want to create a lot of confusion, so we will stick with the long signal here.
There are also some variant entry signal criteria that can be used.
We won’t use them, but I want you to be aware of them.
Normally, we wait for the price to move through the B line, but we can adjust the entry point depending on our risk tolerance.
Both situations add another 1-2-3 chart pattern within the first pattern as a trade signal.
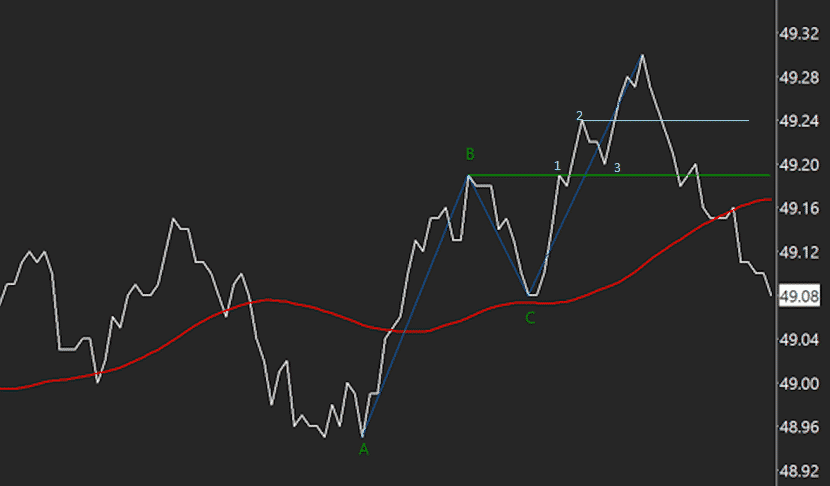
In the chart below, we see another 1-2-3 chart pattern above the B line.
This variation would be used by a more conservative trader that really wants to make sure they have a good trade signal.
The trade signal would occur after the price passes the 2 line.
On the other hand, a more aggressive trader might want to buy before the price crosses the B line.
In this case, imagine the second 1-2-3 chart pattern between point C and the upward crossing of the B line.
The trade signal would be indicated after the price crosses the 2 line.
Brief RSI Usage Overview
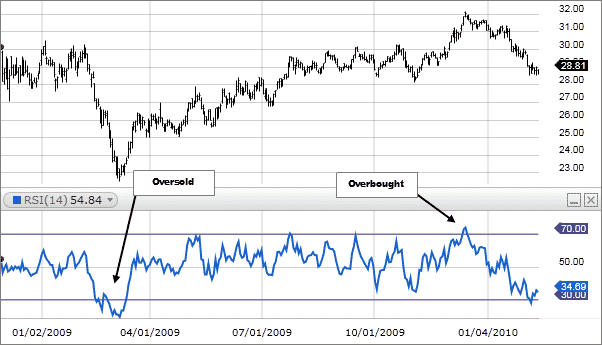
RSI is a popular technical indicator that I use very often.
It signals overbought and oversold conditions that can help us a lot. RSI indicates an overbought condition when the value, which ranges from 0 – 100, is over 70 and it indicates an oversold condition when the value is below 30.
The oversold condition indicates that the price is ready to rise and vice versa for the overboughtcondition.
BABA Example Trade
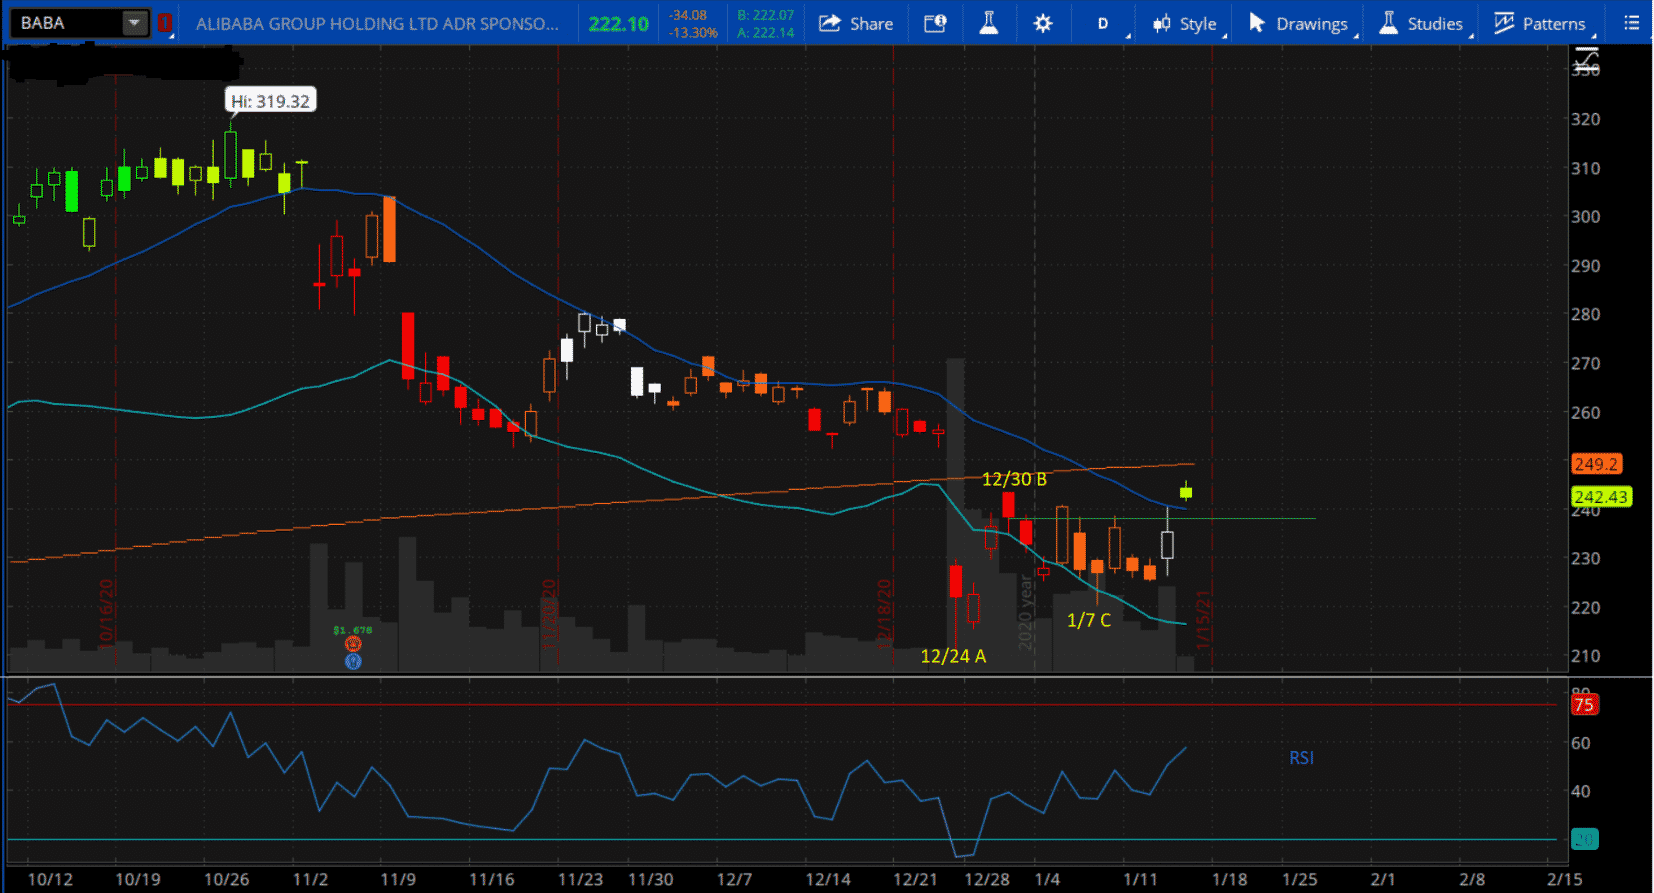
I like BABA and trade it quite often.
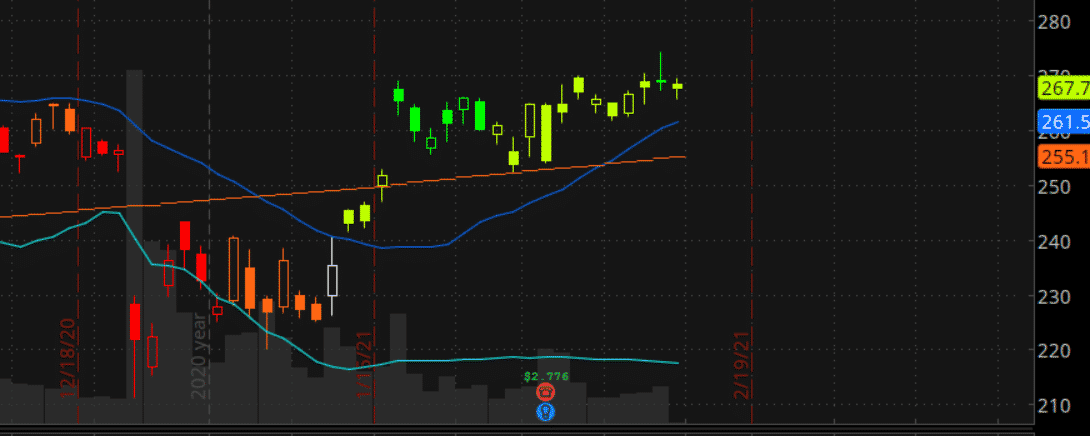
We begin looking at the price action on 12/24/20.
This is our A point for the 1-2-3 chart pattern and the closing price was $222.
Take note of the RSI on 12/24/20, it is 12.7 indicating our stock is oversold and poised to rally. On 12/30/20, we see our B point and on 1/7/21.
Then on 1/14/21, we see BABA close at $242.98 and it’s above the B line ($238.39).
Here is our buy trigger on 1/14/21 and the RSI is about 58. It’s a little higher than we might like, but it tells us that BABA is not overbought and still has room to rise.
Our strategy is indicating a trade trigger based on the stock rallying higher, great. So, what to trade?
I am a big fan of defined risk trades and the put credit spread (PCS) is among my favorites.
Bull Put Spread Trade Setup
Date executed: Jan 14, 2021
Sell 1 put option, expiration 2/19/21 (36 DTE), strike $205
Buy 1 put option, expiration 2/19/21 (36 DTE), strike $200
Premium: $155
Capital At Risk: $345
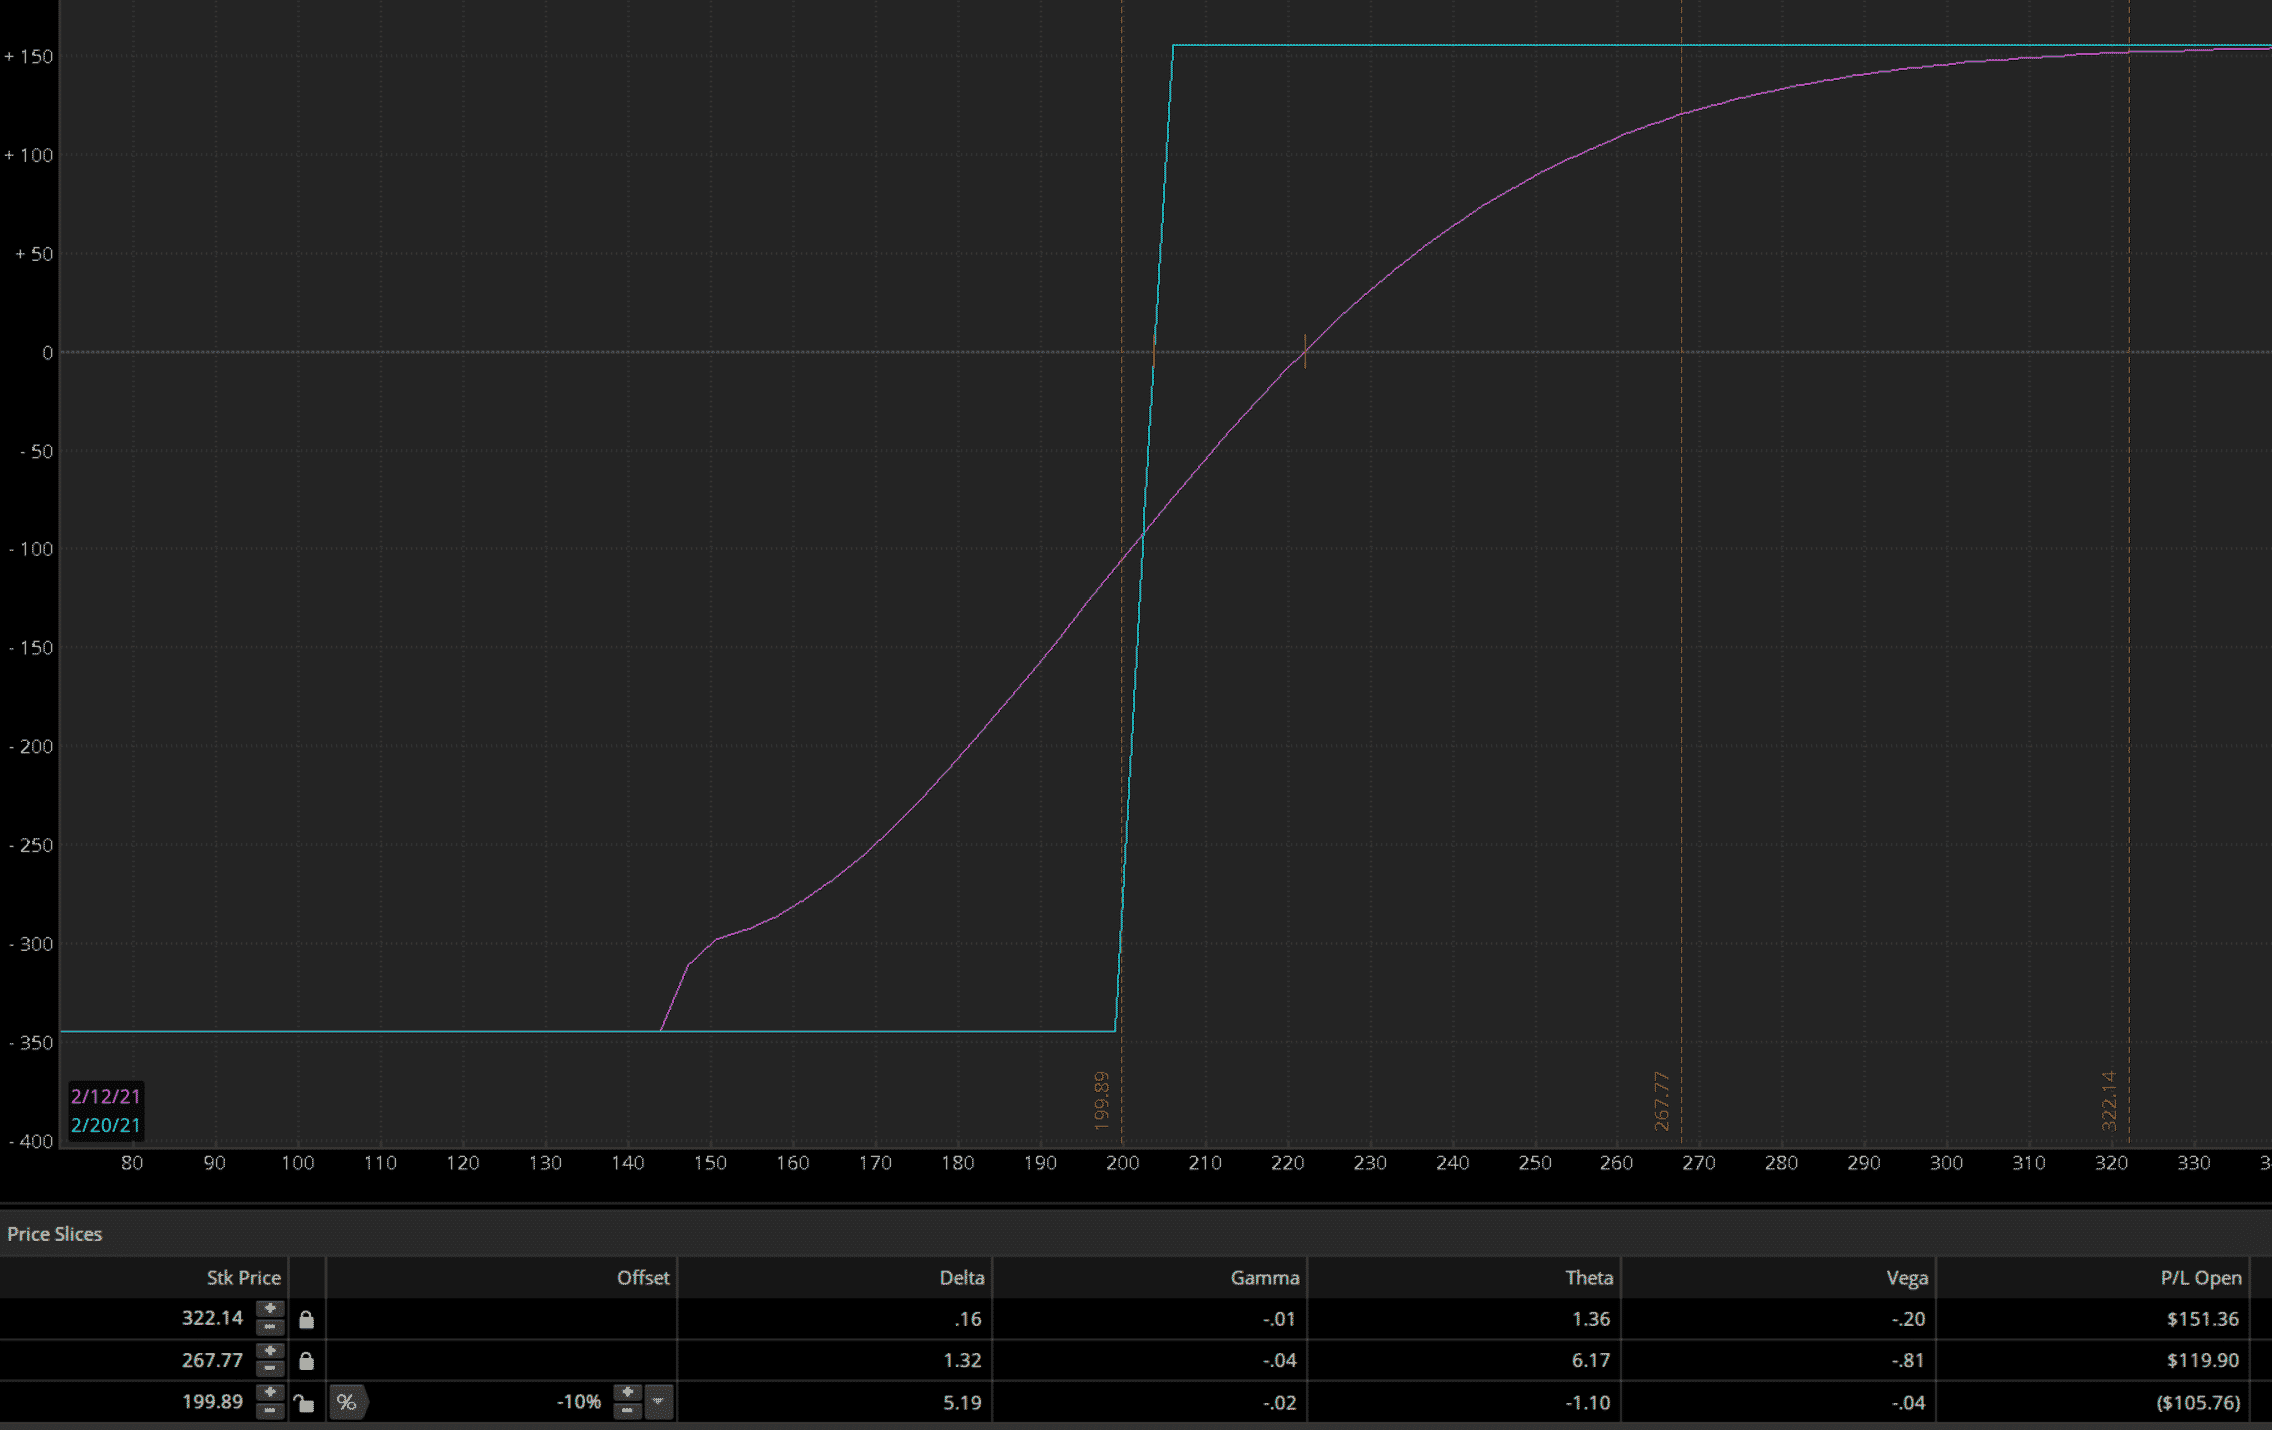
Let’s fast forward to 2/12/21, one week prior to expiration.
I don’t like to hold winning trades into expiration week because gamma can quickly wipe out all your gains very quickly.
In our case BABA is trading at $267.77 on 2/12/21. This is a nice profit for us.
We had to put up $345 margin and we received $155 premium to open the trade.
Depending on your account size, you could have traded 5-7 spreads easily since each spread only had a $345 buying power reduction in your account.
So, how did we do?
Well, we made $119.90 and we had a buying power reduction of $345, so our profit is 34.75% ($119.90 / $345.00).
Trade safe!
Gav.
Disclaimer: The information above is for educational purposes only and should not be treated as investment advice. The strategy presented would not be suitable for investors who are not familiar with exchange traded options. Any readers interested in this strategy should do their own research and seek advice from a licensed financial adviser.


