


The Relative Strength Indicator, also known as the RSI, is a technical analysis metric employed by traders to estimate if a particular security is overvalued or undervalued, based on the fluctuation of its price within certain pre-defined upper and lower bounds.
How Does RSI Work?
The RSI is traditionally modeled by using the closing price of the security during the last 14 days or 14 weeks.
The average gains and losses experienced during those periods are employed to calculate the index and, with that information, the upper and lower bounds are set.
Most traders employ a 70 upper bound and a 30 lower bound for the RSI and they use these bounds to determine if a stock is overbought or oversold.
An overbought stock is one that can be considered overvalued based on its past performance and, therefore, its price should collapse at any given point in time as a result.
On the other hand, an oversold stock is one that is considered to be undervalued based on its past performance and, therefore, its price should go up at any given point in the future.
How Can I Use the Information Obtained Through the RSI?
A trader may use RSI to identify trade signals and potential entry and exit points for its trades. If the RSI is indicating that a stock is overbought, a trader could short-sell the security with the expectation that its price collapses so he can take a profit from the transaction.
On the other hand, if the RSI is indicating that a stock is oversold, a trader could take a long position on the security with the expectation that its price goes up during the next trading sessions.
The RSI can also be used in combination with other technical analysis metrics such as resistance and support levels that can also help the trader in confirming if the information obtained from the RSI is a sound trade signal or not.
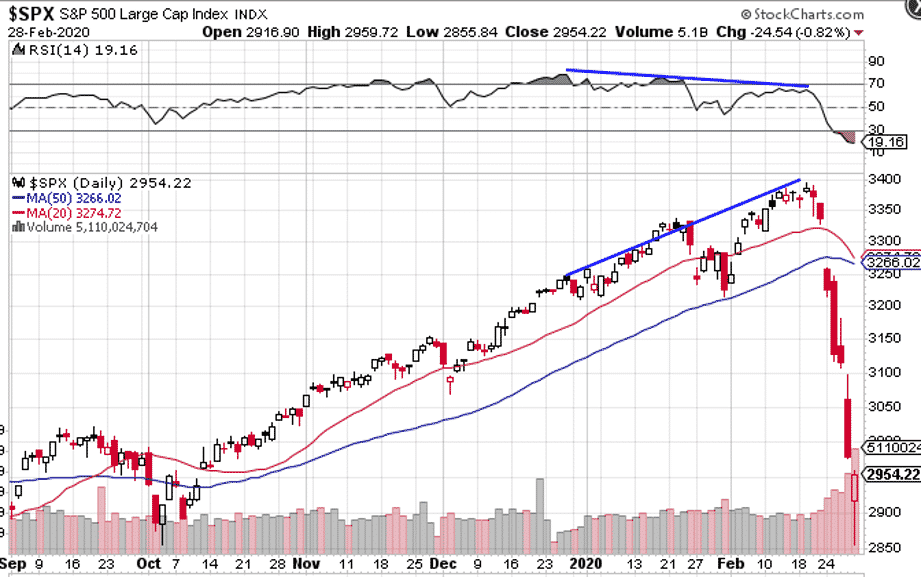
One of my favorite ways to use RSI is by spotting divergences. Below is a great example. As the index made successive higher highs, the RSI indicator started to make lower hights.
This indicates that the strength of the rally is fading, and look what happened next….
An Alternative View on RSI
I recently read a very interesting article on RSI that takes an alternative view to the traditional approach, so wanted to bring that to your attention here and open a discussion.
The author proposed the following approach:
- When RSI crosses above 60, it is a bullish signal
- When RSI crosses below 40, it is a bearish signal
This style would result in more of a trend following approach, and to be honest, I like it and think it has merit. Definitely something that warrants some further investigation.
Let me know below what you think.
Trade Safe!
Disclaimer: The information above is for educational purposes only and should not be treated as investment advice. The strategy presented would not be suitable for investors who are not familiar with exchange traded options. Any readers interested in this strategy should do their own research and seek advice from a licensed financial adviser.


