


The moving average convergence divergence MACD indicator is a trend following momentum indicator that shows the relationship between two moving averages of a stock price.
We can calculate the MACD by subtracting the 26-period exponential moving average from the 12-period EMA.
The output from this calculation is what is referred to as the MACD line.
After this is calculated, a nine-day EMA is placed on top of the MACD line which is called the signal line.
Some investors will choose to buy or sell a stock if the price rises above the signal line or buy short if the price falls below the signal line.
Below you can see some of the buy and sell signals. Some were better than others.
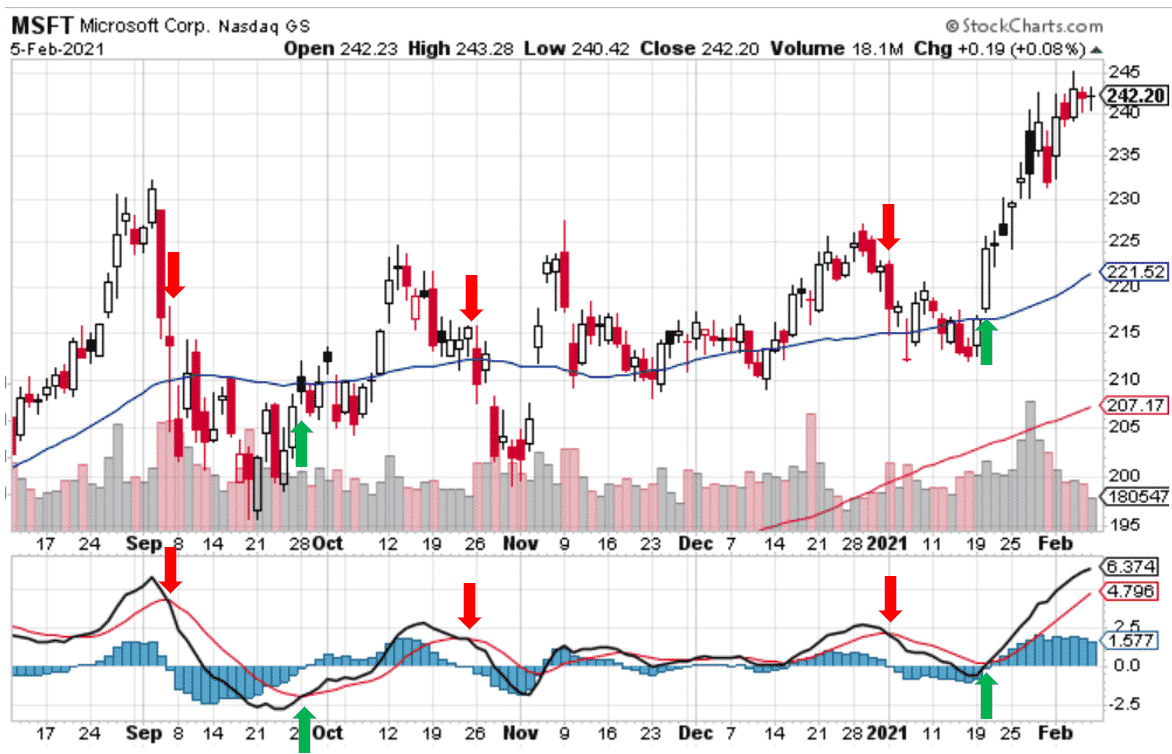
Personally, I like the MACD indicator, but I prefer RSI and Accumulation / Distribution to MACD.
Interpreting the MACD Indicator
There are many differing interpretations of the MACD indicator, and each investor can use their own discretion when selecting to follow the indications of the signal line.
Some investors see a problem with solely using the MACD to evaluate their purchase decisions as with divergence, it can often signal a possible reversal but then no such thing happens.
A false positive can often be produced.
Another problem is that divergence cant forecast every reversal, essentially, it predicts too many reversals that don’t occur rather than real price reversals.
A false positive can occur when the price of an asset moves sideways, such as what occurs in a range or triangle pattern.
Moreover, a slowdown in trading momentum can cause the MACD to pull away from its prior extremes and gravitate toward the zero lines.
There is often a question regarding whether MACD is a leading indicating or a lagging indicator.
To answer in simple words, it is a lagging indicator.
Foremost, all of the data used in calculating the indicator is based on the historical price fluctuations of a stock.
Since its largely based on historical data, it will always be lagging the price.
Despite this, some investors use MACD histograms to predict when a change might occur. When used in this instance, it can be classified as a leading indicator as future trends are being predicted.
Conclusion
MACD is a lagging indicator. Lets quickly compare leading and lagging indicators.
- A leading indicator is a tool designed to foresee the future movements of a market
- A lagging indicator is a tool that gives alerts once the price movement has already commenced
- Leading indicators often react to prices quickly, but a short fall of this is that it makes them prone to giving out false signals
- Lagging indicators can be more accurate but this is because they are far slower to react
Let me know in the comments, if you use the MACD indicator.
Trade safe!
Disclaimer: The information above is for educational purposes only and should not be treated as investment advice. The strategy presented would not be suitable for investors who are not familiar with exchange traded options. Any readers interested in this strategy should do their own research and seek advice from a licensed financial adviser.


