


At the time of writing, the world is being ravaged by the COVID-19 pandemic.
The U.S. has suffered record jobless claims numbering in the millions. Stock markets globally have had some of their fastest and sharpest declines in history, with the S&P 500 collapsing 35% in one month alone.
Meanwhile governments and reserve banks are launching unprecedented and coordinated monetary and fiscal stimulus packages worth trillions of dollars.
Now more than ever, investors need to keep a close eye on their investments, delving into more detail than they might usually do. Now is not the time to sit by passively as markets get whipsawed and unprecedented stimulus packages are being deployed.
The flow of stimulus measures as well as government policies (like border controls) are impacting different stocks in different ways and this is starting to show up in some very interesting dynamics which might provide a clue as to how the big professional firms are positioning their portfolios.
Everything Is Not As It Seems
It’s not enough to simply look at the closing prices for the day or week to make an assessment of what’s happening in the market.
Intraday performance is just as important, offering clues as to what may be going on under the hood.
On February 19th the S&P 500 hit its intraday high.
Over the course of the next six weeks it plummeted 35.4% before rebounding slightly to finish down 25%.
What’s interesting is not the final number, but what happened in the markets during each trading day.
If you delved into the data, you’d see that most of the selling over the six week period actually occurred at the open which saw the largest price declines.
It was so consistent that you could buy at the open and sell at the close every day and rather than a 25% loss after six weeks, you’d have made almost 5%!
What this means is that many investors were gripped with fear and panic and rushed to sell at the open, but this was being absorbed by buyers in sufficient amounts to push prices back up by the close.
The best way to see this in action is by comparing Accumulation/Distribution to the On Balance Volume of an index fund, such as the SPY (which tracks the S&P 500).
Accumulation/Distribution vs On Balance Volume
If you were to look at the On Balance Volume over the past six weeks, you would see it match the market’s price action – i.e. it would rise and fall roughly the same way the S&P 500 did.
This is because On Balance Volume only considers whether prices closed higher or lower from the previous day and does not concern itself with what happens on an intraday basis.
For example, if the SPY was at 280 today, opened at 230 tomorrow, but ended up closing at 278, the On Balance Volume would signal a big drop due to so much volume and such a small price decline.
In contrast however, the accumulation/distribution graph considers what happens during the day as well.
Using the previous example, it means that the accumulation/distribution graph would go higher, as there was a drop of $50 at the open, but it recovered to close at only a $2 drop. This indicates significant accumulation and is considered a very bullish signal.
If we were to review the performance of the SPY over the past six weeks, in light of what we’ve just learned, we can see the price has gone from about 335 in February to about 275 in mid-April.
During this time the On Balance Volume fell significantly as well, closely mirroring the price action of SPY.
Looking at the accumulation/distribution graph paints a very different picture. After an initial small dip it actually went up and appears to be in a slight uptrend. This indicates significant accumulation occurring as investors buy up shares that fall heavily at the open.
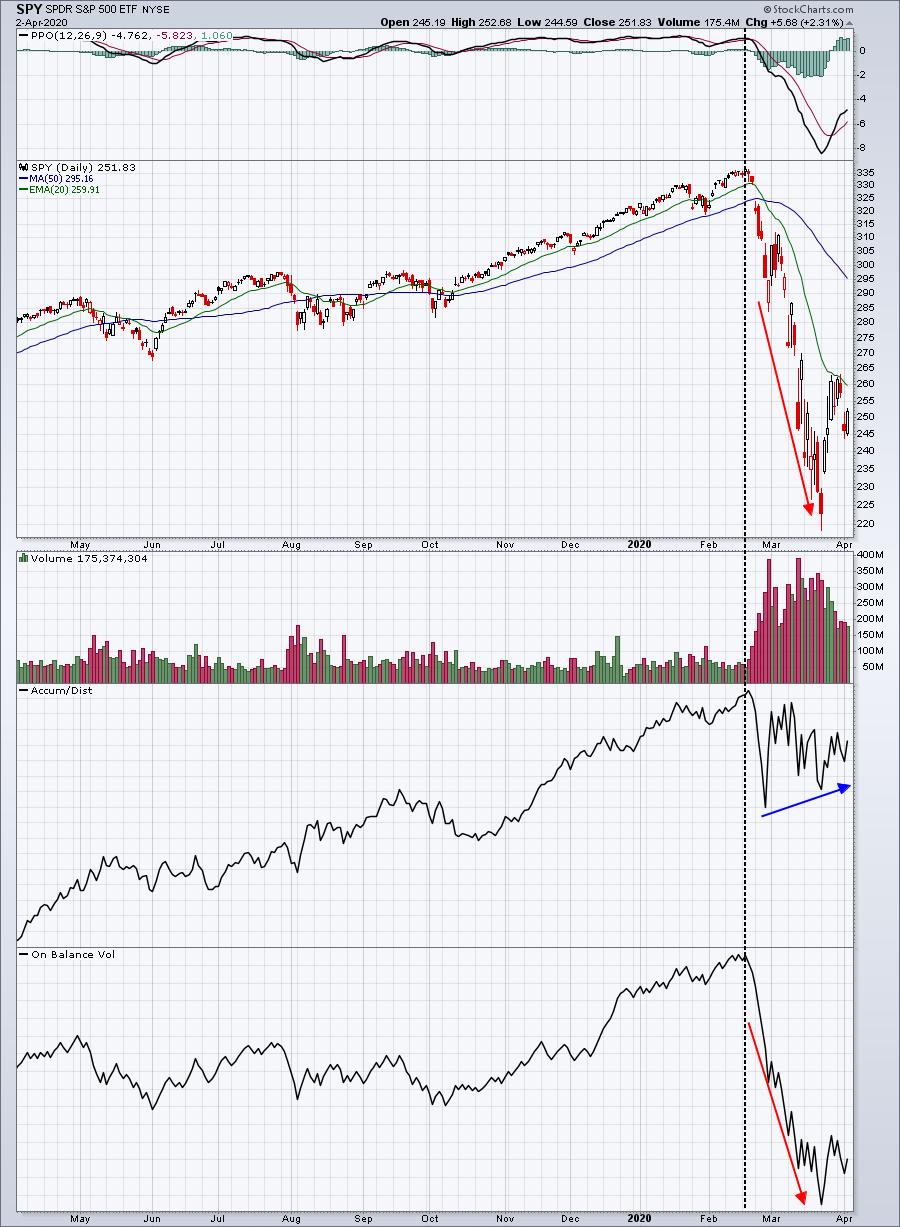
Image Credit: Tom Bowley
This is a very important signal to keep in mind. When looking at other instances in the past, whenever Accumulation/Distribution diverged from On Balance Volume, there was usually a rapid acceleration to the upside.
This happened several times to the SPY over the past 5 years. By paying attention to this relationship investors can get a very useful insight as to whether a selloff is sustainable or not.
When we look at a stock like BA, we can see that as price has fallen, so too has On Balance Volume and the Accumulation/Distribution line.
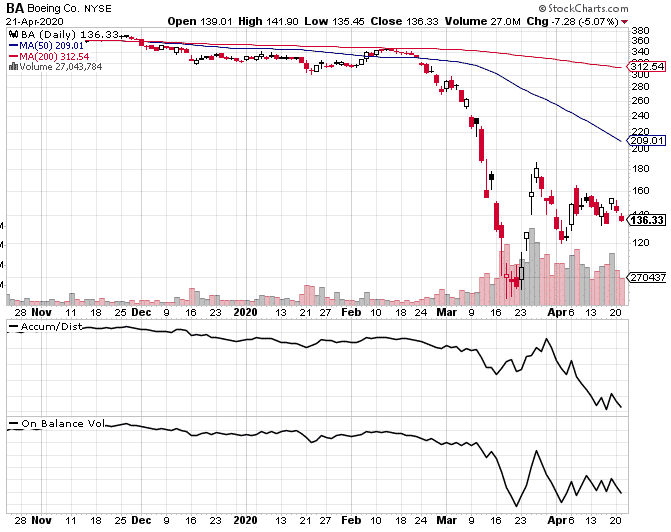
I wouldn’t be surprised to see BA continue to underperform the S&P 500 here.
Conclusion
On Balance Volume considers closing prices only, while Accumulation/Distribution also factors in intraday performance.
By comparing the two, investors can get an idea of whether the intraday price action is signalling that accumulation is occurring – a bullish signal for stocks.
While no technical signal is guaranteed to always be right, contrasting Accumulation / Distribution to On Balance Volume shows a strong correlation between price performance and divergence.
By looking at situations where extreme divergence occurs, investors can use that as an insight into whether any selloff is likely to be sustained and then position themselves accordingly.
Trade safe!
Disclaimer: The information above is for educational purposes only and should not be treated as investment advice. The strategy presented would not be suitable for investors who are not familiar with exchange traded options. Any readers interested in this strategy should do their own research and seek advice from a licensed financial adviser.


