


There’s an age-old saying on Wall Street called “the trend is your friend.” Many traders try and find trends as they develop so that they can ride it for as long as possible.
However, no trend ever goes on forever. Eventually market appetite will shift and there will be a reversal in the trend direction.
For traders this presents a dilemma when there is weakness in the price. If they hold on, it may turn out that a sustained shift in the trend direction occurs and the trader will lose money.
Alternatively if a trader closes their position at the first sign of price weakness, it may turn out to be nothing but a short pullback and the trader has been “shaken out”, meaning they lose out on making money as the long term trend resumes.
In hindsight it’s easy to tell if there was a genuine trend reversal or merely a pullback. The question for traders is how they can figure it out in the moment, so that they can close early if it’s a trend reversal or hold on if it’s simply a pullback.
This is where the Fibonacci Ratio comes into play. Fibonacci ratios are a popular tool used by technical traders as a way to identify areas where a pullback in prices might be occurring. This article will explore what Fibonacci Ratios are, how you find them and how you can use them in your trading.
What are Fibonacci Ratios?
During the 13th century, an Italian mathematician named Leonardo of Pisa, introduced a number series that went like this:
0, 1, 1, 2, 3, 5, 8, 13, 21, 34, 55…
Named after Leonardo’s nickname ‘Fibonacci’, the Fibonacci sequence is derived by taking the sum of the two numbers before it. So, in the below Fibonacci sequence, we find X by adding 5 and 8 together:
0, 1, 1, 2, 3, 5, 8, X?
X = 5 + 8 = 13.
The curious thing about the sequence is that as it progresses, each number is approximately 61.8% of the next number, 38.2% of the following number and approximately 23.6% of the number after that.
This repeating pattern forms what is called the Fibonacci retracement levels, with one addition – 76.4, which is found by subtracting 23.6 (the last Fibonacci retracement level) from 100.
The reason this odd sequence of ratios became so well known is that both Fibonacci and scholars discovered that the sequence repeated itself in many spiral shapes found throughout nature such as flowers and seashells. It was even found in some constellations!
Specifically, whenever there’s a spiral in nature growing outward, it tends to do so at a rate that’s roughly the same as the percentages found in the Fibonacci ratios.
Due to its prevalence in nature, some people believe that it also extends to human behavior as well. They believe that as a trend changes, people become uncomfortable and will adjust their behavior so that it slows down or reverses.
Some traders try to exploit this potential psychological behavior by using Fibonacci ratios to serve as a guide to identify whether a trend has broken down completely or is merely experiencing a temporary pullback.
How Traders Use Fibonacci Ratios
Once a trader has identified a stock that is trending very strongly, they will be on the lookout for confirmation of that ongoing trend so that they can ride it for as long as possible.
Traders that use Fibonacci Ratios believe that trending stocks will experience a pullback at one or more of the ratio levels, namely 23.6, 38.2, 61.8 or 76.4. Although not a Fibonacci Ratio found by the Fibonacci sequence, traders will often use 50 as well.
For example, if a stock were to increase from $100 to $110, the trader would expect one or more pullbacks of $2.36, $3.82, $5.00, $6.18 or $7.64.
To find the pullback values, just take the price difference (in this case $10) and multiply it by each of the ratios.
For example, the first pullback could be at $10 x 23.6% = $2.36. The second at $10 x 38.2% and so on.
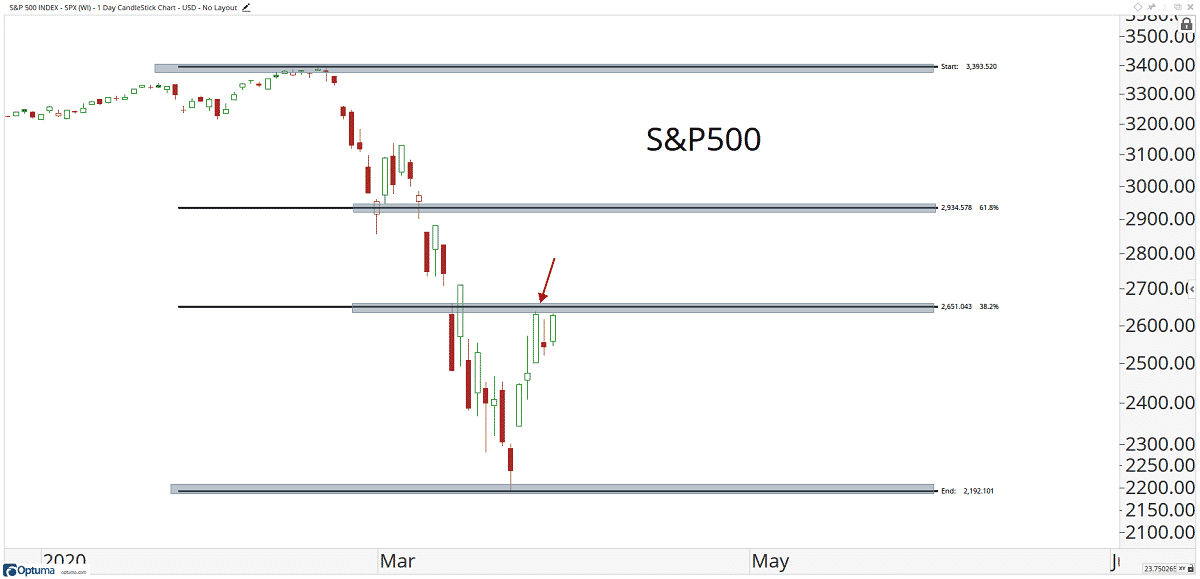
Image Credit: J.C. Parets
There’s a degree of subjectivity required when applying Fibonacci Ratios as it requires selection of your start and end point, which is unlikely to be the same across all traders.
Nonetheless, it is most commonly used as a means for understanding areas of strong resistance and support.
For traders, they can use this as a way to enter or exit a trade.
At the very least, since there’s no guarantees that prices will reverse at a particular Fibonacci Ratio level (or any level for that matter), it can serve as price levels to exercise extra caution.
Conclusion
Fibonacci Ratios are derived from the Fibonacci sequence, which has been repeatedly found in nature when looking at the growth rate of spirals.
The original Fibonacci Ratios are 23.6, 38.2, 61.8 and 76.4, with 50.0 also being used by traders.
By taking the Fibonacci Ratios and applying them to a strong trend, traders are able to identify strong areas of support and resistance which could signify a pullback.
Owing to the subjective nature of using Fibonacci Ratios (no two traders are guaranteed to use the same start and end points), there is no guarantee that any or all of the ratios will result in a pullback.
As a result, traders are advised to proceed with caution. Combining them with other forms of analysis can make Fibonacci Ratios a useful guide for potential entry and exit points as well as areas of high risk.
Trade Safe!
Disclaimer: The information above is for educational purposes only and should not be treated as investment advice. The strategy presented would not be suitable for investors who are not familiar with exchange traded options. Any readers interested in this strategy should do their own research and seek advice from a licensed financial adviser.


