


Today, we have a special treat for you, a Candlestick Pattern Cheat Sheet.
The image is below, and you can right-click to save it as a pdf.
Contents
Introduction
Technical charts are a two-dimensional representation of price over time.
There are various types of charts, from line charts, bar charts, and candlestick charts.
While line charts help give us an overall movement of the stock, bar charts are more detailed and are suitable for demonstrating or spotting the classical price patterns.
In the next section, we will discuss the different types of candlesticks.
What are Candlesticks?
Candlesticks charts originated in Japan and are referred to as Japanese candlestick charts. These are the most popular type of chart patterns and are very versatile.
The candle represents price movement.
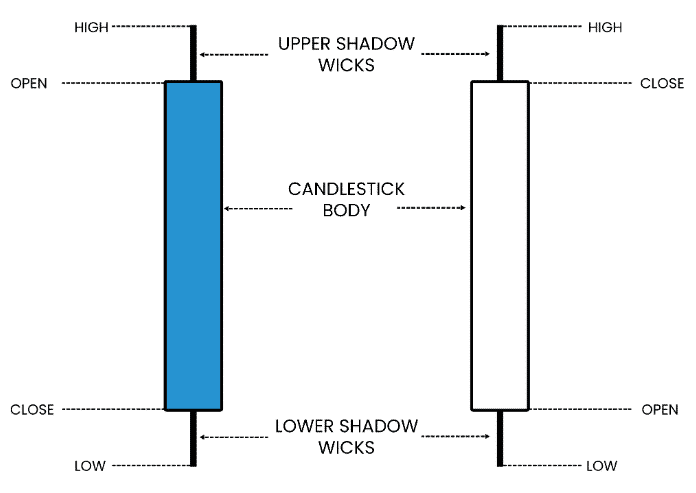
Each candle has a body and two wicks.
The body of a candle represents the distance between open to close, and the upper and lower wicks represent the highs and lows of a candle.
If the close price is below the open price, then the candle is red (we have used blue above to match our branding).
If the closing price is higher than the open price, then the candle is green or white.
Candlesticks charts help in adding visual clarity.
Moreover, two or more candlesticks create patterns that enable a trader to make decisions on the market’s direction.
Several continuation and reversal patterns give a strong signal and assist in making successful trades.
Candlestick Charts
Candlestick chart patterns are the distinguishing formations created by the movement in stock prices and are the groundwork of technical analysis.
Technical Analysts and Chartists globally seek to identify chart patterns to predict the future direction of a particular stock.
Patterns can be simple as trendlines and can get even complex, like double head and shoulder formations.
Reversal Patterns
They are chart patterns that signal a trader about a change in an existing trend.
They signify periods where the bulls and bears could not drive the market in a particular direction.
Continuation Patterns
They are chart patterns that display a temporary interruption in an ongoing trend, and after a short period, the trend continues in the original direction.
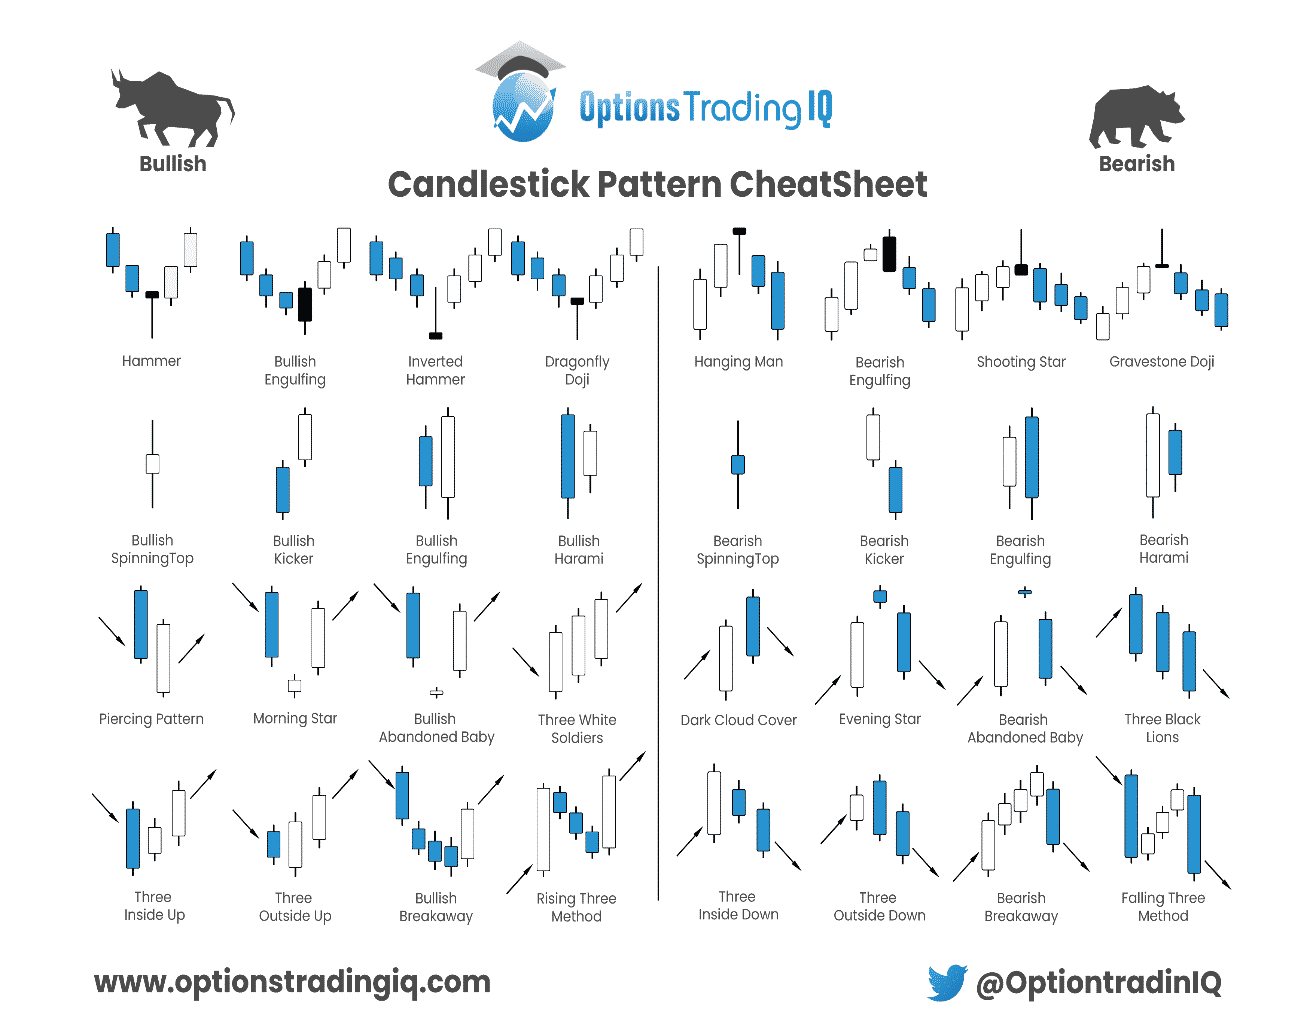
Right-click the image below to download the candlestick patterns cheat sheet pdf.
Candlestick Patterns
Candlestick patterns are separated into bullish and bearish patterns.
Bullish patterns indicate that prices are likely to rise whereas, bearish patterns suggest that prices are going to fall.
From the diagram above, we will study some candlestick patterns to aid you in gaining a clearer idea of how studying these patterns are helpful in the early identification of trends.
Bullish Reversal Patterns
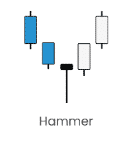
The hammer candlestick pattern occurs in a prolonged downtrend.
The candle formed in this process should have a small body and a prominent lower shadow.
The color of this candle can be either green or red.
If it is green, the hammer is bullish. If the stock moves higher after the hammer, the ideal strategy would be to go long with a stop loss below the candle’s low.
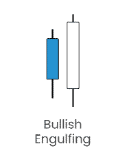
The bullish engulfing pattern can usually be found in a downtrend.
We should see a red candle, followed by a green candle.
The body of the green candle needs to engulf or be slightly bigger than the red candle.
If the price starts moving up after the next few candles, that is a clear indication that this pattern is confirmed.
The strategy would be to go long and place a stop loss below the low of both the candles.
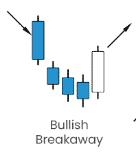
The bullish breakaway pattern is usually formed at the end of a bearish move.
This pattern is a trend reversal and translates into a bullish trend.
However, there is a chance that the trend might not reverse quickly, and ideally, the trader should wait till a larger green candle appears to confirm this pattern.
We follow the same strategy as before, go long once the pattern is confirmed with a stop loss from the point where the price increases.
Other Bullish Candlestick Patterns
Other bullish candlestick patterns include:
Dragonfly Doji
The Dragonfly Doji has no upper wick, a very small or nonexistent body, and a long lower shadow. It forms when price opens, sells off sharply during the session, then recovers to close near the open — signalling that sellers tried to push price down but buyers regained control. It appears most meaningfully at the bottom of a downtrend. Trade it by waiting for the next candle to close higher as confirmation, then enter long with a stop below the low of the Dragonfly.
Bullish Spinning Top
The Bullish Spinning Top has a small body with roughly equal upper and lower wicks, indicating indecision between buyers and sellers. When it appears after a sustained downtrend, it suggests selling momentum is fading and a reversal may be near. On its own it is a weak signal — wait for a confirming bullish candle before entering. Place a stop below the low of the Spinning Top.
Bullish Kicker
The Bullish Kicker is one of the most powerful single-session reversal signals. It forms when a red candle is immediately followed by a green candle that gaps up at the open and never enters the prior candle’s range. This sharp reversal in one session signals a dramatic shift in sentiment, often driven by unexpected news or earnings. Enter long on the close of the green candle with a stop below its low.
Bullish Harami
The Bullish Harami consists of a large red candle followed by a smaller green candle whose body sits entirely within the body of the prior red candle. The Japanese word “harami” means pregnant, which describes the visual well. It signals that bearish momentum is slowing and uncertainty is creeping in. Confirmation from the next candle closing higher is important before entering long, as the pattern alone is moderate in reliability.
Piercing Pattern
The Piercing Pattern is a two-candle bullish reversal found in a downtrend. The first candle is a long red candle, followed by a green candle that opens below the prior low but closes more than halfway up the body of the red candle. This shows buyers stepping in aggressively after an initial gap down. Enter long once the pattern is complete, with a stop below the low of the green candle.
Tweezer Bottom
The Tweezer Bottom forms when two consecutive candles have matching or near-identical lows — one red, one green — after a downtrend. The equal lows indicate a strong support level where sellers have twice failed to push price lower. It is a straightforward reversal signal: enter long above the high of the second candle with a stop just below the shared low.
Morning Star
The Morning Star is a three-candle bullish reversal pattern. It begins with a long red candle, followed by a small-bodied candle (which can be red or green) that gaps down, then a strong green candle that closes well into the body of the first red candle. The middle candle represents indecision at the low, and the third candle confirms the reversal. Enter long on the close of the third candle with a stop below the low of the middle candle.
Bullish Abandoned Baby
The Bullish Abandoned Baby is a rare but high-reliability three-candle pattern. It consists of a long red candle, followed by a Doji that gaps down and trades completely below the prior candle, then a green candle that gaps up away from the Doji. The isolation of the Doji — with gaps on both sides — signals a sharp and decisive sentiment shift. Enter long on the close of the third candle with a stop below the Doji’s low.
Three White Soldiers
Three White Soldiers is a strong bullish continuation or reversal pattern consisting of three consecutive green candles, each opening within the previous candle’s body and closing near its high. It signals sustained and organised buying pressure over multiple sessions. While it is a reliable pattern, entering after all three candles have formed means some of the move has already occurred — look for a shallow pullback entry or use the pattern as a broader directional signal rather than a precise entry trigger.
Three Inside Up
The Three Inside Up pattern starts with a large red candle, followed by a smaller green candle that forms inside the first candle’s body (a Bullish Harami), then a third green candle that closes above the high of the first red candle. The third candle is the confirmation — it validates what the Harami suggested. Enter long on the close of the third candle with a stop below the low of the first red candle.
Three Outside Up
The Three Outside Up begins with a small red candle, followed by a large green candle that engulfs it (a Bullish Engulfing), then a third green candle that closes higher still. Each successive candle confirms increasing bullish momentum. This is a relatively reliable three-candle reversal signal. Enter on the close of the third candle with a stop below the low of the engulfing candle.
Rising Three Method
The Rising Three Method is a bullish continuation pattern that forms during an uptrend. It consists of a long green candle, followed by three small red candles that stay within the range of the first candle, then another long green candle that closes above the first candle’s high. The small red candles represent a brief consolidation, not a reversal. Enter long on the close of the final green candle, treating the pullback as an entry opportunity within the broader uptrend.
Bearish Reversal Patterns
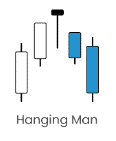
The hanging man pattern is a bearish reversal pattern and looks like a hammer candle we looked at earlier.
The only difference between the two is that the hanging man appears at the end of an ongoing uptrend.
If the color of the hanging man candlestick is red, it is a strong indication that a bearish trend is likely to start.
Once a trader confirms this pattern, they should take a short position and set a stop loss above the high of the candle.
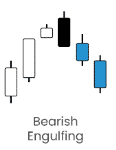
The bearish engulfing pattern is found in an uptrend. We should see a green candle which is followed by a red candle.
The body of the red candle needs to engulf or be slightly bigger than the green candle.
If the price starts moving down after the next few candles, that is a clear indication that this pattern is confirmed.
The strategy, in this case, would be to short the security once a trader has confirmed the pattern and place a stop loss above the two candlesticks.
The bearish reversal pattern is like a mirror image of the bullish reversal pattern.
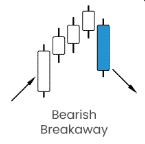
The bearish breakaway pattern is typically formed at the end of a strong bull rally.
This pattern is a trend reversal and migrates into a bearish trend.
Just like we saw in the bullish breakaway, there is a chance that even in this pattern, the trend might not reverse rapidly.
Preferably the trader should use other indicators to confirm the trend reversal.
Other Bearish Candlestick Patterns
Other bearish candlestick patterns include:
Shooting Star
The Shooting Star has a small body near the low of the candle, a long upper wick, and little or no lower wick. It forms when price opens, rallies sharply during the session, then gives back most of those gains before the close — signalling buyers ran out of momentum. It appears at the top of an uptrend. Enter short on the next candle’s open if it confirms by moving lower, with a stop above the Shooting Star’s high.
The Gravestone Doji is the bearish counterpart to the Dragonfly. It has a long upper wick, no lower wick, and the open and close are at or near the low of the session. Price tried to rally significantly but was completely rejected, closing where it opened. When it appears at the top of an uptrend, it is a strong warning signal. Wait for the next candle to close lower as confirmation before entering short.
Bearish Spinning Top
Like its bullish counterpart, the Bearish Spinning Top has a small body with roughly equal wicks, showing indecision. When it appears after a prolonged uptrend, it suggests bullish momentum may be stalling. It is a warning rather than a confirmed signal — look for the next candle to close lower before acting. Stop placement goes above the high of the Spinning Top.
Bearish Kicker
The Bearish Kicker is the inverse of the Bullish Kicker and equally powerful. A green candle is immediately followed by a red candle that gaps down at the open and never enters the prior candle’s range. The gap represents a sudden and decisive shift from buying to selling. Enter short on the close of the red candle with a stop above its high.
Evening Star
The Evening Star is the bearish counterpart to the Morning Star. It begins with a long green candle, followed by a small-bodied candle that gaps up, then a strong red candle that closes well into the body of the first green candle. The middle candle shows hesitation at the high, and the third candle confirms sellers have taken control. Enter short on the close of the third candle with a stop above the high of the middle candle.
Bearish Harami
The Bearish Harami consists of a large green candle followed by a smaller red candle whose body sits entirely within the prior green candle’s body. It signals that the uptrend’s momentum is fading, but like the Bullish Harami it is not a strong standalone signal. Wait for the next candle to close lower before entering short, and use it in conjunction with other indicators or a clear resistance level.
Dark Cloud Cover
Dark Cloud Cover is a two-candle bearish reversal pattern found in an uptrend. The first candle is a long green candle, followed by a red candle that opens above the prior high but closes more than halfway down the body of the green candle. The gap up followed by a reversal close signals that buyers initially pushed higher but sellers overwhelmed them by the close. Enter short below the low of the red candle with a stop above its open.
Tweezer Top
The Tweezer Top is the bearish mirror of the Tweezer Bottom — two consecutive candles with matching highs, one green and one red, after an uptrend. The matching highs indicate a strong resistance level where buyers have failed twice to push price higher. Enter short below the low of the second candle with a stop just above the shared high.
Bearish Abandoned Baby
The Bearish Abandoned Baby mirrors the bullish version exactly. A long green candle is followed by a Doji that gaps up above the prior candle and trades completely above it, then a red candle that gaps down away from the Doji. The complete isolation of the Doji signals a sharp reversal in sentiment. It is rare but highly reliable — enter short on the close of the third candle with a stop above the Doji’s high.
Three Black Crows
Three Black Crows consists of three consecutive long red candles, each opening within the prior candle’s body and closing near its low. It is the bearish counterpart to Three White Soldiers and signals sustained selling pressure across multiple sessions. As with its counterpart, by the time all three candles have formed the move is already underway — use it as a directional signal for the broader trend rather than a precise entry trigger, or wait for a relief rally before entering short.
Evening Star Doji
The Evening Star Doji is a variation of the Evening Star where the middle candle is specifically a Doji rather than just a small-bodied candle. The Doji in the middle position strengthens the signal, as it represents complete indecision at the peak before sellers take over on the third candle. Trade it the same way as the standard Evening Star — enter short on the close of the third candle with a stop above the Doji’s high.
Three Inside Down
The Three Inside Down is the bearish counterpart to Three Inside Up. It starts with a large green candle, followed by a smaller red candle inside it (a Bearish Harami), then a third red candle that closes below the low of the first green candle. The third candle is the confirming trigger. Enter short on its close with a stop above the high of the first green candle.
Three Outside Down
The Three Outside Down begins with a small green candle, followed by a large red candle that engulfs it (a Bearish Engulfing), then a third red candle closing lower still. Each candle confirms the prior bearish signal. It is a reliable three-session reversal pattern — enter short on the close of the third candle with a stop above the high of the engulfing candle.
Falling Three Method
The Falling Three Method is the bearish counterpart to the Rising Three Method — a continuation pattern found in a downtrend. A long red candle is followed by three small green candles that remain within the range of the first candle, then another long red candle closes below the low of the first. The brief green candles represent a shallow consolidation before the downtrend resumes. Enter short on the close of the final red candle, treating the small rally as an opportunity to join the existing trend at a slightly better level.
FAQ
What Is A Candlestick Pattern?
A candlestick pattern is a visual representation of price movements in a financial market, commonly used in technical analysis.
Candlestick charts display price action for a given time period using individual candlesticks that represent the opening, closing, high, and low prices.
What Are Some Common Candlestick Patterns?
There are many candlestick patterns, but some of the most common include doji, hammer, shooting star, engulfing, and harami. Financial Tech Wiz has some good information on doji candle types if you want to check it out.
Each pattern has its own unique characteristics and can indicate bullish or bearish market sentiment.
How Can Candlestick Patterns Be Used In Trading?
Candlestick patterns can be used in trading to identify potential trends and reversals in the market.
Traders can use candlestick patterns to make informed decisions about buying or selling assets based on the price action indicated by the patterns.
Where Can I find A Cheat Sheet of Common Candlestick Patterns?
Right here! Download the cheat sheet here.
Are Candlestick Patterns a Reliable Indicator of Future Price Movements?
Candlestick patterns can provide useful information about market sentiment and potential price movements, but they should not be relied on exclusively.
It is important to use other forms of analysis, such as fundamental analysis and technical indicators, in conjunction with candlestick patterns to make informed trading decisions.
Which Candlestick Pattern Is Most Reliable?
The Shooting Star candlestick pattern is a popular and reliable pattern that many day traders and investors use because it is accurate and predictable.
No candlestick pattern is 100% reliable, but some candlestick patterns are more accurate at predicting market movements than others.
Since investors are looking for consistency and accuracy, it’s certainly not a terrible idea to base some investment decisions on a reliable candlestick pattern like the Shooting Star candlestick pattern
How Many Candlestick Patterns Are There? (Note: We have 32 listed in our cheat sheet)
Depending on who you ask, there are between 30 and 35 stock market candlestick patterns that can predict market movements and use general technical analysis on a particular market.
Most candlestick patterns are categorized into a few different groups. Some patterns are designed to send reversal signals to investors, while other patterns may simply be a reaffirmation of the current market momentum.
This can also be called a continuation candlestick pattern.
Since there are more than 30 candlestick patterns that can be used for technical analysis and charting purposes, it can take some time to learn how to use each one to your advantage.
Do Candlestick Patterns Work?
One of the most common questions new investors ask is whether or not candlestick patterns can be effective?
While a candlestick pattern can’t be correct 100% of the time, some patterns have an excellent track record for predicting how a market might react in the future.
The best way to read into candlestick patterns and use them is based on the percentages.
As a general rule, candlestick patterns work between 55% and 65% of the time, which is generally pretty good.
Don’t forget that there’s still about a 40% chance of the candlestick pattern not working out.
These general analytics show us that strong candlestick patterns work more often than they don’t.
How Do You Read A Candlestick Pattern?
Day and swing traders must understand how to read various candlestick patterns to help them make split-second decisions in the stock market.
A candlestick on a trading chart consists of two wicks and two ends of the candlestick itself.
The top of the higher wick is the higher price within the market’s selected timeframe, while the bottom of the lower wick is the lowest price within the same timeframe.
Each end of the candlestick is also indicative of either the opening or closing price.
After multiple candlesticks start filling out a chart, a candlestick pattern can develop, which could give you an understanding of future market movements and the most likely outcome.
As electronic market trading continues to evolve and change, some of the most reliable candlestick patterns could become less advantageous, especially in changing market conditions.
Conclusion
Technical analysis is a widely used tool to attempt to predict stock price movement. It aids in taking advantage of the price discrepancies with the support of various indicators and patterns.
Some candlesticks that we studied above help give a trader an edge by early identification of an uptrend or downtrend.
There are many similarities, and at times some patterns can get confusing.
Therefore, it is advised that before directly making use of the candlestick patterns, traders should go through all the patterns and try to understand them virtually.
Doing so will drastically increase confidence and enable any trader to make accurate financial decisions when applying these concepts.
Perhaps even print out the candlestick pattern cheat sheet and have it on your trading desk.
Trade safe!
Disclaimer: The information above is for educational purposes only and should not be treated as investment advice. The strategy presented would not be suitable for investors who are not familiar with exchange traded options. Any readers interested in this strategy should do their own research and seek advice from a licensed financial adviser.


Thank you, Gav!
More about Chart Patterns:
http://thepatternsite.com/visualcpindex.html
Thank you Gav, your articles are always short, concise, and useful.
Thank you for giving this information which is important and easy to understand,it will help me in my work.