


A gravestone doji is a candlestick pattern that can signal the end of an uptrend.
It occurs when sellers push the daily price from the session high back down to the open price.
Contents
- Introduction
- Candlestick Charts
- What Is A Gravestone Doji?
- How Does The Gravestone Doji Form?x
- How To Trade Using The Gravestone Doji?
- When To Act?
- Hedging
- Profit Targets
- Some Review Steps
- Parting Thoughts
Introduction
Asset price charts can provide insightful indications about the future movement of the prices.
Several patterns are employed by the traders today and some of the most common ones include:
- Relative Strength Index
- Moving Averages
- MACD
- Oscillators
These indicators are not limited to just prices but also to volume, open interest for assets, and other variables.
They take a cue from the historical prices and pattern to predict the future which helps traders to enter or exit a trade.
Each of the indicators provides an idea about the trend. Trends are broadly classified into:
- Continuation trend where the current rise or fall is expected to be maintained.
- Reversal trend where the current trend is expected to switch direction.
Candlestick Charts
Candlestick charts have been used in Japan since the early 18th century much before the modern stock exchanges were established.
They help in the better visual representation of the data than the simple line charts.
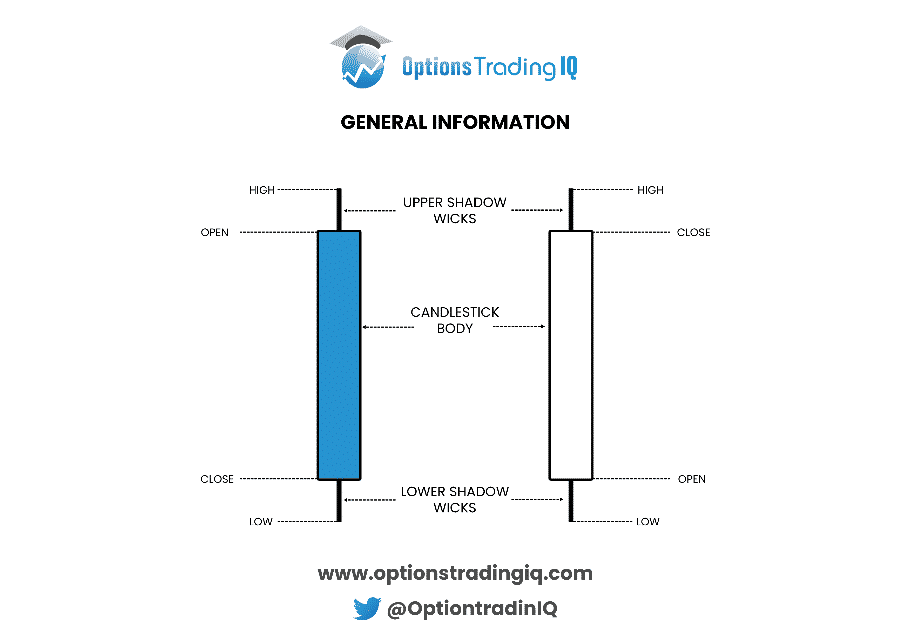
Candlestick charts are made up of candles, with a body of the candle and a wick of the candle.
- Wick – is the periodic range of the asset prices (vertical line)
- Body – is the difference between the opening and closing prices.
If the Open price is higher than the close price, this means that the prices fell in the period. For the fall in price, the body is either left hollow or colored in red.
Similarly, for a rise in price, the body is solid or green. Color coding makes it easier to identify on long charts.
What Is a Gravestone Doji?
The term gravestone djoi is derived from the shape of the candlestick which is like a Gravestone. “Doji” is a Japanese word which in this context means ‘rarity.’
The pattern is a reversal pattern where the rising price trend is reversed.
At the top of the pattern, the candlestick looks something like this:
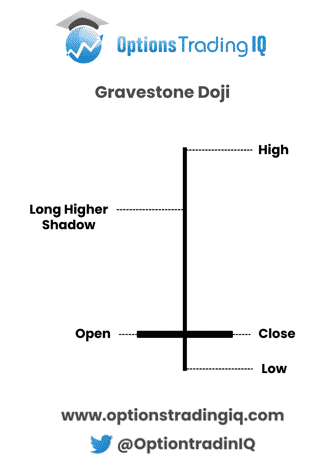
The open and close prices are similar or equal.
Price rises significantly during the day and falls back to the open price at the close.
The next day sees a fall in price signaling the bearish reversal pattern.
Opening and closing prices are arbitrary, and the color of the candlestick can be red if the closing price is slightly lower.
The pattern is visually like the gravestone seen from the sides and hence is named so.
To sum up, important points to benefit from a Gravestone Doji:
- Bearish reversal pattern.
- Enter a short position or exit a long position.
How Does the Gravestone Doji form?
The gravestone Doji is characterized by a long shadow which indicates a higher intraday price range.
This is how the market tests the price resistance for demand and supply of the given asset.
The pattern forms when the power dynamics between the bulls and the bears change. Before the pattern, the bulls are more active and push the price upwards.
After testing the resistance level, bears take control and the price falls.
The pressure from the bulls brings the equity to a level that cannot be sustained by the markets.
To restore the equilibrium, the bears become more active.
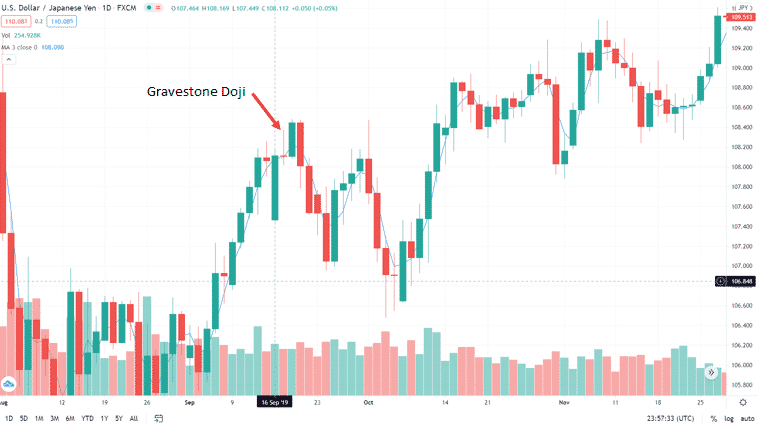
If we look at the price pattern for the USD/JPY, somewhere around 17th September 2019, a Graveyard Doji pattern seems to be forming.
The US dollar was gaining ground and was getting stronger against the Yen. However, after the 17th of September, the trend changed, and the pattern reversed.
You can make out the Graveyard Doji with a long shadow on that date after which the prices fall.
This was an indication to go long the Yen and short the US Dollar.
The resistance of dollar crossing around 108.40 Yen resistance was tested but could not cross it.
The bears took control, and the dollar started dropping thereafter.
How to Trade Using the Gravestone Doji?
A gravestone doji is not easy to find and identify.
This is because the open and close prices are rarely the same.
Traders would wait for one or two days to confirm the pattern. In our example, the next day saw a slight increase in prices and then the downtrend followed.
Now, this may reduce the risk, but you may lose out on significant gains because the prices may fall significantly the very next day.
Another indicator to watch out for while using a gravestone doji is the volume traded.
If the volume traded is significantly higher than usual, then the gravestone doji has a greater probability of reversing the trend.
When To Act?
As earlier indicated, you need to short.
The exact price point to short should be when the candle closes near the body.
The trigger target line is the base of the pattern where the horizontal line formation of the candle appears.
This will provide you with the most profit because at this point the trend reversal occurs.
However, if you need to wait a day or two to confirm the pattern, your profit will decrease.
As a trader, you may hesitate to trade until you confirm the pattern. What if the price continues to rise?
This is natural and therefore you should look out for other technical indicators such as RSI and moving averages.
Hedging
Like any technical pattern, the gravestone doji is also not fool proof. There is a risk that the trend may not reverse, and you would face significant losses.
To prevent losses, a stop loss should be used.
The most appropriate price level is at the highest point of the candlestick.
The highest point is the resistance level.
If the price breaks the resistance, then the trend is likely to continue, and the stop loss will limit losses.
Profit Targets
The size of the candlestick, from the base of the candle to the top of the wick is the size of the formation.
The profit target should be a price decrease of one (first target) or two (second target) times the size of the formation.
This would be measured from the base of the candle.
What determines the profit target?
When to have a target of one times the size of formation and when to have the target twice the size of the formation?
It is primarily determined by the volatility, the range or the wick of the candle, and the volume traded.
All these factors together combine to give an indication of the extent of the price target.
Again, with experience, it becomes easier to identify the same.
You should be on the lookout after the first target is reached. If the market conditions and volatility patterns are conducive, you may wait for the second target.
Some Review Steps
Technical indicators may be a lot of information to take in especially for novice investors. Therefore, we chart out few steps to help you with the Gravestone Doji formation.
- It is a bearish reversal pattern and is usually at the top of the bull run.
- A gravestone doji occurs because the bulls bring the price of the asset to unsustainable levels and to reach an equilibrium the bears take over.
- It seems as if you are looking at a gravestone from the side.
- To benefit from this, you need to short the asset/stock at the bottom of the candle (horizontal line in this case).
- To hedge your position, you need to include a stop loss for each Gravestone Doji. This should be placed at the top of the wick of the candle.
- There can be two price targets to benefit from the trade. They can be one or two times the size of the full candle.
- The price targets would be equal to the size of gravestone doji when the candlestick is long. The price target of twice the candlestick should be used for shorter gravestone dojis.
Parting Thoughts
You may think you have identified the pattern as soon as you see something like a gravestone doji forming on the live chart.
However, caution is the key. gravestone dojis can be confused with similar formations such as a shooting star.
The shooting star would only fall to the open price of the day or period.
In the heat of the moment, it is also possible to confuse it with other forms of doji such as the standard doji and other types. Again, caution is the key.
The pattern confirmation should also be complemented by other technical indicators especially the volume traded.
Trade safe!
Disclaimer: The information above is for educational purposes only and should not be treated as investment advice. The strategy presented would not be suitable for investors who are not familiar with exchange traded options. Any readers interested in this strategy should do their own research and seek advice from a licensed financial adviser.


