


A bearish engulfing pattern is a special candlestick pattern that signifies the breakdown in the momentum of an upward trend.
Most traders have heard the saying, “the trend is your friend”, and they try and trade the trend as best they can.
But all trends must eventually come to an end – the question for traders is being able to distinguish when this might occur so that they can either enter a new position or liquidate their holdings and protect their capital.
Few things worry investors as trying to sell out at the top, the time when profits can be maximized.
The Bearish Engulfing Pattern Can Signal A Reversal
While the market top is always obvious in hindsight, there are clues in market action that can signal a potential reversal of an upwards trend is occurring.
In particular, the bearish engulfing pattern is a time-tested and proven signal for capturing when an upward trend is reversing.
A bearish engulfing pattern is a specific set of candlesticks that when taken together, serves as a signal for traders.
The pattern is formed when there is a clear uptrend occurring and a small bullish candlestick is subsequently engulfed by a larger bearish candlestick.
The way it looks in practice is that on day one, a small bullish candlestick appears (the close is higher than the open), which is typically represented as a green or white candlestick.
The next day, a large, bearish candlestick appears (the close is lower than the open), which is typically represented as a red or black candlestick.
Bearish Engulfing Pattern Example
The key to the bearish candlestick is that its’ body is so large, that it completely engulfs the small bullish candlestick from the previous day.
The larger the body of the bearish candlestick and the smaller the body of the bullish candlestick, the stronger the signal is that a reversal of the uptrend is occurring.
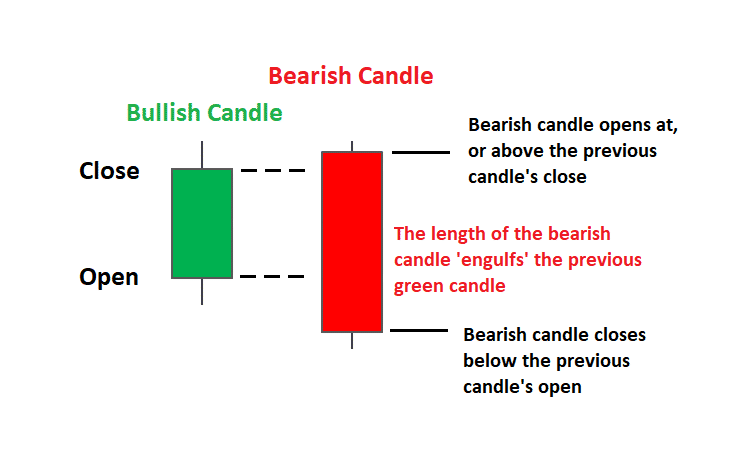
Image Credit: dailyfx.com
The reason the signal works is that it represents a breakdown in demand – a strong, engulfing candlestick overwhelms previous buying levels and signifies buyer exhaustion.
Of course, no signal is ever 100% accurate and so it is recommended to pair it with other data points.
For example, indicators that also track sentiment are commonly used, such as volume, RSI and stochastic indicators.
When using the pattern as signal to open a short trade, traders will also often wait for another one to two bars to see if the market confirms the signal before entering a new position.
This prevents them from getting stopped out in the immediate aftermath of a bearish engulfing pattern appearing, which is common in the first bar following the pattern forming.
Conclusion
A bearish engulfing pattern is a special candlestick pattern that signifies the breakdown in the momentum of an upward trend.
It is characterized by a small bullish candlestick being completely engulfed by the body of a bearish candlestick that immediately follows it.
The smaller the bullish candlestick and the larger the bearish candlestick, the stronger the signal that a reversal is taking place.
Like all indicators, it is never 100% accurate so it is best paired with other indicators and data points as part of a comprehensive and back-tested strategy.
Trade safe!
Disclaimer: The information above is for educational purposes only and should not be treated as investment advice. The strategy presented would not be suitable for investors who are not familiar with exchange traded options. Any readers interested in this strategy should do their own research and seek advice from a licensed financial adviser.


