


The bullish engulfing pattern is used to signify that a downtrend has lost momentum and that a reversal is highly likely.
Understanding technical patterns can assist traders and investors in finding trade setups, entry, and exit points, as well as to avoid or profit from changes in a trend.
This is especially important in highly volatile periods as prices can swing many percentage points rather quickly.
Volatility can have a profound impact on the profitability of a trade and even throw into question entire strategies (such as those that rely on small percentage changes in prices).
One of the most profitable trades is finding pivot points – when a prevailing trend is broken and a new trend direction is created.
Spotting these pivot points can be very difficult, particularly for downtrends.
There’s an old saying amongst seasoned investors – “don’t try to catch a falling knife”.
This is in reference to trying to time the bottom of a market.
While it is only possible to tell what the bottom of a market was in hindsight, it is possible to catch the bottom of a downward trend.
This is where the bullish engulfing pattern comes into play.
The Bullish Engulfing Pattern Can Signal A Reversal
A bullish engulfing pattern is a specific candlestick pattern that serves as a bottom reversal signal.
The pattern is formed when a downtrend is occurring, and a very large bullish candlestick completely engulfs the entire body of a bearish candlestick that was formed the previous day.
So on the first day, you would have a small bearish candlestick, which simply means that the closing price was lower than the opening price.
In most charting software a bearish candlestick will be shown as a red candlestick, while a bullish candlestick will be shown in green.
On the second day, you will be looking for a bullish candlestick, where the closing price is higher than the opening price.
However, it won’t be just any ordinary bullish candlestick, the one you need will have a large body that completely engulfs the bearish candlestick from day one.
Finally, provided this occurred in a downtrend, you have the criteria for a bullish engulfing pattern and you should be prepared for a likely reversal of the trend.
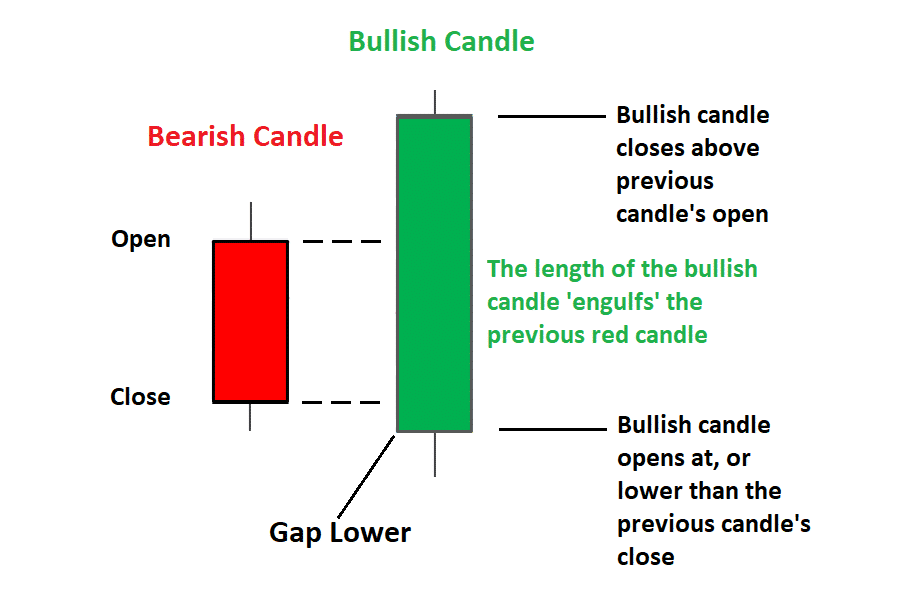
Image credit: dailyfx.com
The strength of the signal depends on the size of the engulfing candlestick.
This means that the bigger the engulfing candlestick, the greater the chances that a trend reversal is taking place.
Similarly, the smaller the bearish candle, the more it adds to the strength of the signal.
Conclusion
The reason this pattern is so widely used is because it is a relatively robust indicator of investor sentiment, namely that selling pressure has become exhausted and excess demand has come into play.
Typically, this indicator is paired with other indicators that can give additional confirmation of changing sentiment – examples include volume, stochastic, and RSI indicators.
However, like all indicators, the bullish engulfing pattern is never 100% accurate and so it should always be used in conjunction with a robust, tested strategy and appropriate position sizing and trade management.
Trade safe!
Disclaimer: The information above is for educational purposes only and should not be treated as investment advice. The strategy presented would not be suitable for investors who are not familiar with exchange traded options. Any readers interested in this strategy should do their own research and seek advice from a licensed financial adviser.


