


Today, we are looking at the choppiness index. What is it exactly and how can we use it?
Read on to find out.
Contents
- What Is Choppiness Index?
- Calculation Of The Index
- How To Read It?
- Interpreting The Choppiness Index
- Lessons Learnt
What Is Choppiness Index?
We all know that volatility is one of the most important pillars in financial markets. In simple words, volatility refers to the upward and downward price movements of a financial asset.
The movements are due to several factors including demand and supply, sentiment, corporate actions, greed, and fear, etc.
The Choppiness Index is like a volatility indicator which tells whether a market is choppy or trading sideways or is the market following a certain trend.
This index will give a trader a confirmation on market conditions, although this indicator cannot be used to predict future prices but gives a great indication of present market conditions.
This index lies between a range of 0-100 and values close to 100 indicate choppiness whereas values closer to 0 indicate a trending market.
When we are in the choppy phase, it gets tedious to predict in which direction the prices will move, therefore it is advised to hold the trade until a clear direction of the market can be established.
This indicator has a plethora of uses from forex markets to commodities and lastly the equity markets.
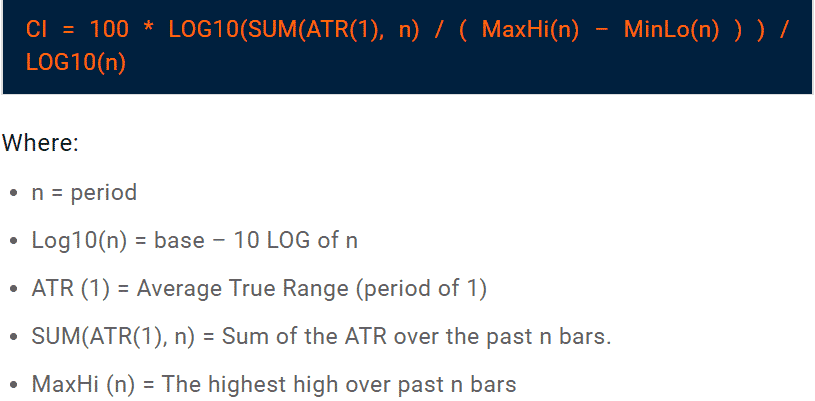
Calculation Of The Index
Choppiness Index uses concepts of fractal geometry which make it difficult to compute this index. The calculation is as follows: –
How To Read It?
When analyzing the Choppiness Index, it is shown by a line that is rangebound between 0 – 100, there are two main thresholds of 61.8 & 38.2, when the line is above 61.8 market is in a consolidation phase.
When the level falls below 38.2 it gives an indication that the current trend is likely to continue.
This indictor can be used on a standalone basis but it is advisable to use it with other technical indicators like the Relative Strength Index (RSI) and Moving Averages for more accurate predictions and avert the chances of a false breakout.
Interpreting The Choppiness Index
Choppiness Index is a great tool for analyzing a trend or predicting a breakout, it complements other technical indicators really well and helps a trader make the most appropriate decisions.
Some examples on how to analyze this index are: –
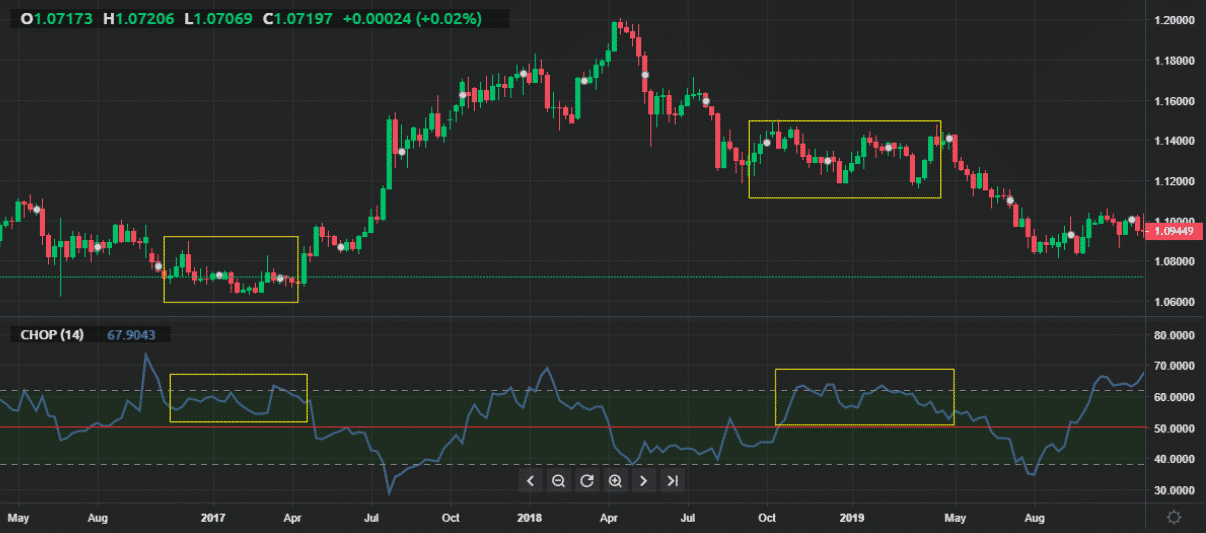
Source: Currency.com
In the chart above we see at the points highlighted that the Choppiness Index line is close to the 61.8 threshold which indicates that the market is sideways or is in consolidation or doesn’t have any trend.
We can see that the price is moving sideways in that particular period suggesting that the market is choppy.
As mentioned earlier this index can also be used to predict potential breakouts, a breakout usually occurs when it has been in consolidation for a long time, sometimes it may be difficult to estimate at which point but, the Choppiness Index makes that a little simple to predict.
An example of a breakout is given below: –
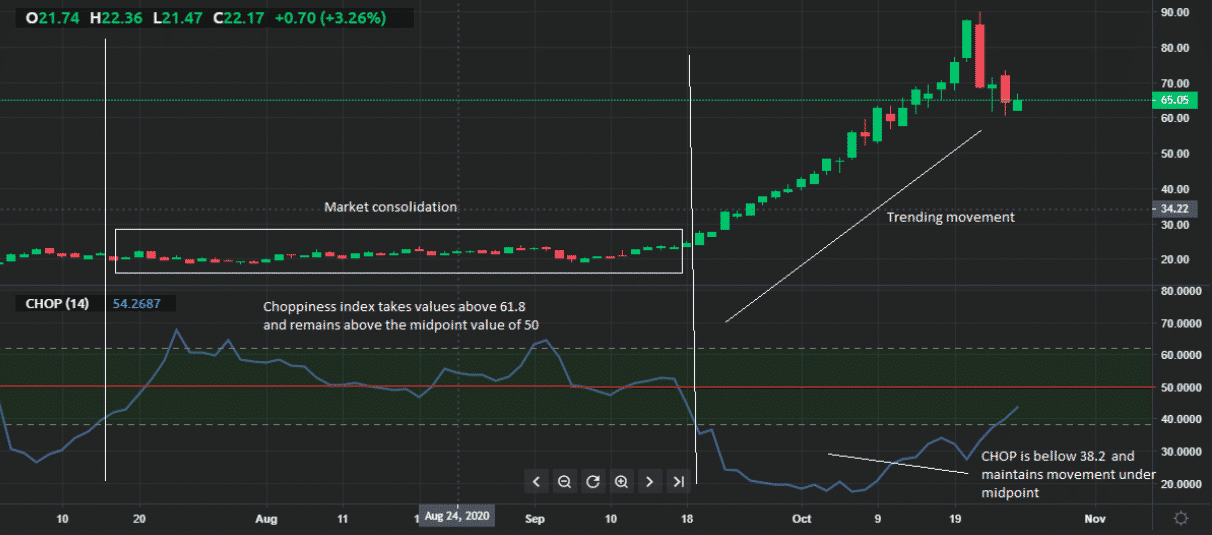
Source: Currency.com
As we can see above when the Choppiness line is above the midpoint of 50 and closer to the 61.8 level threshold the market stock is moving sideways.
But as the lines approaches the 38.2 level, we notice a trend starts and as the line moves closer to 0, it is a clear indication that the trend is getting stronger and is likely to continue for a while.
Lessons Learnt
This indicator is very simple to understand and is straightforward to apply, although one drawback of this indicator is that it doesn’t inform us whether a trend will continue or change it course.
This index is widely used by numerous traders to help them confirm market conditions, while this indicator is very useful it will not always yield accurate results when used on a standalone basis.
Therefore, combining its use with various other indicators will result in a successful trade.
Trade safe!
Disclaimer: The information above is for educational purposes only and should not be treated as investment advice. The strategy presented would not be suitable for investors who are not familiar with exchange traded options. Any readers interested in this strategy should do their own research and seek advice from a licensed financial adviser.


