


A natural question that traders coming to a new strategy often ask is, “How much can this strategy make?”
A better question is, “How much drawdown can this strategy suffer?”
A more realistic question traders should ask is, “How do I feel when I trade this strategy through its ups and downs?”
When it wins, am I disappointed by the amount?
Am I satisfied?
Do I wish more?
When it loses, am I still able to sleep?
Am I fine with it?
Or does it frustrate me to no end and cause me to want to abandon the strategy?
I can not answer the latter questions for you.
But I’ll try to rummage through the web to find some hard numbers to help answer the first two questions for the Rhino strategy.
Contents
Example Trades
In the Capital Discussion webinar where Rhino options strategy was first introduced to the public in 2015, Brian Lawson gave several trade examples:
Easy trade: 9.9% of planned capital in 34 days started July 2, 2015
Down move trade: 7.3% in 53 days started September 5, 2104
Up move trade: 6.5% in 54 days started on January 30, 2015
After normalizing the returns to monthly returns, the three trades returned 8.7% a month, 4.1% a month, and 3.6% a month.
But these were cherry-picked winning trades.
We want to get a general average that also considers some losing trades.
So, let’s look at the performance of the Rhino alert service that was run in 2016 and 2017. Brian Larson ran it in the first half of 2016 until Bruno Voisin then ran it.
These Were The Returns Posted For 2016:
Jan: 0.36%
Feb: -2.42%
Mar: 0.23%
Apr: 5.42%
May: 6.85%
June: 2.06%
July: n/a
Aug: 1.93%
Sep: 3.63%
Oct: 14.85%
Nov: 7.71%
Dec: n/a
Average return per month: 3.4%
Here Are The Posted Returns For 2017:
Jan: 4.50%
Feb: n/a
Mar: 3.62%
Apr: 4.80%
May: n/a
June: 0.92%
July: 0.63%
Aug: 1.53%
Sep: n/a
Oct: -5.00%
Nov: n/a
Dec: 0.50%
Average: 1% per month
Some months did not have any number posted because it is possible for no trades to be closed during that month.
The Rhino, a 77 DTE trade, can run longer than a month.
With a 3% return a month in a good year and a 1% monthly return in a not-so-good year, we can roughly say a 2% return a month is a ballpark number.
These numbers also show that the profit targets in the original rules are just that – targets. It doesn’t mean we will hit the profit target every month.
We have to take what the market gives us.
What Is A Good Year? What Is A Bad Year?
This begs the question.
What market conditions enabled the Rhino to do better in 2016 than 2017?
Looking at the weekly VIX chart, we see that volatility was lower in 2017 than in 2016.
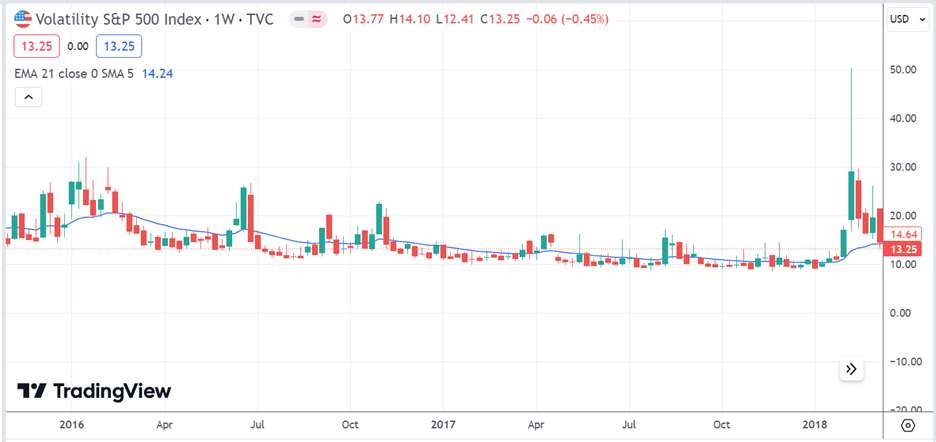
At some points in 2017, the VIX got down to 9.
Rhinos, butterflies, iron condors, and credit spreads tend to do better in higher volatility. Broken-wing butterflies cost less when implied volatilities (IVs) are higher.
Because we are selling options, we can not extract much money out of the market when volatility is low.
In a low volatility environment, the Rhino takes longer to reach its profit target, becoming a riskier trade as it gets closer to expiration.
This is also why some butterfly traders like to enter butterflies with longer days-to-expiration and exit the trade sooner during low IV environments.
Win Rate
The Rhino is considered a high-probability trade, with many more wins than losses.
From the results of the trade alert, we see that, on average, it has about one losing month per year, and the loss is not significantly larger than the average wins.
We can see that more clearly when Bruno showed his P&L spreadsheet in one webinar.
Taking the number of days in the trade along with his return on his planned capital of $25,000 per trade, I calculated the average monthly return of his Rhino to be 3.6% per month.
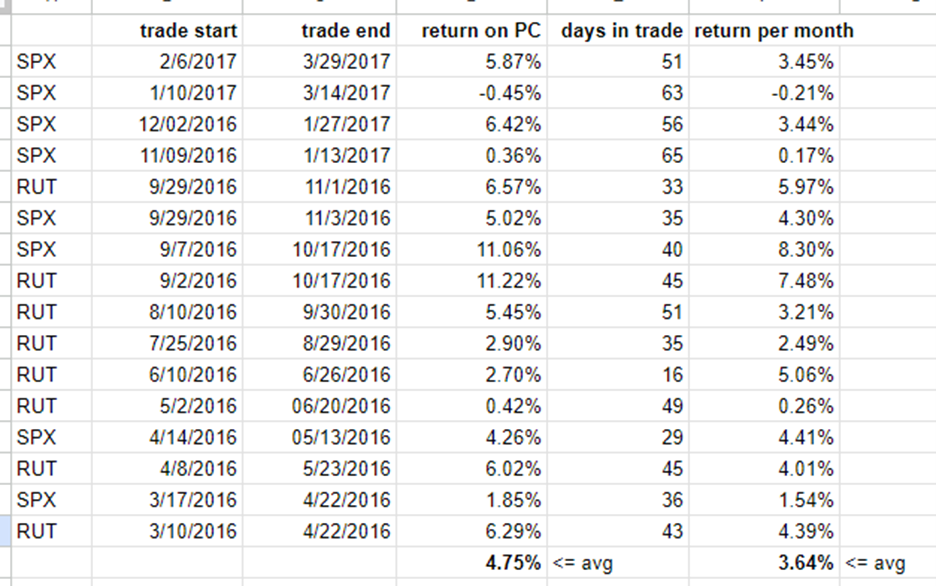
We are assuming a 30-day month.
The percentage return per trade is higher at 4.75% because many trades ran longer than a month.
What is remarkable is the win rate.
Of the 16 trades listed, only one had a small loss.
Fifteen wins out of 16 and one losing month out of twelve equate to having a win rate of over 90%.
Bruno’s results are quite good, considering that SMB Capital’s Rhino backtest averaged 2% per month during 2016.
Obviously, they traded the Rhino slightly differently, as every trader would.
Another difference is that Bruno’s numbers are from live trades, whereas SMB Capital’s were hypothetical simulation trades.
Below are SMB Capital’s hypothetical simulation trades of the Rhino with the following annual returns:
2018: 8.23%
2017: 21.31%
2016: 23.71%
2015: 36.08%
2014: 25.23%
That equates to an average monthly return of 1.9% per month.
Conclusion
Some of you may be thinking:
“Geez, an average of 2% a month with many months of sub-one-percent returns? That doesn’t sound very exciting.”
It is what it is.
This is the style of trading that is characteristic of the Rhino strategy.
Non-directional strategies such as this profit from waiting as time passes.
As such, it will not have returns as high as directional strategies.
In addition, the Rhino is a longer-term trade.
In terms of percentages, the returns compared to the capital required will be lower than shorter-term trades.
In other words, shorter-term trades have higher yields.
On the positive side, some strategies with returns on the low side also have low drawdowns; this is true of the Rhino, as you saw from some of the numbers.
For greater returns, one would need a strategy that is either directional in nature and/or with shorter DTEs (days-till-expiration).
But those will have higher drawdowns, lower win rates, and/or require you to be in front of the screen much more during market hours.
Once you become familiar with the 77-DTE Rhino, you can try shortening the duration to a 45-DTE or 30-DTE Rhino and see if you like those better.
Some people do, and some people don’t.
To get one thing, you have to give up another.
You have to find your middle ground.
There is a spectrum of strategies in between.
For example, the A14 is a shorter-term broken-wing-butterfly strategy that some people liken to a “mini-Rhino.”
It all goes back to the questions at the top of the article.
Given your lifestyle, you have to find a strategy with characteristics that fit your temperament and are tradable.
We hope you enjoyed this article on the Rhino strategy
If you have any questions, please send an email or leave a comment below.
Trade safe!
Disclaimer: The information above is for educational purposes only and should not be treated as investment advice. The strategy presented would not be suitable for investors who are not familiar with exchange traded options. Any readers interested in this strategy should do their own research and seek advice from a licensed financial adviser.


