


Contents
The Ichimoku Kinko Hyo is a trading system that comes from the East.
It was invented in the 1960s by a Japanese journalist named Goichi Hosoda, who went by the pen name of Ichimoku Sanjin.
In the West, it is better known as the Ichimoku Cloud indicator, which can be found in many trading platforms.
Upon first glance at the indicator, even the names of the parts are quite foreign:
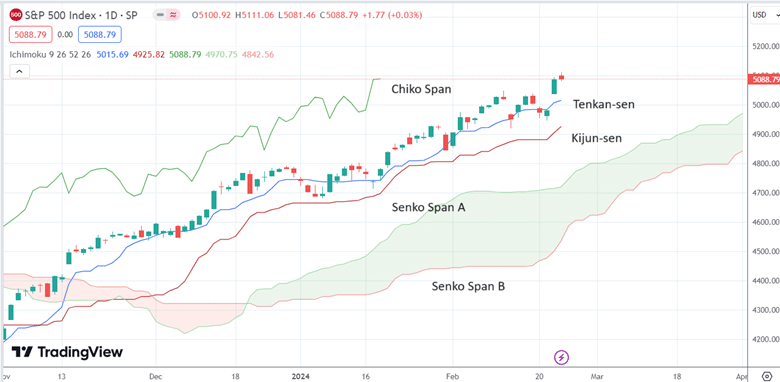
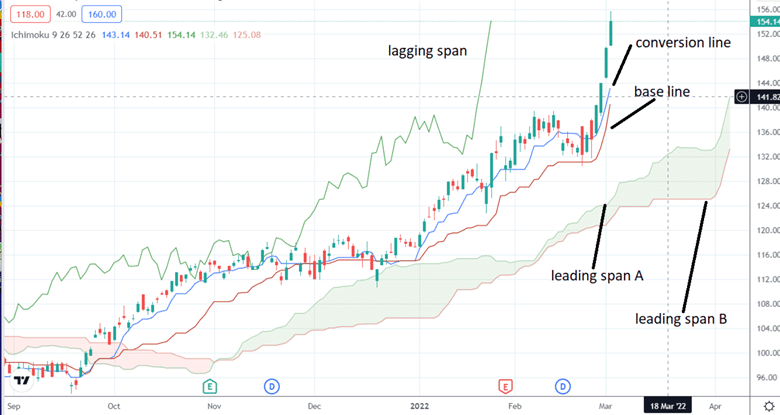
Translating the terms to Western names will make it less foreign:
However, the system uses many of the concepts we are already familiar with in the West.
Moving Averages
While the mathematical formulas are slightly different, the conversion line and the baseline are moving averages.
Think of the conversion line as a 9-period moving average.
The baseline is a longer-term 26-period moving average.
All the concepts of moving averages apply.
For example, if the price is above a moving average, the asset is bullish during that time frame.
And when the price drops below and breaks through a moving average, take warning.
Having two moving averages of different periods is a concept that we are familiar with.
The fast-moving average is the conversion line, which is the trigger line.
And the slower-moving average is the baseline.
A bullish asset will have its fast-moving average above its slower-moving average.
That is currently the case shown in the diagrams above.
The crossing of moving averages can be used as signals.
This is bullish when the fast-moving average crosses the up and above the slow-moving average.
This is bearish when the fast-moving average crosses down and below the slow-moving average.
In the West, we have a term called the “golden cross,” when the fast 50-period moving average crosses above the slower 200-period moving average.
The “death cross” is when the fast 50-period moving average crosses below the slower 200-period moving average.
MACD
Now, we look at the MACD indicator you may be familiar with.
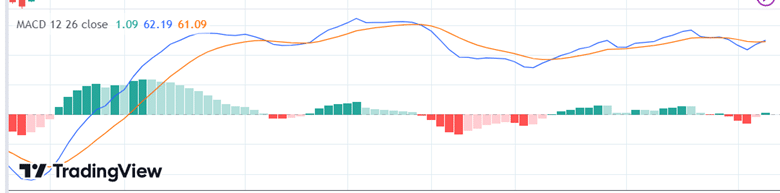
The blue line is the “signal line.”
The red line is the MACD baseline.
The crossing of the signal line against the baseline forms signals and is indicated by the histogram changing colors from green to red and vice versa.
In typical MACD settings, the red line is constructed by subtracting the 26-period EMA (exponential moving average) from the 12-period EMA.
The signal line is the 9-period EMA of the MACD line.
Take note of the numbers 26 and 9.
The 26 is the same number as the baseline period in the Ichimoku indicator.
The 9 is the same number used as a signal in Ichimoku and MACD.
A coincidence?
Or were there influences between the East and the West?
Lagging Span
The lagging span is a line chart of the closing price shifted 26-period back.
Look at the shape of the lagging span.
It is the same shape as the candlestick chart.
It just draws 26 candles behind the chart.
This is to be used as a visual guide to compare the price now to what it was 26 years ago.
Look back at the candlestick to a time in the past to see where the price was back then.
Then, look at the lagging span to see the current price.
If the lagging span is above the candlesticks, it is bullish.
When the lagging span is below the candlesticks, it is bearish.
Leading Span A and B
This is the part of the Ichomoku that has no Western analog.
Leading Span A is the average of the Conversion and Base lines drawn 26 periods ahead.
The Leading Span B is the midpoint of the highest and lowest prices over the last 52 days.
It is also plotted 26 days ahead.
The two lines form the cloud, green (bullish) or red (bearish).
If candlesticks are above the cloud, it is bullish. If below, bearish.
Conclusion
What may seem foreign at first is no longer foreign.
We hope you enjoyed this article on Ichimoku Kinko Hyo.
If you have any questions, please send an email or leave a comment below.
Trade safe!
Disclaimer: The information above is for educational purposes only and should not be treated as investment advice. The strategy presented would not be suitable for investors who are not familiar with exchange traded options. Any readers interested in this strategy should do their own research and seek advice from a licensed financial adviser.


