


Today, we’re looking at a moving average crossover strategy.
We will explain the strategy and do some heavy back testing.
Let’s look at the results.
Contents
- Introduction
- Moving Average Crossover Back Test Tools
- What Is The Basis Of A Moving Average Crossover Strategy?
- The Results
- How Does The Moving Average Crossover Strategy Lose Money?
- Shorten The Time Frame
- Triple Moving Average Crossover
- Bullish filter
- FAQ
- Conclusion
Introduction
You probably have seen many variations of the moving average crossover strategy and debates as to whether the strategy works or not work.
Today, we are going to run some backtests to show you some results, determine when it works, when it doesn’t work, and what possible tweaks you can try.
Moving Average Crossover Back Test Tools
To do this work, we are going to use the free “Web Builder” backtesting tool at wealth-lab.com
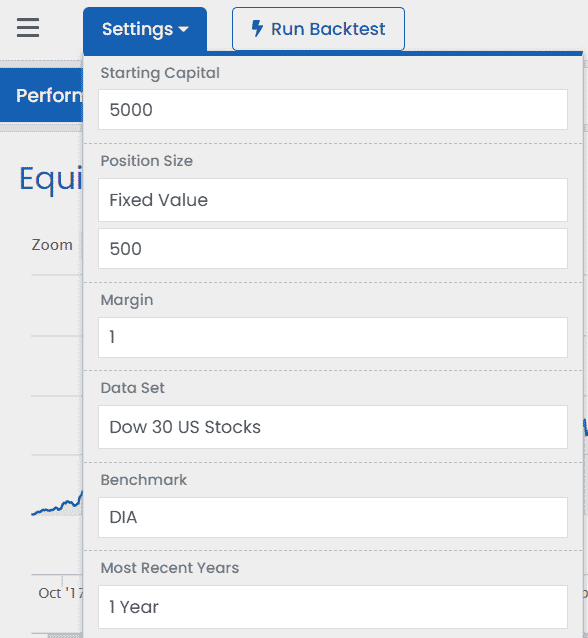
source: wealth-lab.com
We are buying $500 worth of a Dow Jones stock as one position.
Enter as many positions up to a planned capital of $5000 as long as the following criteria are met.
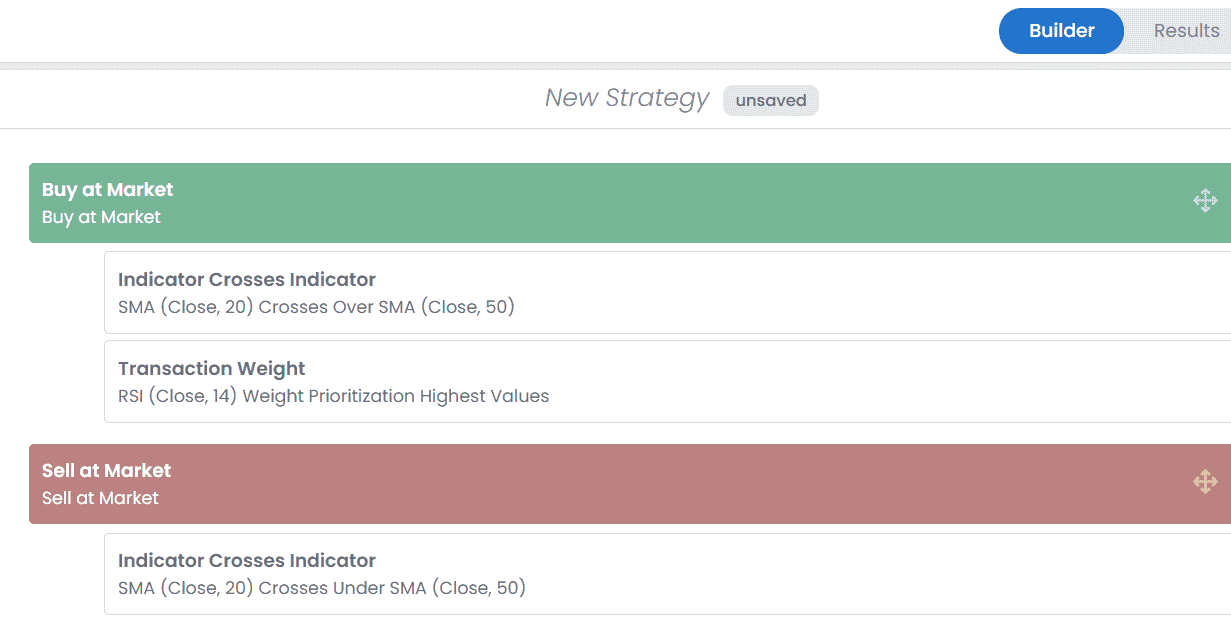
It says to enter the position when the 20-day simple moving average (SMA) crosses above the 50-day simple moving average (SMA).
Exit the position when the 20 SMA crosses below the 50 SMA.
The transaction weight condition is added to make the results reproducible.
If more stocks are triggered than available capital, which stock should the backtest use?
Instead of letting it pick at random, we tell it to use the stock with the highest RSI value.
What Is The Basis Of A Moving Average Crossover Strategy?
The basis of a moving average crossover strategy is to have a fast-moving average and a slow-moving average plotted on your chart.
In our example, the 20-period moving average is faster than the 50-period because the 20-period average is more responsive and stays closer to the price.
When the fast average crosses from below to go above the slow average, that is bullish.
When the fast average crosses the slow average from above, that is bearish.
In our example, this is a bullish strategy because we are triggering buys when the fast is crossing above the slow average.
The Results
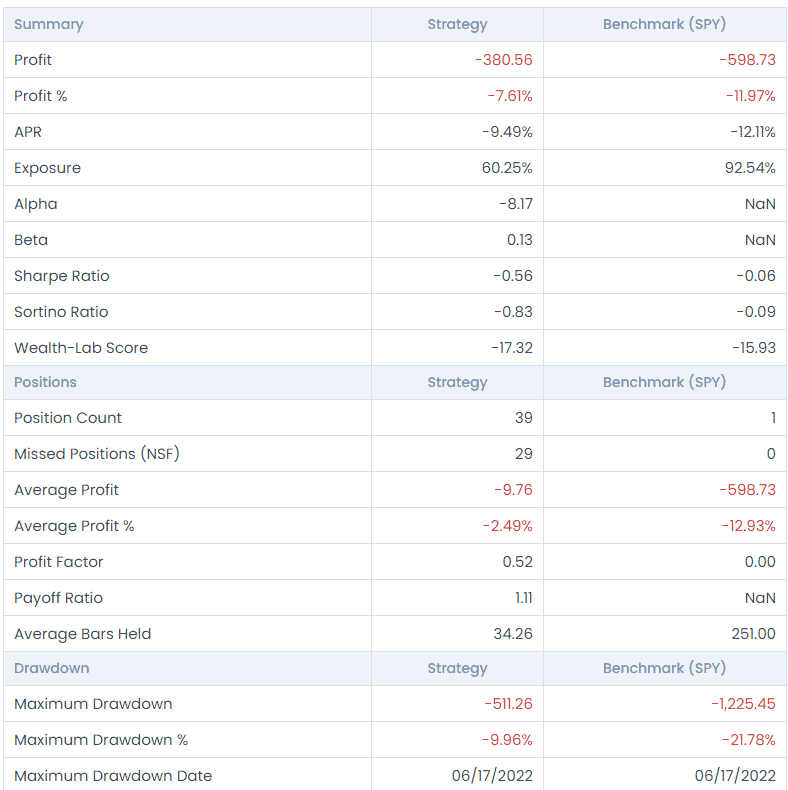
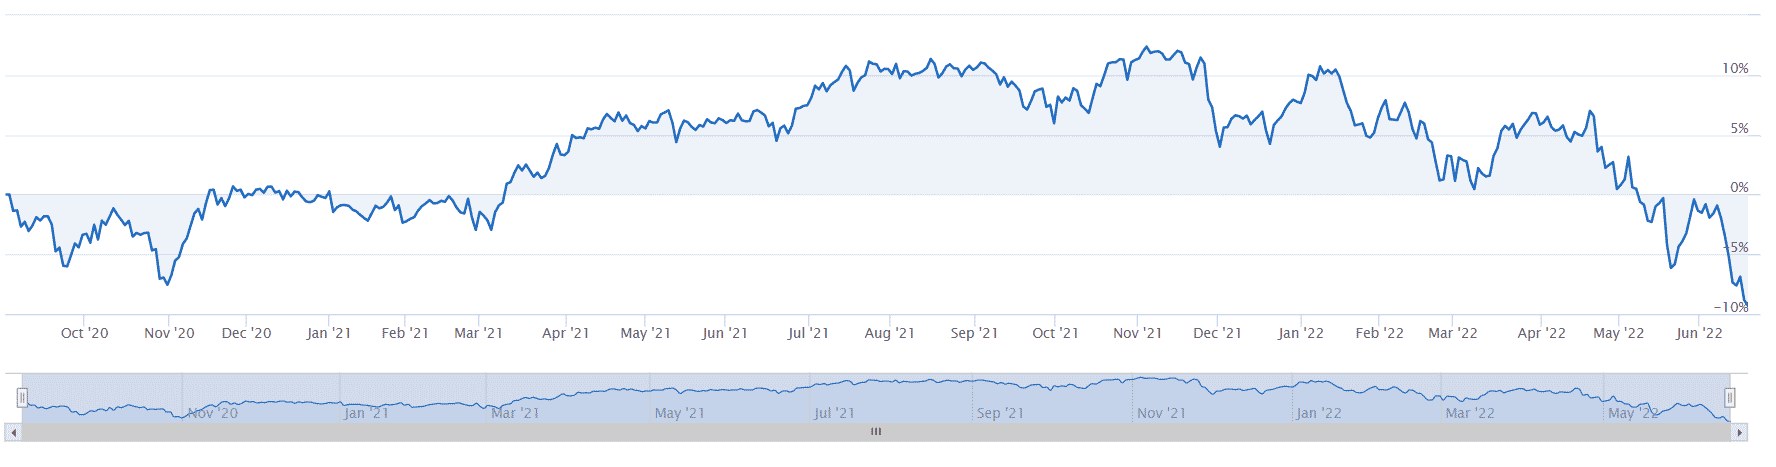
The equity curve is negative when this backtest is run over the past 12 months, from Aug 31, 2021, to June 17, 2022.
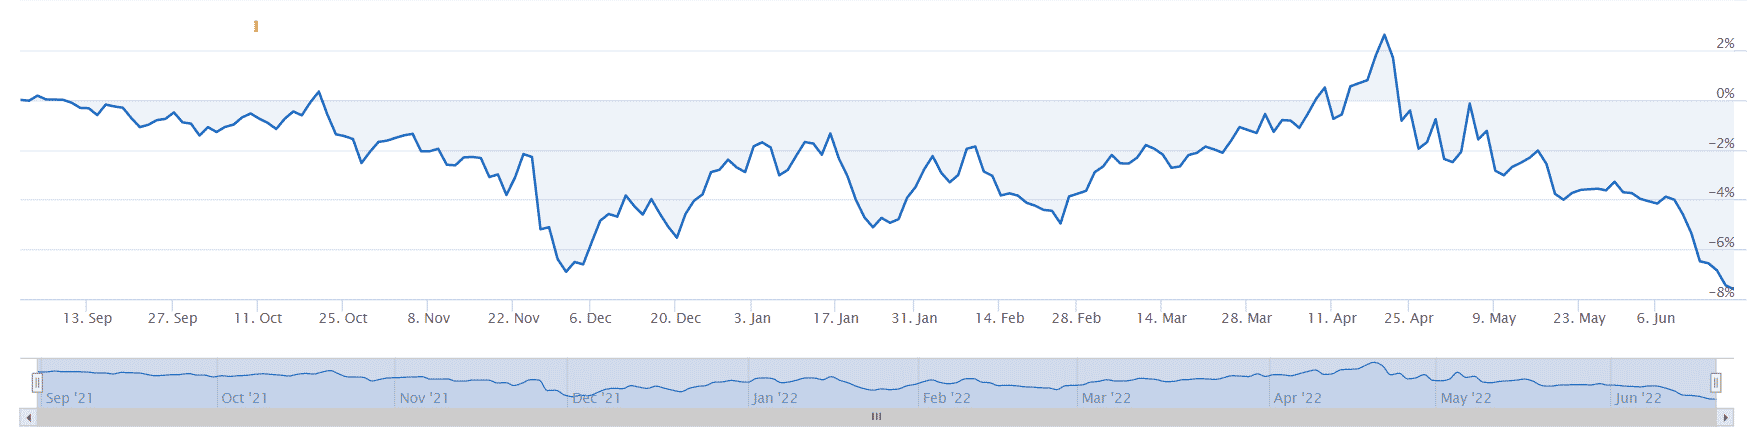
The strategy lost money during that time.
But when compared to buy-and-hold of the Dow stock ETF (DIA) during that same period, it did about the same with perhaps a slightly smaller drawdown.
The bullish strategy was losing money because the market was bearish during those 12 months.
Perhaps it had a bad losing streak (which can happen to all strategies). What if we run the strategy for two years?
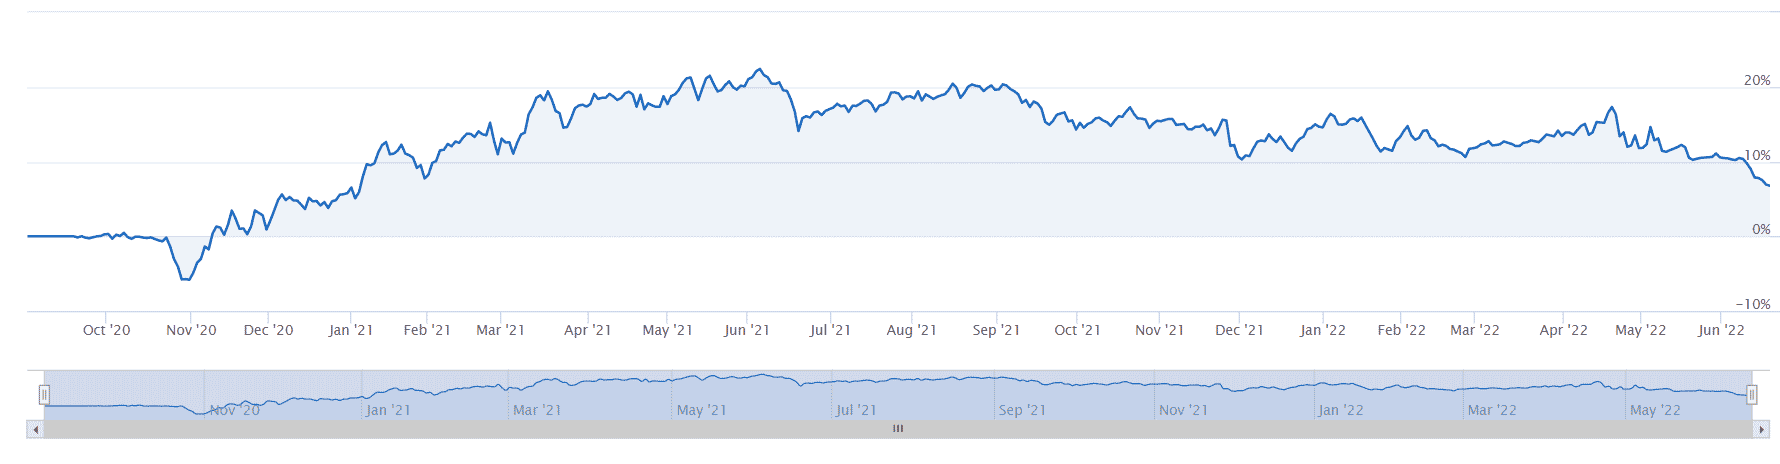
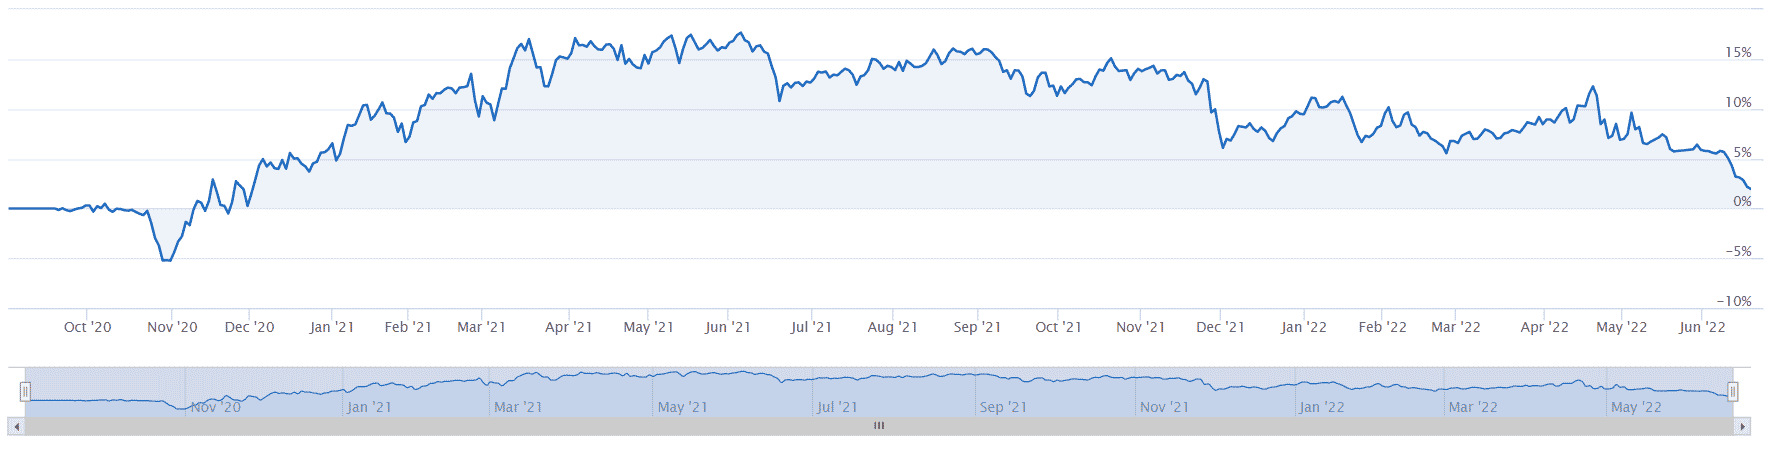
It did better. We are getting positive returns. Most of the profit was from November 2020 to June 2021, when the DIA ETF was in a long bullish trend
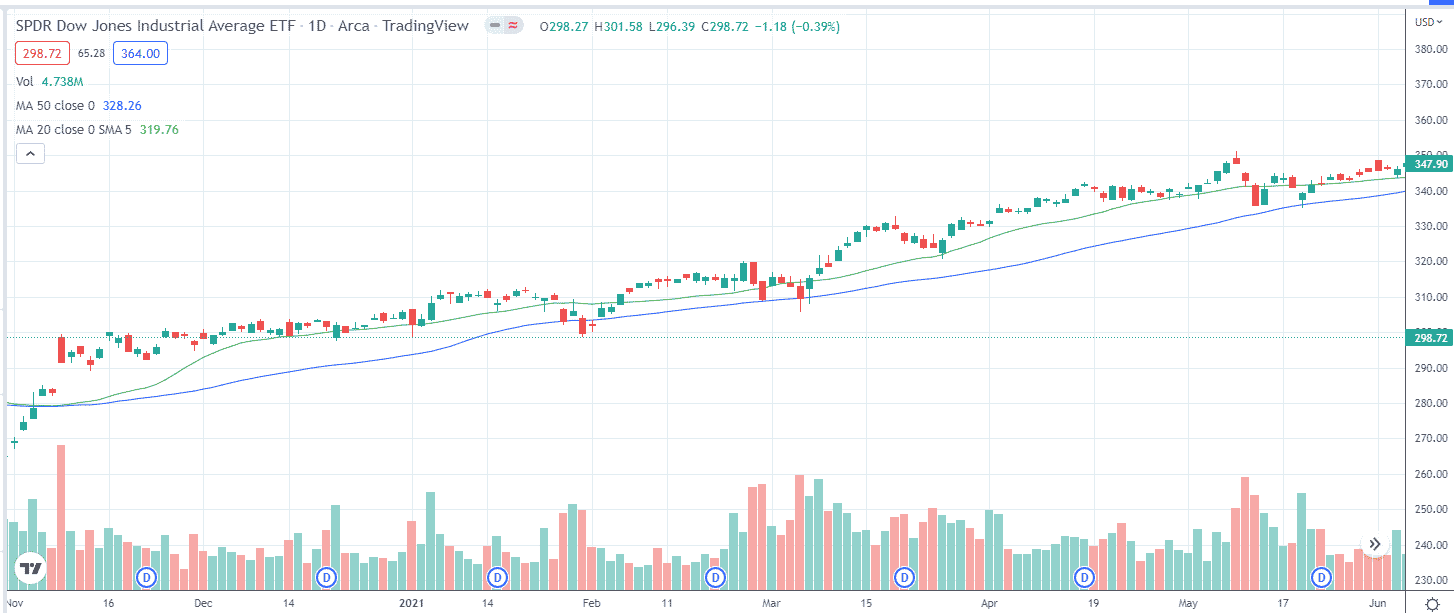
After the crossover, the 20 SMA (plotted in green) stayed above the 50 SMA (plotted in blue) for quite some time.
During those two years, did it do better than just buy-and-hold the DIA?
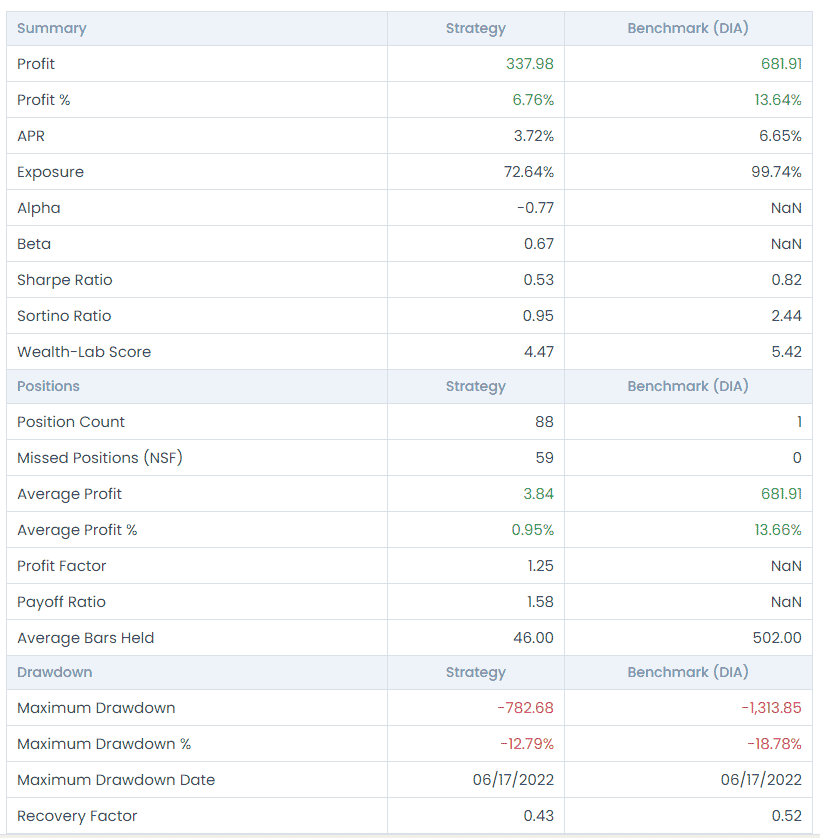
No, it did not.
But then it had fewer drawdowns than holding DIA.
A strategy that gives you a larger return may incur a larger drawdown.
Another question is whether you are able to continue to trade a strategy that can lose money for a year before showing profits?
Most investors might have given up on the strategy by then.
How Does The Moving Average Crossover Strategy Lose Money?
Looking at the backtest trade log, we see that it purchased Caterpillar (CAT) on 3/24/2022 and sold it on 5/15/2022, holding it for 35 bars.
Looking at the price chart, we see that this is a losing trade.
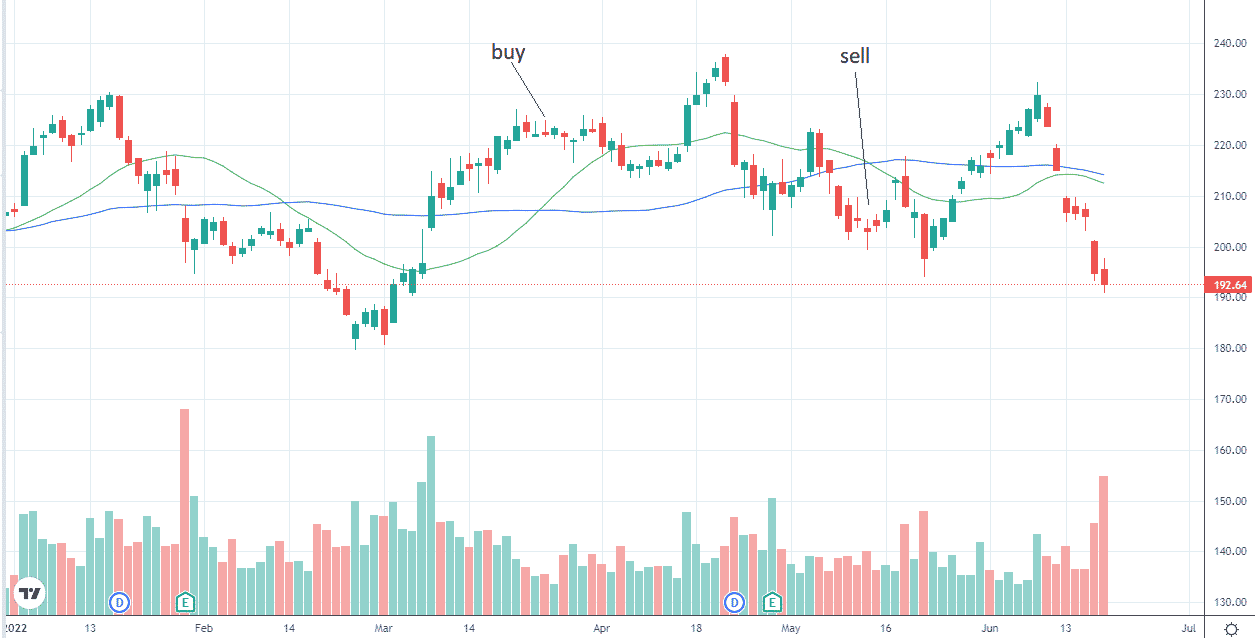
source: tradingview.com
The biggest criticism of the moving average crossover strategy is the lag.
It signals the buy too late (price had already gone up).
And it signals the sell too late (price had already drawn down too much).
Shorten The Time Frame
Hence some investors will try to eliminate lag by using shorter moving averages.
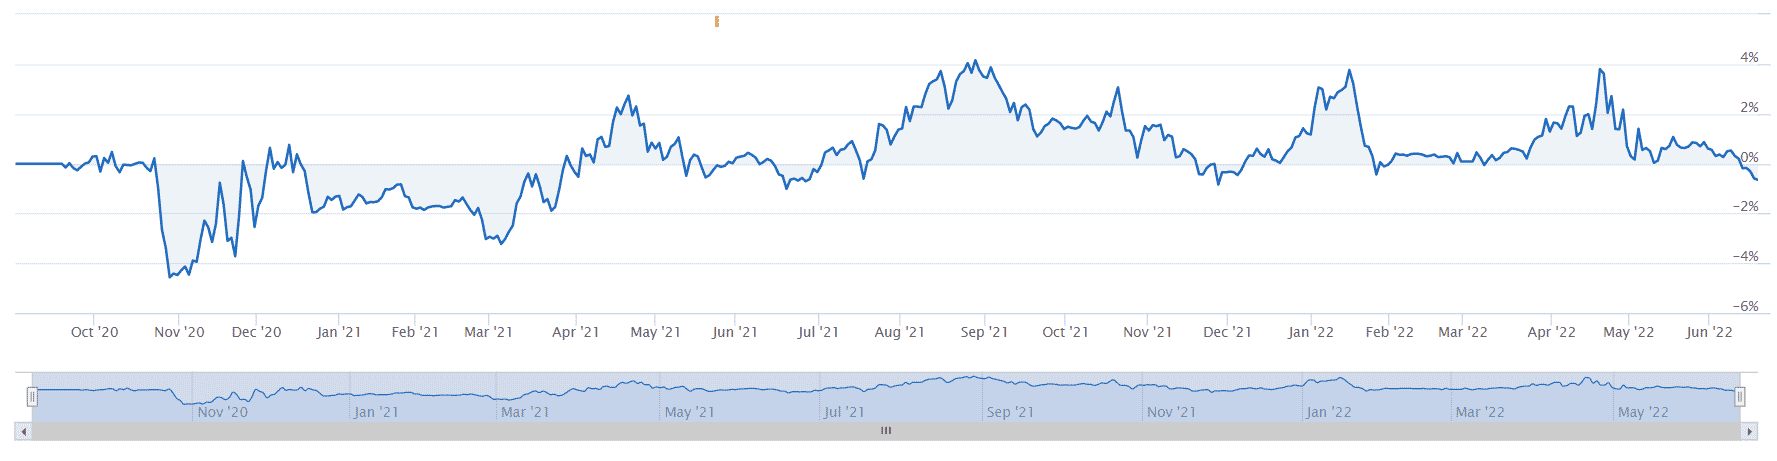
Let’s try the 3-period exponential moving average with the 8-period exponential moving average for the same two-year period.
Hmm, I guess not.
Triple Moving Average Crossover
Maybe the exit signal is lagging too much.
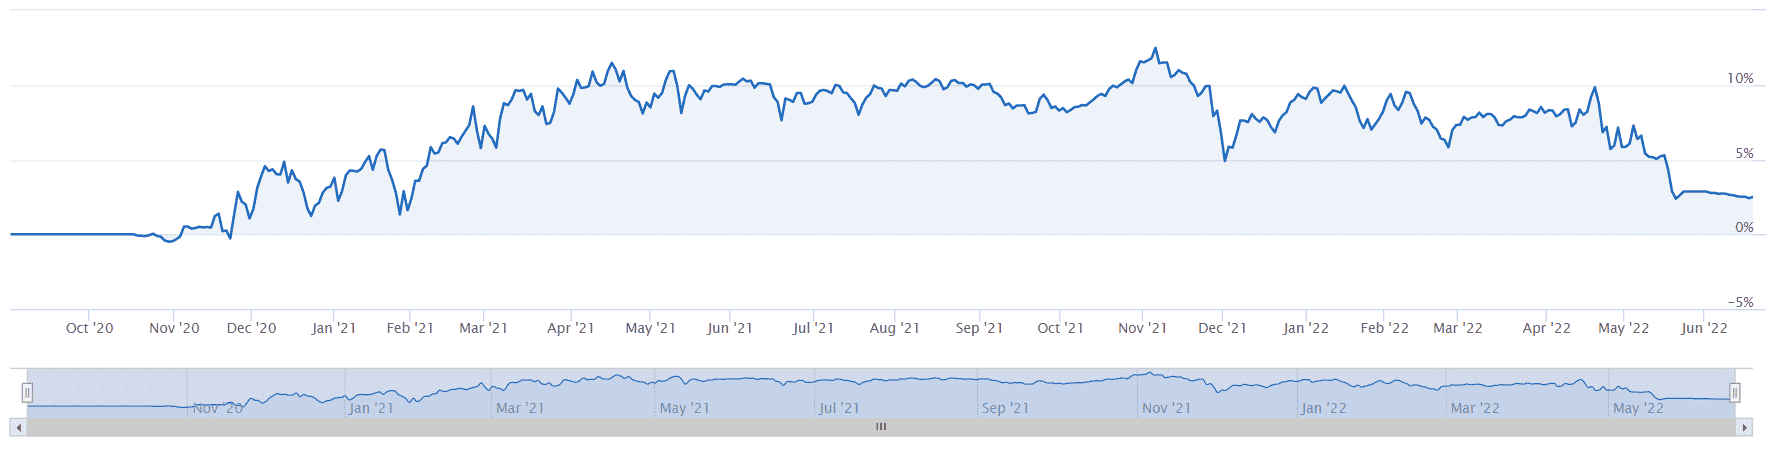
We’ll keep the entry as 20 SMA crossing above the 50 SMA.
But for the exit, we’ll use an 8 SMA crossing below the 20 SMA.
We are now using a form of a triple moving average crossover system.
But the results are disappointing.
Bullish filter
Since the crossover strategy is bullish, we should only trade it when the market is in a bullish condition.
What if we add the additional condition that the buy is triggered when the 20 SMA crosses the 50 SMA and the price is above the 50 SMA.
The exit will be when 20 SMA crosses below the 50 SMA.
Still not great. Imagine that you entered the equity curve in June 2021.
It would be sloping down from that point to the lower right.
What if we also add the condition that ADX is above 20.
This is so that we buy only when the market is trending, not when it is in chop or moving sideways.
When you see the equity curve go flat horizontal, it is when the backtest was not able to find any new trades that meet the entry criteria.
By adding filters, we are more selective and hence fewer trades.
FAQ
When does the moving average crossover strategy make money?
When there is a long-lasting bullish trend.
When does the moving average crossover strategy lose money?
When the market is bearish and when the price is consolidating sideways.
Does the moving average crossover strategy work?
Sometimes.
All strategies work some of the time.
No strategy works all of the time.
The moving average crossover strategy only works if it encounters a long bull-run (which is a small percentage of the time).
It often loses money because the trend is too short or the market is in a range.
Conclusion
In theory, the moving average crossover strategy sounds reasonable.
When the fast crosses above the slow, that could indicate the start of a bull trend.
It would have worked out if the trend had continued.
But it is rare to have long-lasting trends, and when it is time to exit, the strategy is slow to point out.
So far, we have looked only at the 20 simple moving average and 50 simple moving average crossovers.
There are many other combinations.
Will exponential moving averages work better?
The reader is encouraged to try out these different variations.
With the free tool at wealth-lab.com, this is easy to do.
Imagine trying to get these results by doing it by hand.
We hope you enjoyed this article on the moving average crossover strategy. If you have any questions, please send an email or leave a comment below.
Trade safe!
Disclaimer: The information above is for educational purposes only and should not be treated as investment advice. The strategy presented would not be suitable for investors who are not familiar with exchange traded options. Any readers interested in this strategy should do their own research and seek advice from a licensed financial adviser.


thanks