


The goal of the triple moving average strategy is to capture the price move in a trend.
To avoid unnecessary complications, our examples will focus on using the strategy in the bullish direction.
But once you understand the concepts, you can change and apply the concept in the bearish direction.
In our examples and back test, we give results of buying long stocks and selling them later for a profit.
However, you can use any number of options strategies to capitalize on this price appreciation.
There are variations of the triple moving average strategy with a lot of room for flexibility in the rules.
The strategy that we will present to you today is based on what was described in John Murphy’s book “Technical Analysis of the Financial Markets: A Comprehensive Guide to Trading Methods and Applications”.
Therein he writes that… “The most widely used triple crossover system is the popular 4-9-18-day moving average combination.”
Contents
- 4-9-18 Moving Average Combination
- Exit Signal
- Wait For Space Separation
- Back Test Results
- The Finer Points
- Expanding Moving Averages
- Can We Use Other Moving Averages?
- Conclusion
4-9-18 Moving Average Combination
To implement the triple moving average strategy, first plot three moving averages on the chart.
1) The fast one: 4-period simple moving average
2) The medium one: 9-period simple moving average
3) The slow one: 18-period simple moving average
The signal to go long to capture the start of a bullish trend is when the fast-moving average crosses up through the slow-moving average.
Here on a daily chart of Honeywell International (HON), we see on February 10, 2021, that the orange 4-day simple moving average crosses up and above the blue 18-day simple moving average. This is a buy signal.
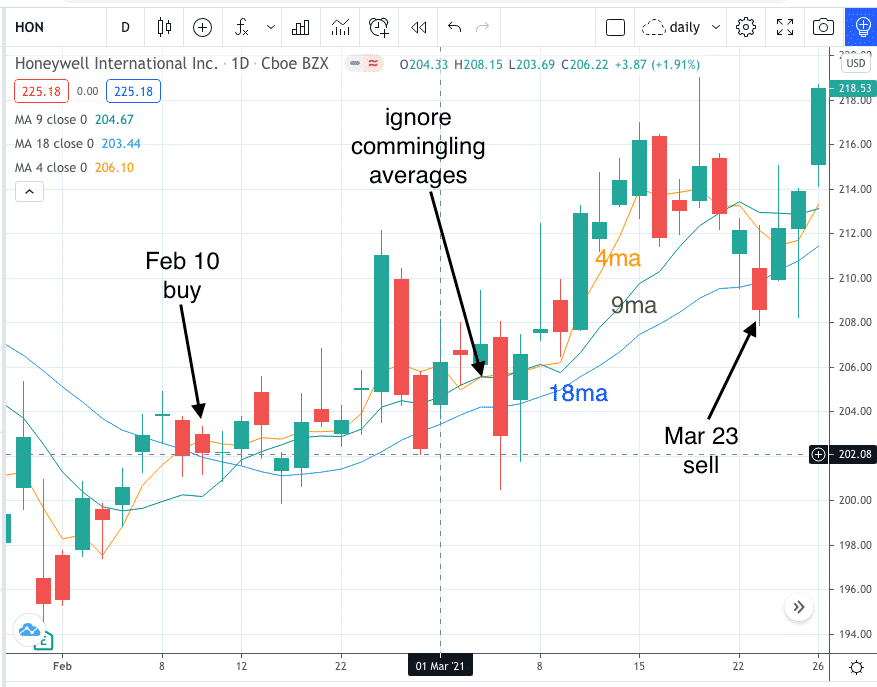
Note that you want the orange line to cross up through and above the blue line — not when the orange line crosses down and below the blue.
Exit Signal
When the 4-day simple moving average then later crosses either of the other two moving averages, this is the signal to exit the position.
Usually, it will be the 4-day average crossing down below the 9-day average.
This occurred on March 23rd and is the exit signal.
Think of the fast-moving average as the signal line, we act when it crosses the other moving averages.
For the purposes of our back test, we will assume the investor bought and sold at the closing price and will buy enough shares to take on an approximate position size of $5000.
With 25 shares of HON bought at $202.16 and sold at $208.59, the investor made a profit of $160.75 on this trade.
Wait For Space Separation
The astute reader may question why we bought on February 10th when the cross happened on February 9th.
We want to make sure that the moving averages make a “decisive” crossover, not an ambiguous or tentative crossover.
So, we sometimes wait a day to ensure that there is space separation between the two moving average lines before taking the signal.
The same is true of the exit signal.
Note that in early March, the orange and green moving averages commingled crossing back and forth without clear separation between the two.
We ignore these signals and did not exit until we see a clear separation of the orange line going below the green line on March 23rd.
Back Test Results
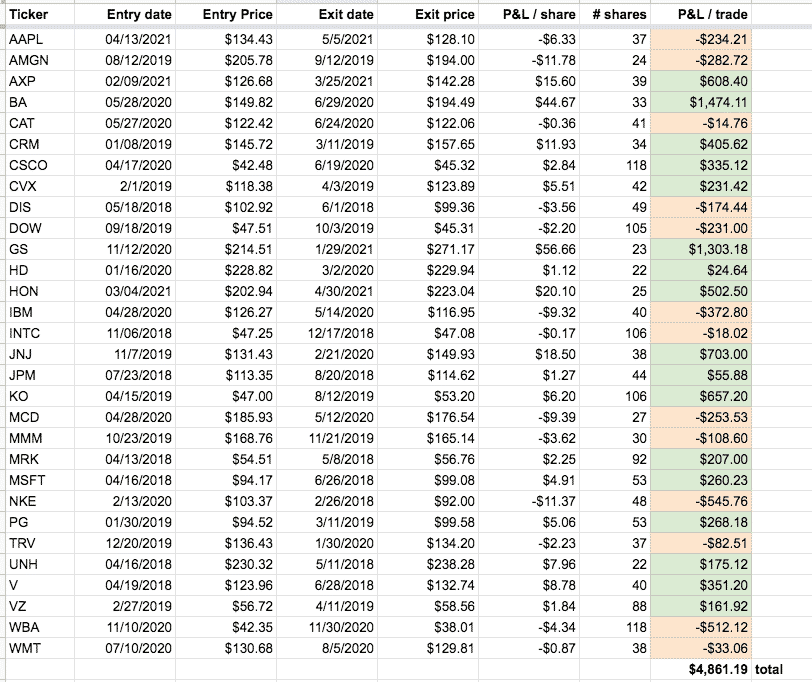
For the back test, we looked for crossovers in the Dow Jones Index stocks at random points in the timeline between the years 2018 and the early part of 2021.
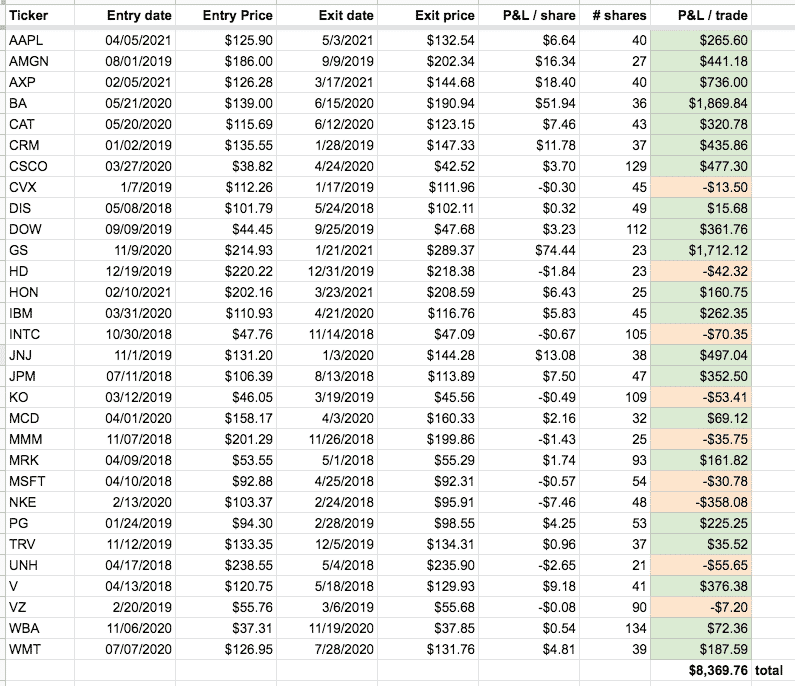
The results showed 9 losses with an average loss of $74. There were 21 wins with an average win of $430.
In aggregate, the back test profited $8370.
The losses were well contained with no large losses. On average, the size of a win is larger than the average loss. In addition, the strategy captured and profited from two long bullish trends — namely BA and GS.
In investing, you have small wins, small losses, big wins, and big losses. The goal of a profitable strategy is to eliminate the big losses.
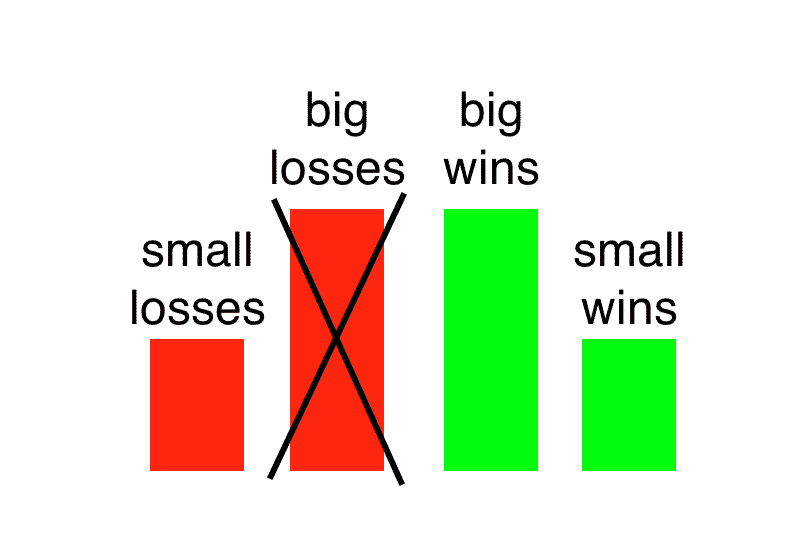
You are then left with small wins, small losses, and big wins — this gives you a winning strategy because you have more wins than losses and the average wins are larger than the average losses.
The Finer Points
In Murphy’s book, he says the buy signal is when the 4-day crosses above both the 9-day and the 18-day. We simplified it to watching the 4-day crossing the 18-day because we found that when that happens, the 4-day would have already crossed the 9-day in most cases.
Murphy also says that this first signal is an alert, and that the confirmation signal to buy is to wait for the 9-day to cross above the 18-day. We found that it was not necessary to wait for this confirmation in favor of getting into the trend earlier. We saw that when the first cross happens, the second confirmation cross will also occur more often than not.
Expanding Moving Averages
Look at the chart of Procter & Gamble (PG) on January 24, 2019, where the three moving averages are expanding from a single point.
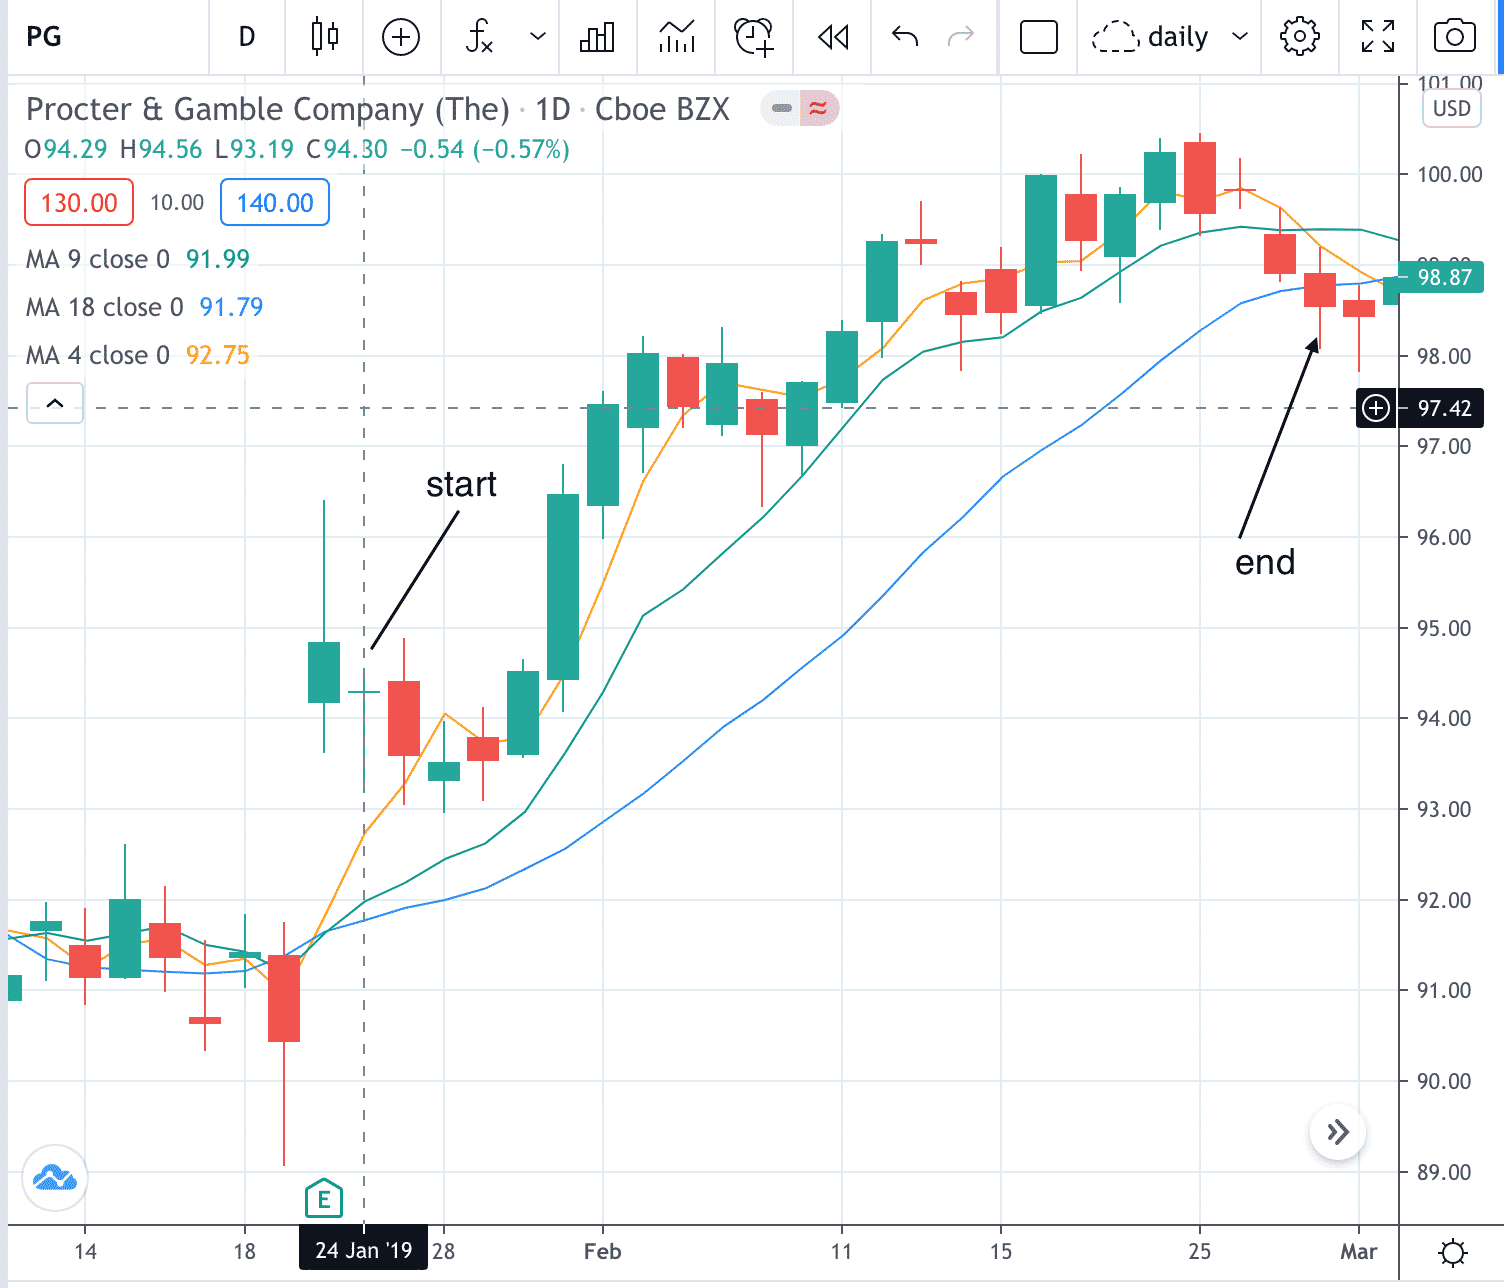
This is a high probability very bullish pattern in the early stage of an uptrend.
Can We Use Other Moving Averages?
Is there something magical about the 4-9-18 moving average combinations, or can other moving averages be used?
Why not use the more common 20 moving average and 50 moving averages that many technical analysts already have on their charts?
Here are the results of the same strategy using the 9-20-50 simple moving averages.
While it was still profitable, it did not do as well. The win-loss ratio was not as good, and the average loss was closer in magnitude to the average win. It appears that this set of slower-moving averages is not sensitive enough. It picks up the trend a little late, and it exits a little late.
Conclusion
The 4-9-18 triple moving average strategy is to be a good one. It embodies a couple of key trading maxims:
- The trend is your friend — until it ends.
- Cut your losses short and let your winner run.
Because it has clearly defined buy/sell rules, it takes the emotion out of the picture and forces the investor to live by the maxims. It helps the investor stay in a trend until there is a clear sign of it ending. This avoids early profit-taking that limits reward potential.
It forces the investor to cut losses early. When the 4-day moving average crosses below the 9-day moving average, the investor must exit the position. There is no interpretation or ambiguity.
It is a trend-following strategy. Hence it does better in trending markets than in ranging markets. Would using the ADX indicator to determine if the market is trending nor ranging be a good filter criterion to add to improve the strategy? Or will the filter eliminate too many good trades? Hmmm. Good question. One that we leave the reader to determine and back test.
Trade safe!
Disclaimer: The information above is for educational purposes only and should not be treated as investment advice. The strategy presented would not be suitable for investors who are not familiar with exchange traded options. Any readers interested in this strategy should do their own research and seek advice from a licensed financial adviser.

Amazon Associate Disclosure
Options Trading IQ is a participant in the Amazon Services LLC Associates Program, an affiliate advertising program designed to provide a means for sites to earn advertising fees by advertising and linking to amazon.com


