

A Marubozu candlestick is characterized by high open or close price and confirms strong bullish or bearish action. Today we will take a detailed look at marubozu candles.
Contents
- Introduction
- What Is A Marubozu Candlestick?
- Characteristics
- What Do These Patterns Tell?
- Bearish vs. Bullish Marubozu Pattern
- Trading The Marubozu Pattern
- Marubozu Pattern Drawbacks
- Bottom Line
Introduction
Candlestick patterns indicate market momentum signaling who is in control and the direction prices are moving.
While some patterns signal sideways movement, others signal domination in each direction.
A Marubozu candlestick is one such pattern that signals strong momentum in an underlying.
What is a Marubozu Candlestick?
A Marubozu candlestick is characterized by high open or close price.
Unlike other candlesticks, it does not have wicks or shadows, on either side.
This indicates that the highest and or lowest point in trading was reached at the end of the candle.
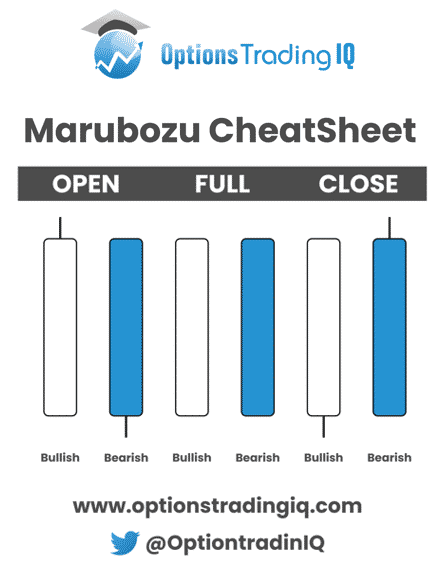
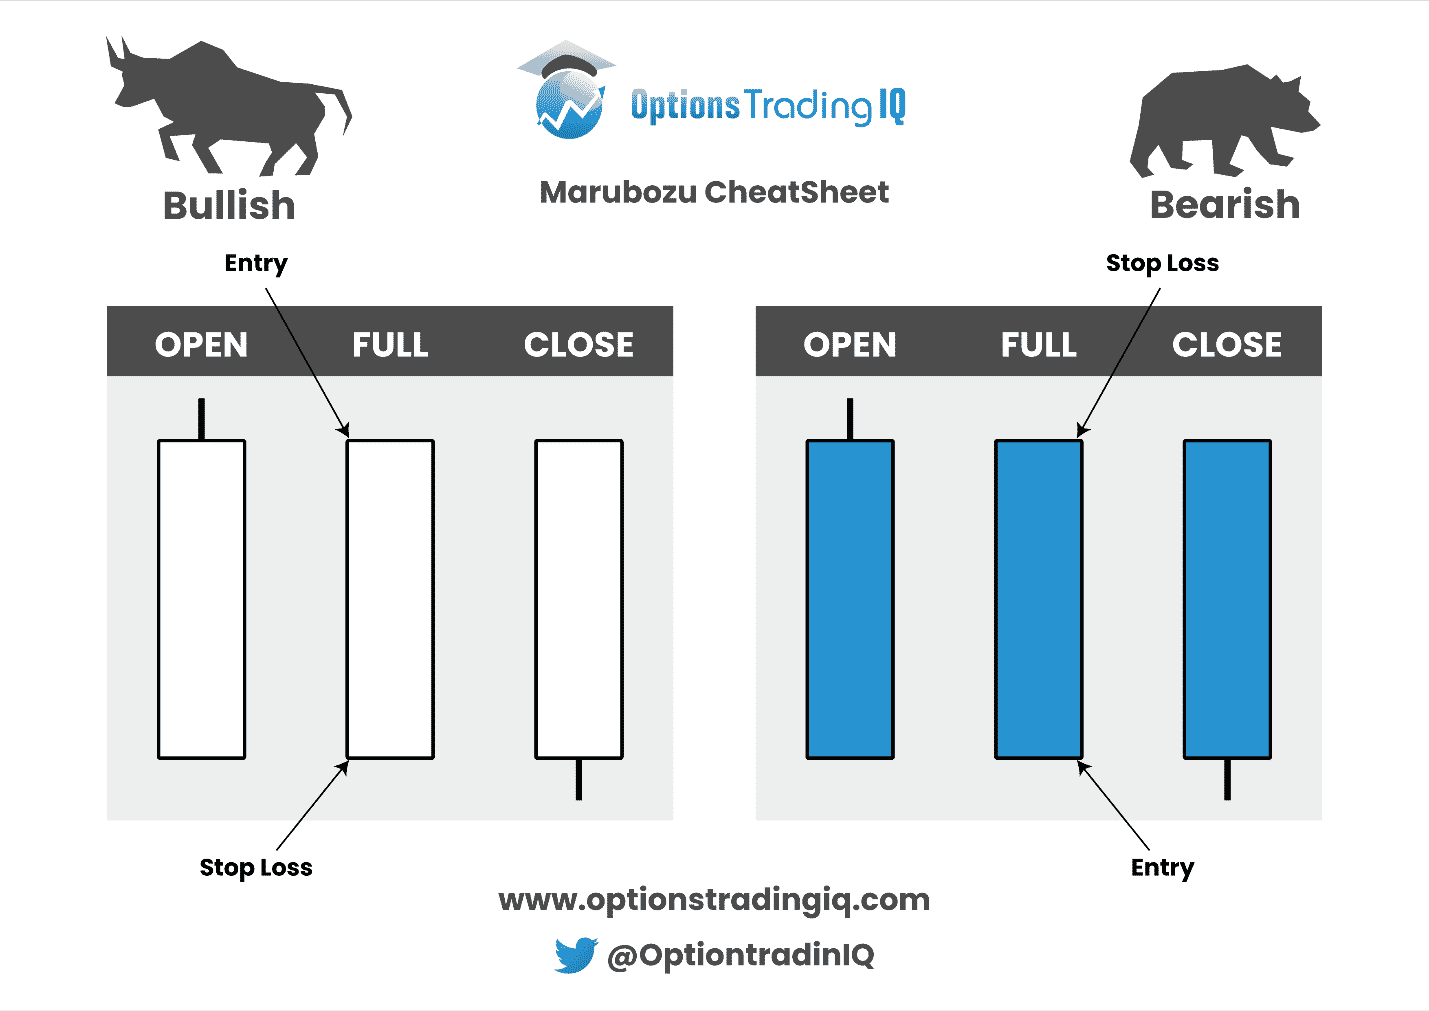
In the case of a full Marubozu, both the bull and bearish candlesticks do not have wicks, as shown above.
With the full Marubozu, an asset price rallies or drops and closes at its extreme without registering any wicks to signal high and low points before the candle closed.
A Marubozu open occurs if the opening bull or bear candlestick is flat without wicks.
The close can come with wicks. In contrast a Marubozu close occurs if the closing of bear and bullish candlesticks are flat, but the opening levels have wicks.
Characteristics
- Large body
- Lack of shadows on either side of the candlestick body
- The color of the candlestick will signal the direction price is likely to move.
The absence of wicks in the candlesticks indicate that price opened either high or low in a session and closed at a much higher or lower price, respectively, without any pullbacks.
In this case, the pattern can provide accurate analytical insight into the future direction of price action depending on the underlying trend.
What Do These Patterns Tell?
A Marubozu pattern is a candlestick pattern that affirms price is trending in one direction without any resistance.
For instance, in the Marubozu open, price opens without dipping and powers to new highs. It continues rallying until the end of the set period.
In this case, price only trends in one direction, affirming strong momentum in that direction.
The strong trend applies to both the open and close Marubozu.
Despite the small wicks at close or the open, the price still moved in one direction steadily and closed at a high or low point without any rejection of price.
Bearish vs. Bullish Marubozu Pattern
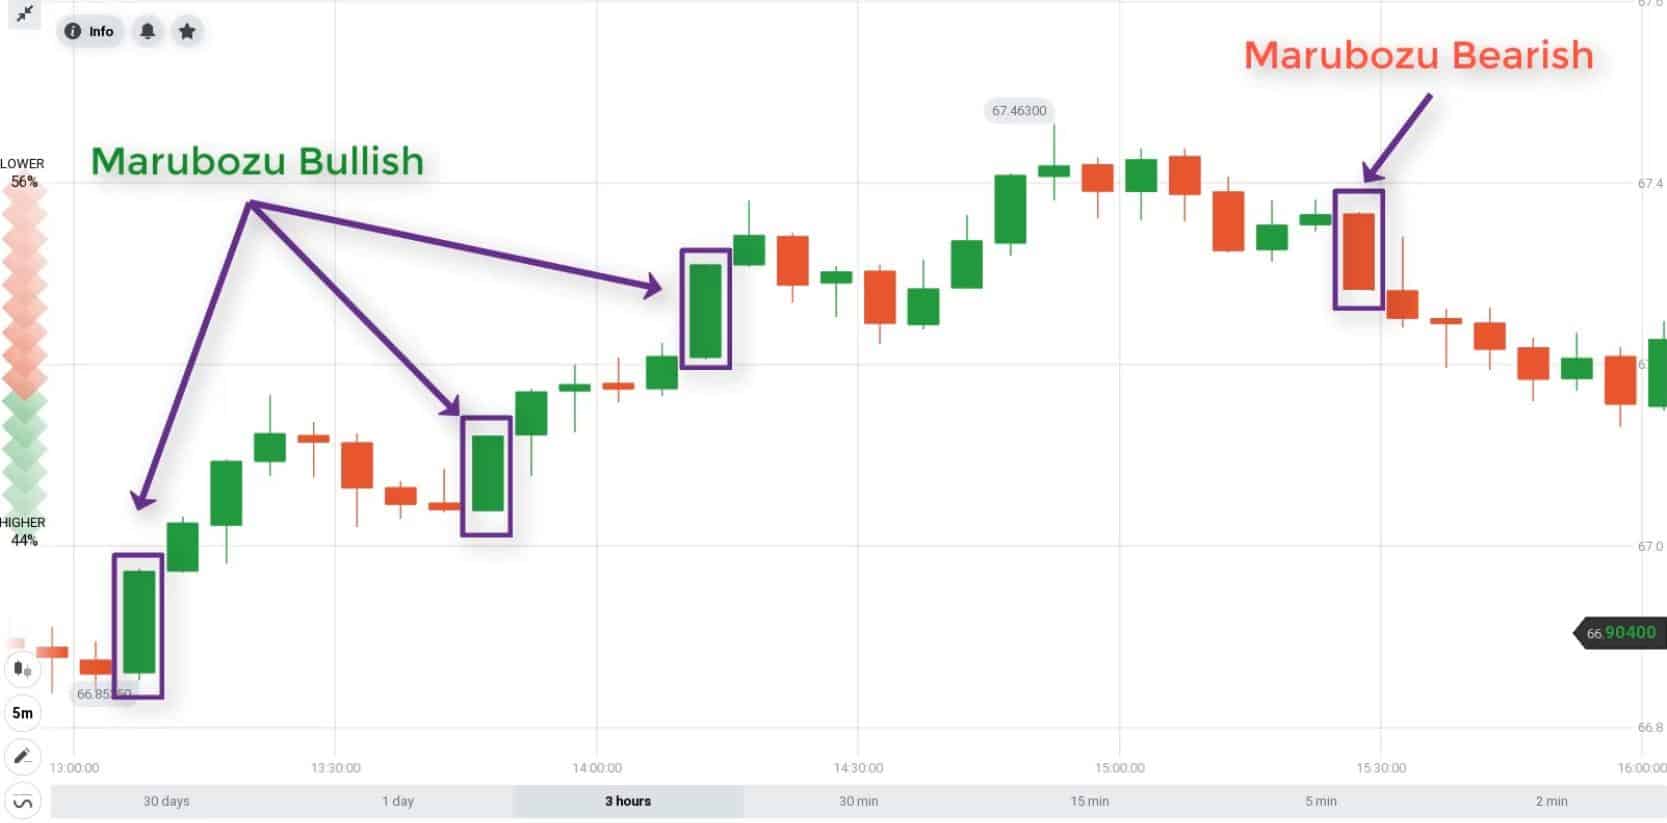
The bearish Marubozu configuration affirms sellers are in control.
In this case, the selling pressure is so high such that the price moves lower without any rejection to the upside.
The pattern can be interpreted as a lack of bulls in the market such that sellers are allowed to push prices lower as they wish.
Source: howtotradeblog.com
Similarly, the Bullish Marubozu pattern signals that buyers are in control and dominate a given session.
In this case, they can push prices higher without any opposition from sellers.
Trading the Marubozu Pattern
Spotting the Marubozu pattern is a sure way of determining the direction in which price is moving and likely to move in the long run.
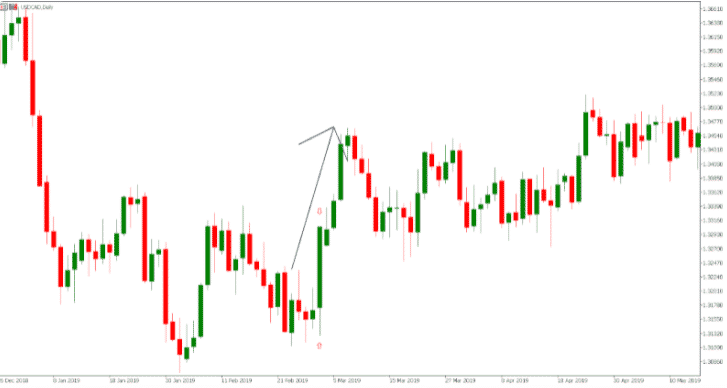
Consider the chart below of the USD/CAD pair. Price was initially moving lower as sellers remained in control.
Source: Thinkmarkets.com
However, at the lows of the session, the price consolidates, struggling for direction.
The emergence of a bullish Marubozu candlestick affirms that buyers have overpowered sellers and are likely to push prices higher.
Once the candlestick closed price moved higher as the upward momentum strengthened.
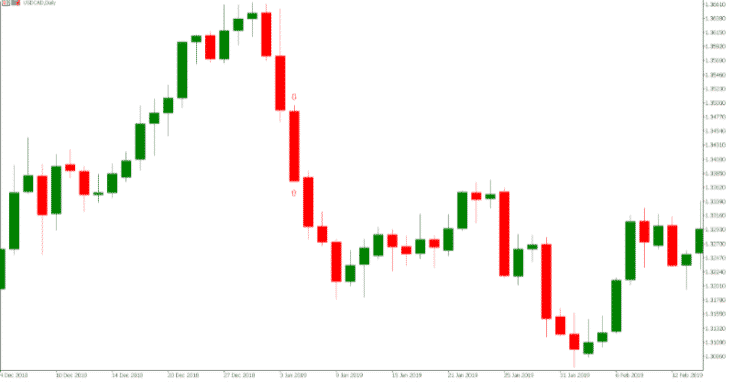
Consider the chart below.
Source: Thinkmarkets.com
While price had reversed from all-time highs with two bearish candlesticks, a Bearish Marubozu candlestick is formed that confirms bears are in full control.
Once the candlestick closed price continued lower.
Marubozu Pattern Drawbacks
The lack of wicks makes it extremely difficult to trade this pattern in the context of setting up stop loss and take profit.
The lack of clear lows or highs makes it extremely difficult to place the stop and profit take order, as is the case with other candlesticks that have wicks.
For instance, a hammer candlestick comes with a clean low that can be used to determine a stop loss.
With the Marubozu pattern, that is not the case, and one must use other indicators to place the orders.
While you can enter a long position once a bullish Marubozu opens or a shot position once a bearish Marubozu opens, you will have to use other tools or indicators to ascertain the ideal points for profit taking and stop-losses.
To void the downfalls of the candlestick pattern, a stop-loss order should be placed either below the bottom or at the high of the candlestick.
It is also important to avoid relying on extremely small Marubozu candlesticks on shorter time frames such as minute charts to make decisions.
A small Marubozu candlestick, in most cases, will indicate a false signal.
Bottom Line
Marubozu is a powerful candlestick pattern that provides hints about potential future prices.
The pattern signals strength in momentum in each direction as price opens and moves up or down without pulling back to close at the highest or lowest point.
While reversal candlestick patterns are good in providing signals or warnings about what is about to happen, Marubozu patterns only confirm price action may continue to move in each direction.
It does not promise it.
The candlestick can be seen in all chart time frames.
However, it is most powerful when spotted when using a longer time frame.
Trade safe!
Disclaimer: The information above is for educational purposes only and should not be treated as investment advice. The strategy presented would not be suitable for investors who are not familiar with exchange traded options. Any readers interested in this strategy should do their own research and seek advice from a licensed financial adviser.


Good learning