


We will compare four bearish option strategies to see how they perform when the price goes in our favor, goes against us, and when the price goes sideways.
Although there are other bearish strategies, today, we will look at the bear call spread, the bear put debit spread, the bearish calendar, and the broken-wing butterfly.
Contents
- Case #1: When Price Goes As Expected
- Case #2: Wrong Direction
- Case #3: Sideways
- What We Have Learned
- Conclusion
Case #1: When Price Goes As Expected
Let’s take a look at the “happy path” first, which is when the price goes in our favor, in this case, down.
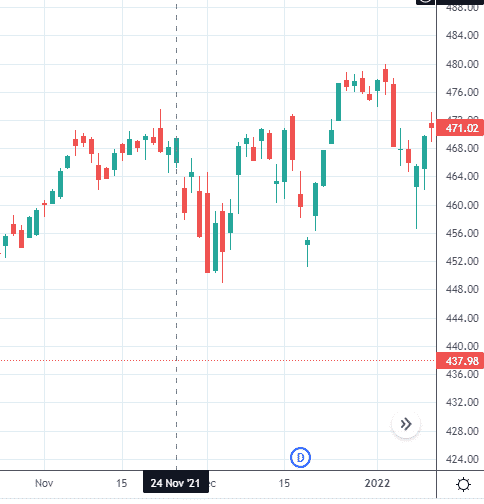
The asset that we will be using is the S&P 500 ETF, under the ticker symbol SPY.
Suppose we initiated the bearish trade on November 24, 2021, at the end of the market day.
source: tradingview.com
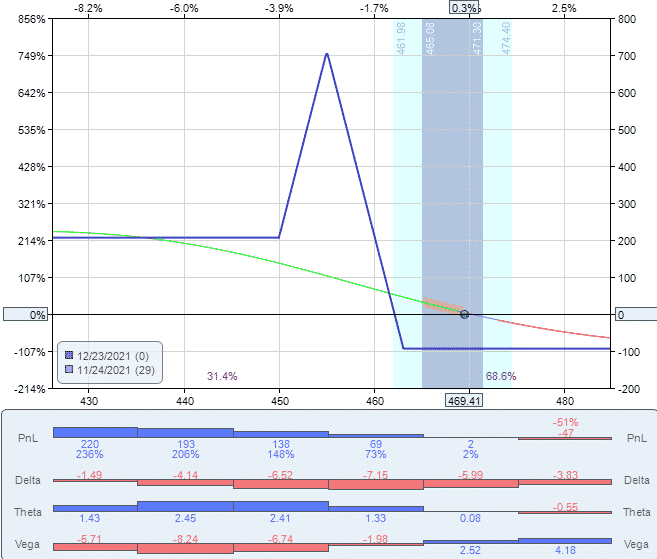
Bear Call Spread
We placed the bear call spread around the 15-delta on a monthly expiration cycle 58 days away.
Date: Nov 24, 2021
Price: SPY at $469.41
Sell four Jan 21, 2022 SPY $492 call @ $1.76
Buy four Jan 21, 2022 SPY $496 call @ $1.21
Total Initial Credit: $218
Max profit: $218
Max risk: $1382.00
Theoretical risk-to-reward ratio: 6.3
Profit Target: $109
Stop Loss: $436
We say the theoretical risk-to-reward ratio because mathematically, that is what the options structure suggests if we were to hold the trade to expiration without any intervention.
But since we will be exiting the trade early if it hits our profit target or stop loss, our actual risk to reward will be different.
For credit spreads, we like to take profits and exit the trade when profits reach 50% of the initial credit.
If losses reach two times the initial credit, we call it quits and terminate the trade.
This gives an actual risk to reward ratio of 4 since it takes four winning trades to make up one loss.
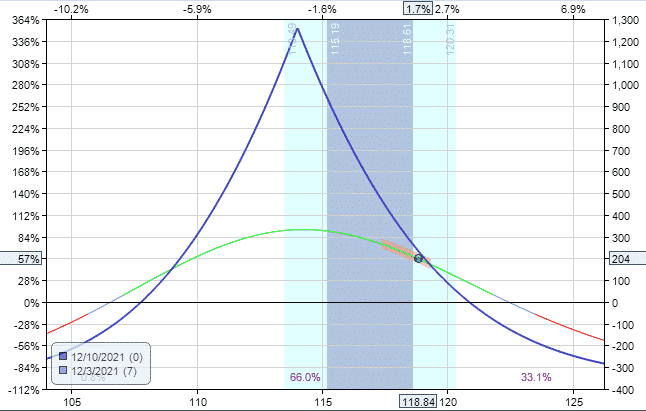
The payoff diagram looks as follows: the curved line known as the T+0 line and the blue line known as the expiration graph.
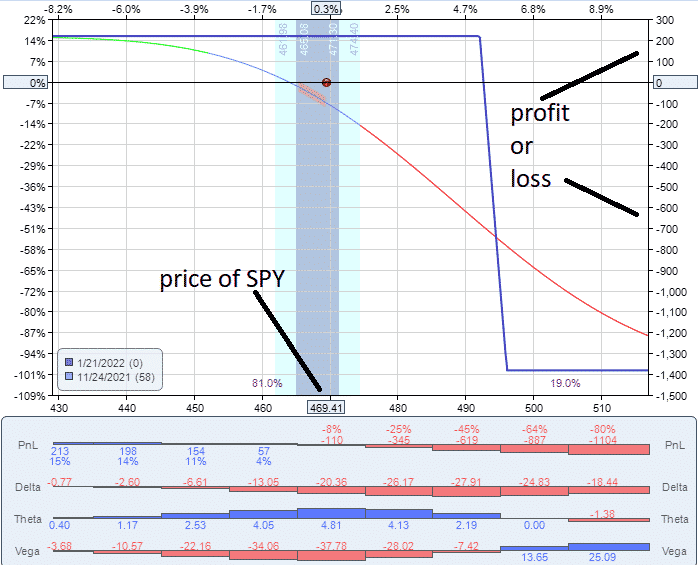
source: OptionNet Explorer
The Greeks at the start of the trade are as follows.
They will change as the trade progress and when the price of the underlying moves.
Bear Call Spread Greeks
Delta: -19.93
Theta: 4.80
Vega: -37.91
The delta is negative, which means that we make money if the underlying asset goes down.
Theta is positive, which means that the trade will make money as time passes, assuming all other things (including the price of the underlying) are the same.
Vega is negative, which is another way of saying that this trade is “short volatility.” We want volatility to go down.
Just like we want a stock price to go down when we “short” the stock.
There is a relationship between Theta and Vega.
Typically, when Theta is positive, Vega will be negative.
And vice versa. In other words, trades such as this that profit from time decay (positive theta) will be short volatility (negative vega).
Credit spreads are hurt when volatility goes up during the trade.
And indeed, volatility has gone up during the trade, as can be seen by the VIX, which is the volatility index of the S&P 500.
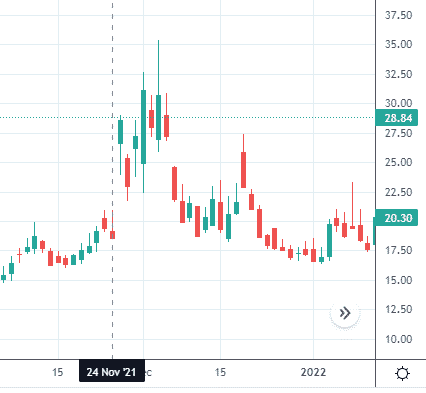
source: tradingview.com
One issue with bear call spreads is that when the price goes down in our favor, the volatility of the asset naturally goes up.
We win on price but lose on volatility. So there is a headwind we have to overcome.
If price is strong enough to be a primary factor of the trade rather than volatility, then the trade certainly can still make money, as in the case of our example trade.
On November 30, it reached profit target, and the trade is exited with a profit of $109.
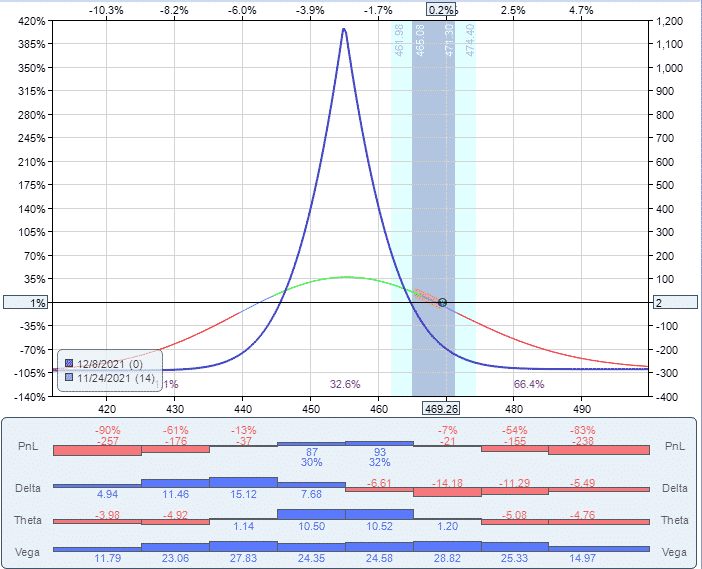
Bear Put Debit Spread
In the vertical spread family is also the bear put debit spread, which (unlike the credit spread) is typically placed near the money.
Because we are taking a bearish direction, we buy a put option that is in-the-money and sell a put option that is out-of-the-money.
Date: Nov 24, 2021
Price: SPY at $469.41
Sell one Dec 23 SPY $467 put @ $7.03
Buy one Dec 23 SPY $471 put @ $8.58
Total Initial Debit: $155
Max profit: $245
Max risk: $155
Theoretical Risk to reward ratio: 0.6
Profit Target: $122
Like the credit spread, we take profit at 50% of the max potential profit.
We have constructed this trade to have a similar profit target as the credit spread.
Yet, the max loss is much less than that of the credit spread.
Debit spreads have much better risk-to-reward ratios.
You do not need to risk as much to get the reward you are targeting.
The payoff graph looks like this:
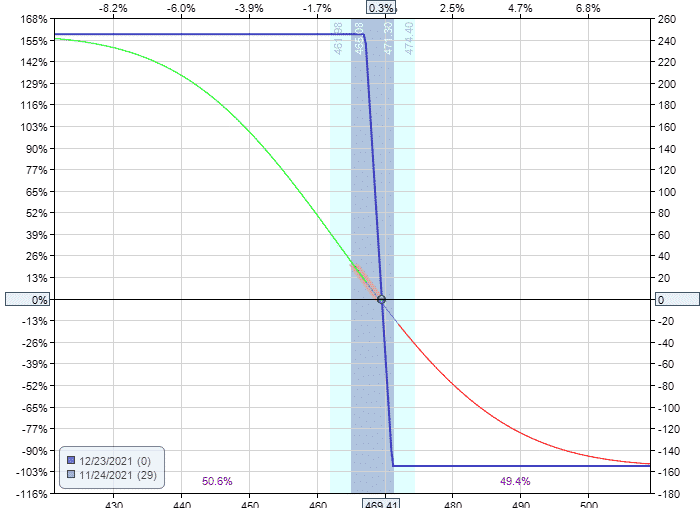
Bear Put Spread Greeks
The Greeks for this trade initially are.
Delta: -8.29
Theta: 0.71
Vega: 0.48
The Greeks histograms below the payoff diagram in OptionNet Explorer show us how Delta, Theta, and Vega will change as price moves to the left or the right.
They also change day by day as the spread gets closer to expiration.
A spread only loses value due to the passage of time when theta is negative.
From the histogram, this only occurs on the right side of the graph (when the price goes in the wrong direction that we expect).
And even so, the loss from theta decay is small — less than a dollar per day (for this position size and days to expiration)
Theta is positive at the start and continues to be more positive to the left of the graph (in order words, when the price goes in our favor).
Debit spreads are a directional play. Directionality is indicated by Delta.
The trade always has a negative delta, which means that this trade will benefit when the price goes down.
But if the price goes way down to the left (say below $440), you see that delta becomes smaller in magnitude (trade less powerful).
For each additional dollar that price goes down, our profits still increase, but not as fast as before.
Therefore, if profits reach half of the maximum profit, we take our profits and move on to the next trade, since we have already captured the “easy money.”
The trade reached its profit target in one week on Dec 1st, taking home $122.
Bearish Calendar
The calendar is a time spread or a horizontal spread.
If we expect the price to go down, then we center it below the money where we think the price will end up.
If we expect the price of SPY to get to $455 in a week, we can set up a “two-week calendar” with strikes at $455.
A calendar has two options. The shorter-dated option is the one we are selling.
And a longer-dated option is the one we are buying.
When we say “two-week calendar,” we mean that the shorter expiration option will expire in about two weeks.
The longer-dated option will expire two weeks after the short-dated option.
Date: Nov 24, 2021
Price: SPY at $469.41
Sell four Dec 8 SPY $455 put @ $1.52
Buy four Dec 13 SPY $455 put @ $2.23
Total Initial Debit: $286
Max profit: $1150
Max risk: $286
Theoretical Risk to reward ratio: 0.25
We used puts instead of calls because the short puts will be out-of-the-money at the start of the trade.
Typical of calendars, its reward is four times that of its risk.
But that is just theoretical; we will not achieve the max profit.
In the below graph, the expiration graph drawn is that of the short-dated expiration:
Two Days Later….
Two trading days later (November 29), the calendar shows a profit of $150.
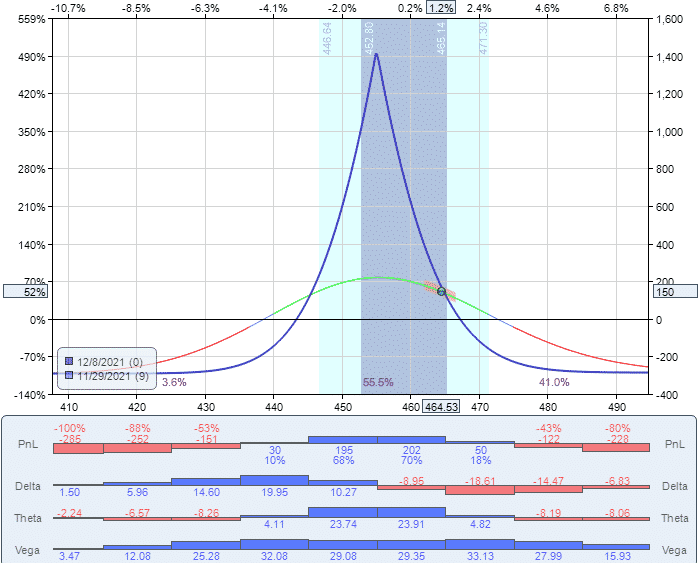
If we are worried that the next day’s price moves in the wrong direction, then this is good enough to take.
This is already a 50% return on the capital we had invested in the trade.
Note the price does not need to go to exactly $455 as predicted to be profitable.
All it takes is for it to go in the general direction.
But if we decide to wait one more trading day, we could get lucky.
And we did. Taking a profit of $280 when we have risked only $286 is what sometimes can happen on low risk-to-reward trades.
Low risk-to-reward means the same as high reward-to-risk.
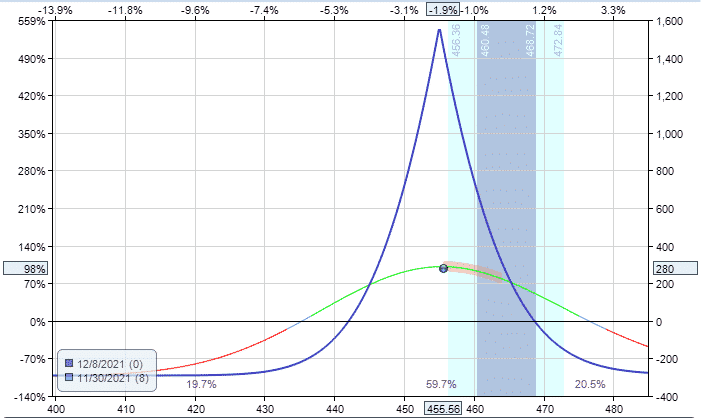
Broken Wing Butterfly
Butterflies can also be high reward-to-risk trades and can be used similar to how we used the calendar.
We use a broken-wing butterfly with 29 days to expiration in this next example.
Trade Details:
Buy one Dec 23 SPY $450 put @ $3.36
Sell two Dec 23 SPY $455 put @ $4.12
Buy one Dec 23 SPY $463 put @ $5.81
Total Initial Debit: $93.50
Max profit: $700
Max risk: $93.50
Theoretical Risk to reward ratio: 0.13
We used puts instead of calls because the short puts would be out-of-the-money when the trade was first initiated.
Unlike the calendar, if the price overshoots to the downside, we still win.
If the price expires on the left leg, we make about $200.
If the price expires over the right leg, we lose $100. This is a 2 to 1 ratio.
But we don’t wait for expiration.
We take home $114 on Dec 1st after one week in the trade.
For growing small accounts, this may be a good approach.
You just need to get the direction correct more than half the time.
And make sure when you get the direction correct, you take profit that is greater than your max loss.
Case #2: Wrong Direction
What happens if we get the direction wrong?
Suppose we go bearish on IBM on November 24th. But it just went straight up..
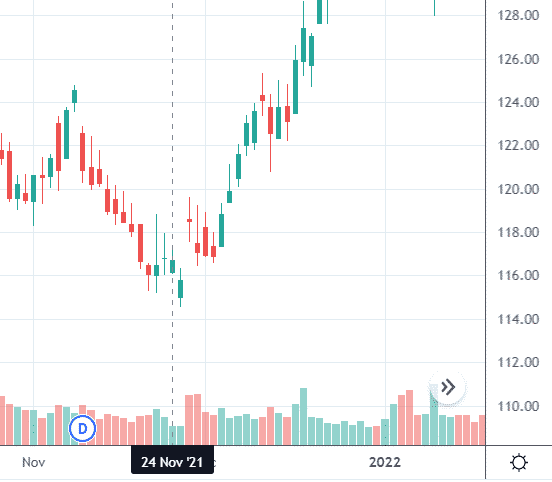
source: tradingview.com
Bear Call Spread
Here is the credit spread.
Date: Nov 24, 2021
Price: IBM @ $116.73
Sell four Jan 21 IBM $125 call
Buy four Jan 21 IBM $130 call
Initial credit: $246
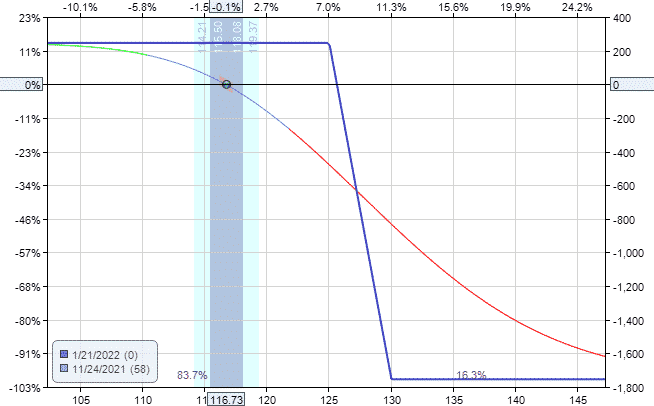
It hit our self-imposed stop-loss of $492 on Dec 16.
The loss was twice the initial credit received.
Put Debit Spread
And here is the debit spread.
Date: Nov 24, 2021
Price: IBM @ $116.73
Sell one Dec 23 IBM $115 put
Buy one Dec 23 IBM $120 put
Initial Debit: $264
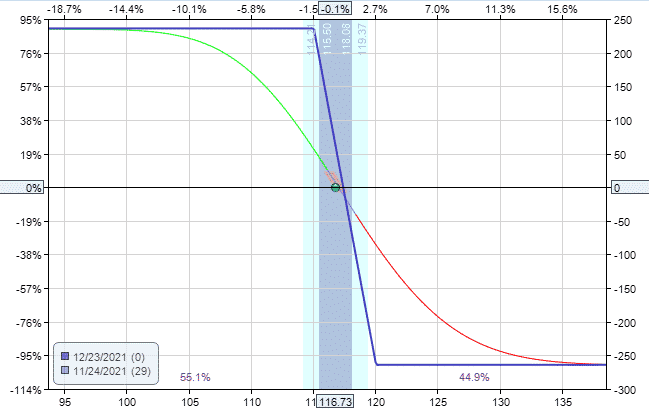
On Dec 15, the P&L (profit and loss) is showing a loss of $220.
The max loss on this spread is $264.
We can not lose more than what we paid for it initially. We decided to hold till expiration.
Maybe we get lucky, and the price goes back in our favor.
It does not.
And we lost $264 at expiration when the spread became worthless because both put options expired out-of-the-money.
Bearish Calendar
Date: Nov 24, 2021
Price: IBM @ $116.73
Sell six Dec 10 IBM $114 put
Buy six Dec 23 IBM $114 put
Debit: $357
Starting position:
On Dec 3, the price had gone up to $118 (the wrong direction that we want), yet the calendar is showing a profit of $204.
Notice that the T+0 line has risen.
That’s because the implied volatility of IBM went up during that time, as seen on the below chart.
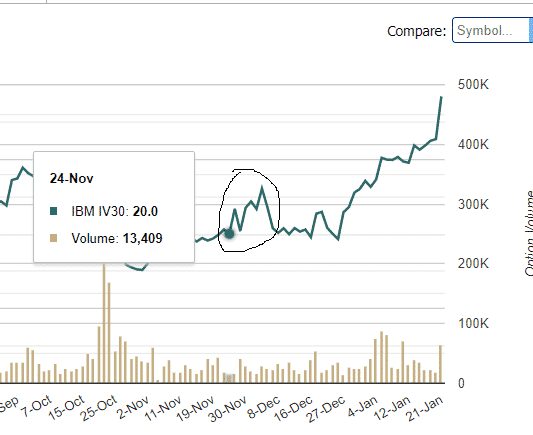
source: marketchameleon.com
Price went against us.
But implied volatility went in our favor.
We thank the market and exit the trade.
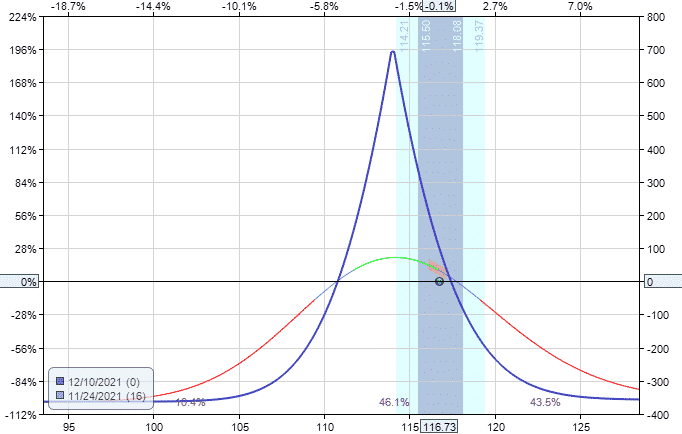
Broken Wing Butterfly
Date: Nov 24, 2021
Price: IBM @ $116.47
Buy one Dec 23 IBM $108 put
Sell two Dec 23 IBM $111 put
Buy one Dec 23 IBM $117 put
Debit: $157
Starting position:
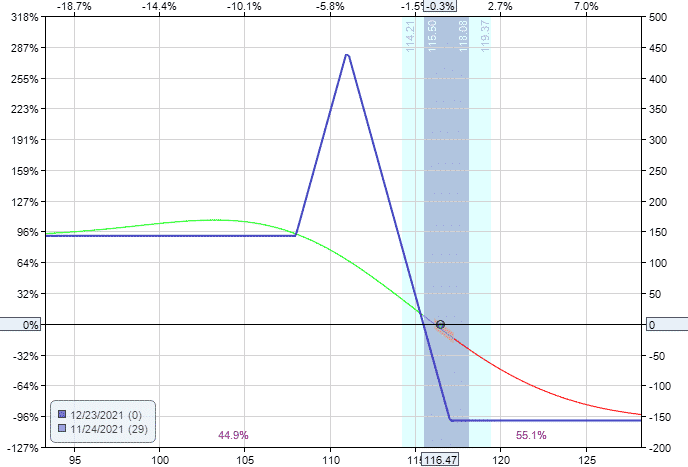
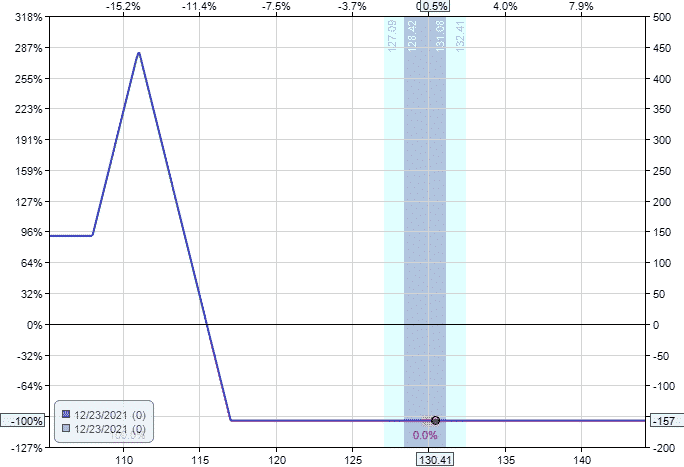
On December 23rd expiration, the price was above all the put strikes.
The puts expired out of the money worthless.
So we ended up losing what we paid for the butterfly, which is $157.
Ending position:
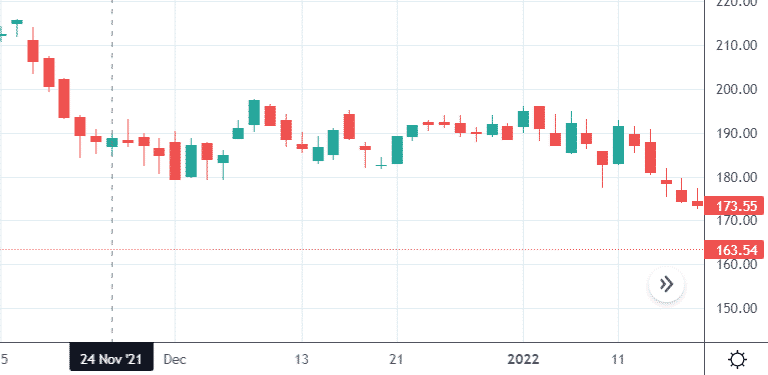
Case #3: Sideways
Now let’s see what happens to each of our four bearish strategies if the stock price just moves sideways, as in PayPal (PYPL) on November 24, 2021.
Bear Call Spread
Date: Nov 24, 2021
Price: $188.71
Sell two Jan 21 PYPL $220 call
Buy two Jan 21 PYPL $230 call
Credit: $191
On December 17 (with the price of PYPL at $186.20), the profit target was reached with a profit of $95.
Bear Put Debit Spread
Date: Nov 24, 2021
Price: $188.71
Sell one Dec 23 PYPL $185 put
Buy one Dec 23 PYPL $190 put
Debit: $243
The spread expired worthless on Dec 23. We lost the $243 that we paid for the spread.
Bearish Calendar
Date: Nov 24, 2021
Price: $188.71
Sell six Dec 10 PYPL $180 put
Buy six Dec 23 PYPL $180 put
Debit: $1002
One week later, on Dec 1st, the calendar profits $378.
The price of PYPL did come down slightly to $179.32.
But just like IBM, the implied volatility of PYPL also increased during that period, which boosted profits.
Broken Wing Butterfly
Date: Nov 24, 2021
Price: $188.71
Buy one Dec 23 PYPL $165 put
Sell two Dec 23 PYPL $170 put
Buy one Dec 23 PYPL $180 put
Debit: $161
Our butterfly expired worthless on Dec 23.
We lost the $161, the cost of the butterfly.
What We Have Learned
There are many ways to implement bearish option strategies.
We only looked at the credit spread, the debit spread, the bearish calendar, and the broken-wing butterfly.
Each has its own personality and behaves differently depending on the price and volatility movements.
The credit spread has high margin requirements.
It has a high risk to reward ratio. It makes its profit by getting the direction correct and the passage of time.
An increase in implied volatility hurts it.
When set near the money with each of the two options straddling the price, the debit spread has a much better risk-to-reward ratio — typically risk one to make one.
It does not require large capital or margin. What you pay for the spread is the max that you can lose.
The bearish calendar is placed with the strikes located where you think the price will go.
If the price does go there, the calendar can win big because it has a large reward-to-risk ratio.
A max potential profit of 4 times the initial debit is typical.
Like the debit spreads, what you paid for the calendar is the most you can lose from it (as long as you don’t alter the trade by making adjustments).
If implied volatility goes up during the trade, this can give a boost to the profits.
Conclusion
The broken-wing butterfly is infinitely configurable.
We have shown you only one configuration.
Butterflies can be narrow or wide with different wing width ratios.
It can be located near or far away from the money.
It can be used in directional plays, or it can be used to collect non-directional income via the passage of time.
Students of butterflies can go quite in-depth with all these nuances.
The butterfly structure consisting of both a credit spread and a debit spread makes them highly adjustable during mid-trade.
If we had performed an adjustment similar to the Reverse Harvey adjustment by rolling the upper long leg closer into the body of the butterfly as soon as we saw price going the wrong way, then we would have reduced our loss in case #2 and case #3.
Trade safe!
Disclaimer: The information above is for educational purposes only and should not be treated as investment advice. The strategy presented would not be suitable for investors who are not familiar with exchange traded options. Any readers interested in this strategy should do their own research and seek advice from a licensed financial adviser.


