

Income butterflies are non-directional options trades where you can pick up income consistently.
They have a good risk to reward ratio and have limited losses.
These butterflies are best applied on indices and ETFs to avoid earnings and stock risk.
Let’s backtest SPX and RUT income butterflies in 2021 and 2020, respectively, to see how much money they could potentially make for us.
Contents
- Underlying To Use
- Conditions For The Trade
- The Structure
- Logging Our Results
- Width Of The ings
- Puts Versus Calls
- Trade Management Rules
- Adding A Trend Filter
- Win Rate
- SPX Results
- RUT Results
- Conclusion
Underlying To Use
The two cash-settled indices SPX (S&P 500 index) and the RUT (Russell 2000 index), have no assignment risk.
The ETF of the Nasdaq with ticker QQQ is NOT cash-settled and does have an assignment risk.
Its index NDX is 40 times bigger at a price of $16500 for those who can afford it.
You now can use the cash-settled XND Nasdaq-100 micro-index, which came into existence in 2021.
The ETFs of SPY and IWM can also be used.
But if you are going to trade 10-lots of them, it’s better to use a one-lot of the SPX and RUT to save commissions which are based on the number of contracts needed to attain the same notional exposure.
Another downside is that SPY and IWM may not always have the strikes needed to slightly skew the butterfly slightly delta positive as we will do.
You can also try these butterflies on stocks while being mindful of earnings events.
Conditions For The Trade
We will just put the butterflies on whenever we can.
We don’t care if it is Monday, Tuesday, Wednesday, Thursday, or Friday.
For this backtest, we don’t look at the chart or the VIX or even implied volatility.
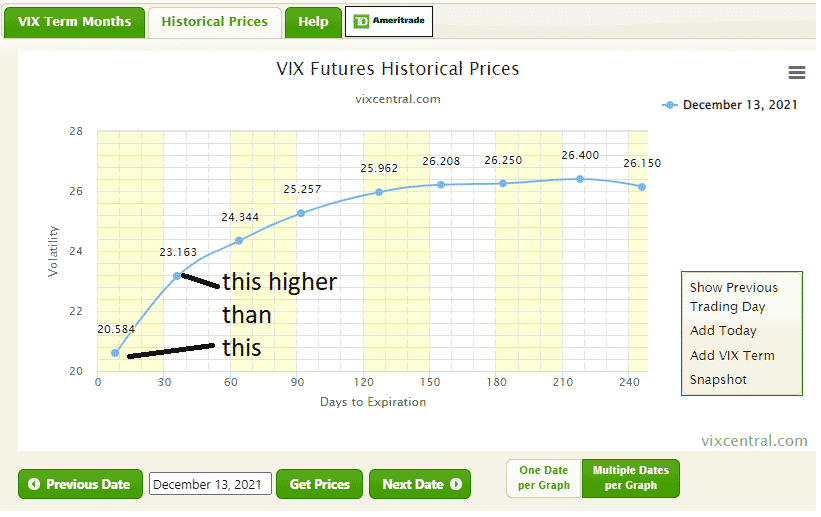
The one thing we looked at is whether the VIX Futures term structure for the front two months is in contango.
If it is, then we can put on the trade.
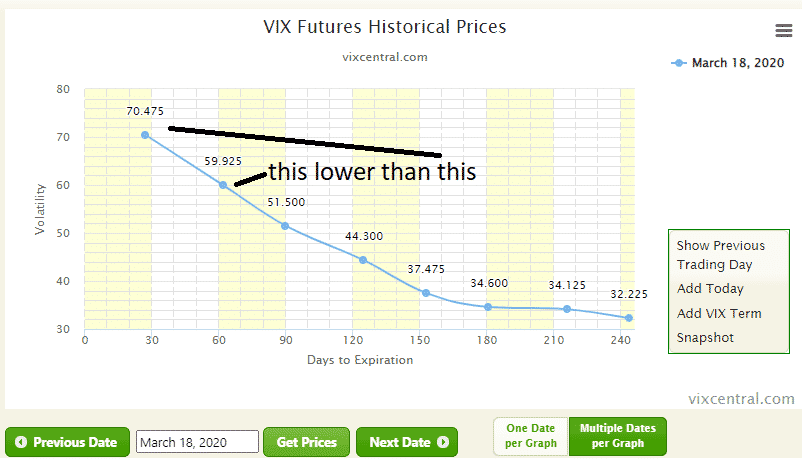
We exit the trade whenever the market goes into backwardation.
For example, vixcentral.com shows that December 13th, 2021, was in contango when we entered one of the SPX butterflies.
source: vixcentral.com
We did not put any butterflies from February 24th, 2020, to May 6th, 2020, because the term structure was in backwardation, which saved us from trading in a market downturn.
source: vixcentral.com
The Structure
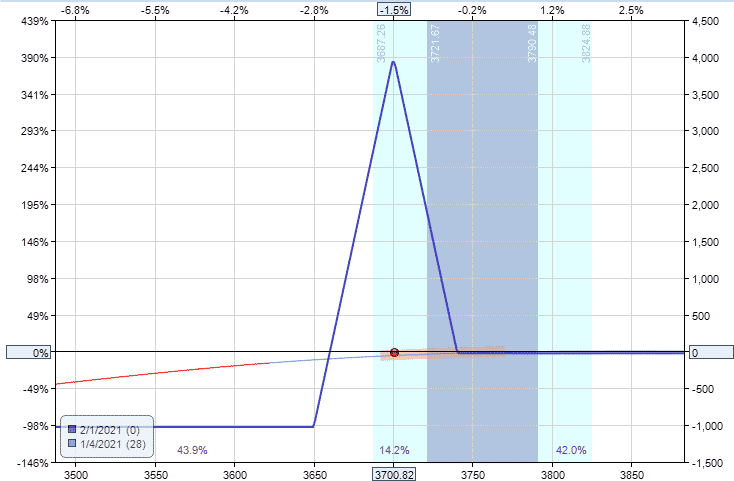
Here is an SPX butterfly initiated on January 4th, 2021, when the price of SPX is $3700.82.
Buy one Feb 1 SPX 3650 put at $69.15
Sell two Feb 1 SPX 3700 put at $85.65
Buy one Feb 1 SPX 3740 put at $102.40
Debit: -0.25
The payoff diagram looks like this.
source: OptionNet Explorer
Notice how flat the T+0 line is.
That means that price can make swings left and right and will not affect the profit much.
The line is slightly sloping up with a little positive delta of 0.90.
The taller and thinner the butterfly (higher reward-to-risk ratio), the flatter this line starts out.
As the butterfly matures, it loses this flatness.
Here the upside leg shows a profit of near-zero at expiration.
This is normal.
Sometimes it is a bit higher.
Sometimes it is a bit lower.
During the trade prior to expiration, it is possible for the price to be outside of the butterfly tent on the upside and still be profitable, as in the case of this trade when it was exited on January 19th with 13 days left till expiration.
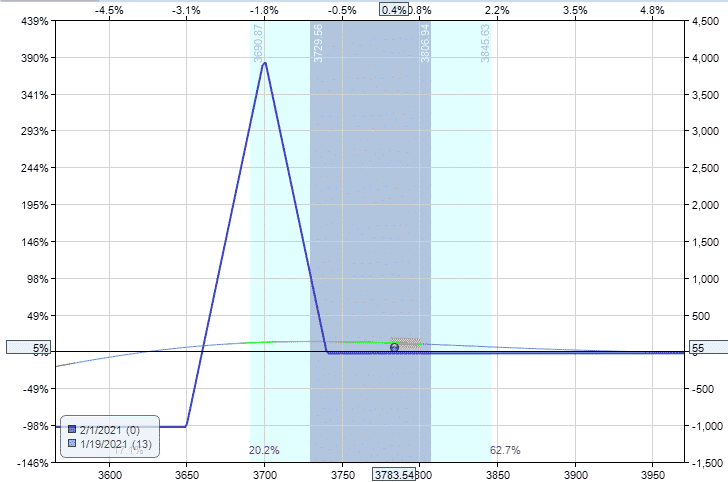
The butterfly generates income from theta. In this case, theta starts out at 4.65 and will increase as time goes by (with other things being equal).
Gamma starts out low at 0.02, which is what we want.
As we hold the trade longer, gamma increases in magnitude (for the at-the-money strikes), which we don’t want because higher gamma causes greater price risk.
Logging Our Results
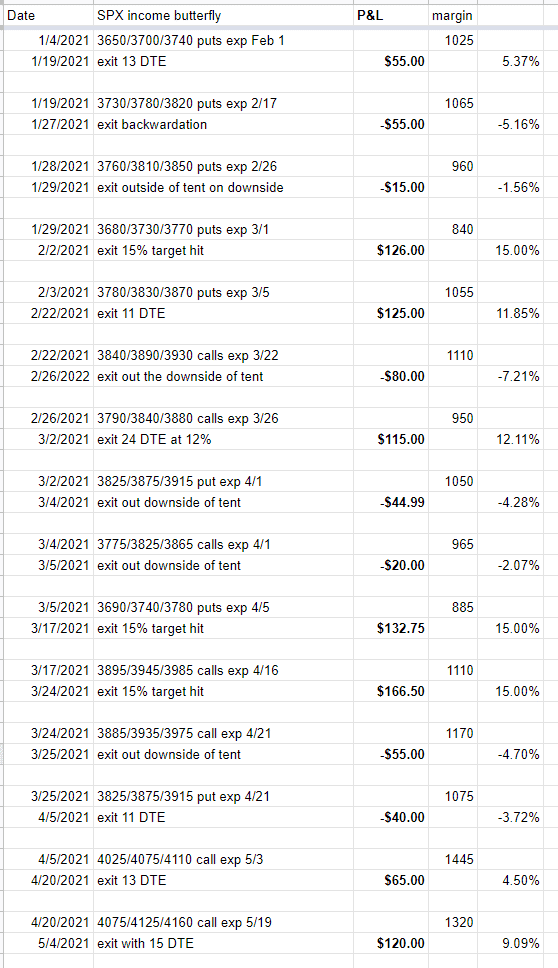
So, this trade exited with a profit of $55, excluding slippage and commission.
It had a max risk of $1025, giving a return of 5.37% on margin.
We log it as follows (with DTE being the number of “days to expiration” left when trade exited).
Width Of The Wings
If we had constructed a balanced, symmetrical butterfly, it would have started off with a negative delta due to the put-call skew in the market.
To give the butterfly near-zero or slightly positive delta (meaning we are ever so slightly bullish), we make the upper wing 40 points wide and the lower wing 50 points wide for SPX and RUT.
This gives us little or no risk if the price moves up, which is what the market tends to do a little more than going down.
The trade-off is the larger risk on the downside.
If the underlying is SPY and IWM, make its wings 4 and 5 points wide since they are ten times smaller.
Do the same for QQQ.
Puts Versus Calls
It doesn’t matter if you use all calls, puts, or a combination as in an iron butterfly.
We choose the calls if the two short calls are out of the money.
We chose the puts if they are out-of-the-money.
The out of the money strikes tend to have tighter bid/ask spread (and hence less slippage).
We chose the puts because the price of SPX was at $3700.82, which means that the $3700 center strike is out-of-the-money.
If we had chosen calls in the example, we would have a different initial debit or credit.
Buy one February 1st SPX 3650 call at $117.85
Sell two February 1st SPX 3700 calls at $84.70
Buy one February 1st SPX 3740 call at $61.45
Debit: –$9.90
The margin requirement will be nearly the same (although not identical).
However, these will not affect the trade’s probability or profitability.
Trade Management Rules
RULE 1
Do nothing if the price is inside the risk curve tent and there are more than 21 days before expiration. We don’t care what price is doing, what we are feeling looking at the candles, or even what the P&L of the trade is at this point (it can very well be negative, that’s okay). We let the statistics play out.
RULE 2
On the downside, exit the trade whenever the price goes outside of the tent. No questions asked. This will usually be a loser. Think of it as a stop-loss. Because you will be starting up a new butterfly right away, it is psychologically beneficial to re-frame this action as picking up the old butterfly and putting in a new butterfly that is more centered.
RULE 3
If the price goes outside of the tent on the upside, we continue the trade at our discretion. The possible loss on the upside is very limited, and if we give theta more time to work, it can very well still turn out to be a profitable trade.
RULE 4
If the trade has less than 21 days to expiration, start thinking to exit. If P&L is anywhere greater than 8% profit on the max risk of the trade, consider taking the profit and thank the market.
RULE 5
Exit the trade if there are less than 14 days to expiration regardless of P&L status. This is known as a “timed exit.” After this time, the butterfly has lost its edge. The T+0 line is no longer flat. Gamma risk is greater, and P&L will fluctuate more even with minor price moves. Replace this butterfly with a brand new fresh one.
RULE 6
Right after placing the trade, put in a standing order to exit the trade whenever P&L reaches 15% of the max risk of the trade. When this happens, it is a gift. The butterfly is exited before this target is hit most of the time. The standing order to there in case random price and volatility changes goes in our favor while we are not watching the screen. You don’t have to watch it more than once a day. In our backtest, we are only using and checking the historical option prices in OptionNet Explorer once a day (at two hours after the market opens).
RULE 7
If the butterfly exits, we put on another immediately or the next day provided that the VIX Futures term structure is in contango.
Adding A Trend Filter
These butterflies are structured to work better in a slightly up-trending market.
One may question whether this strategy will work in a bear market.
After all, the results reflect the fact that 2020 and 2021 were bull markets.
This is a valid concern.
Remember that the contango/backwardation rule keeps us out in large market sell-offs.
A further optimization to consider is to add a trend filter to ensure that the market is in an uptrend before putting the butterflies on.
You can use your favorite method for determining trends.
For example, we can add a rule that price needs to be above the 200-day simple moving average, and the 50-day moving average is above the 200 moving average before a trade can be placed.
Win Rate
In the SPX backtest for the year 2021, there were 20 winners and 18 losers, giving a win rate of 53%.
The average win of $103 is higher than the average loss of $59.
The RUT backtest was similar in that there were 18 winners and 10 losers — a win rate of 64%.
The average win was $105.11, and the average loss was about the same at $104.50.
If you look at the risk graph, the butterfly structure has a reward to risk that is 4 to 1.
Based on efficient options pricing and the relationship between reward/risk ratio to the probability of profit, the theoretical win rate should only be 25%.
This is true, provided that the trade is held to expiration.
That is why we get out of the trade during its second week of life.
This is where the edge is.
For the January 4th butterfly in our example, the price of the February 1st at-the-money straddle is $170.35.
As a rough estimate, we can say that the price can move $170 up or down till February 1st.
This movement is beyond the expiration breakevens shown on the graph.
However, the expected move for the first two weeks of the butterfly’s life is about $111.55. This movement is less.
Plus, the range of profitability indicated by the T+0 line on January 15th (when the butterfly has 17 days till expiration) is much larger than the profitability range at expiration.
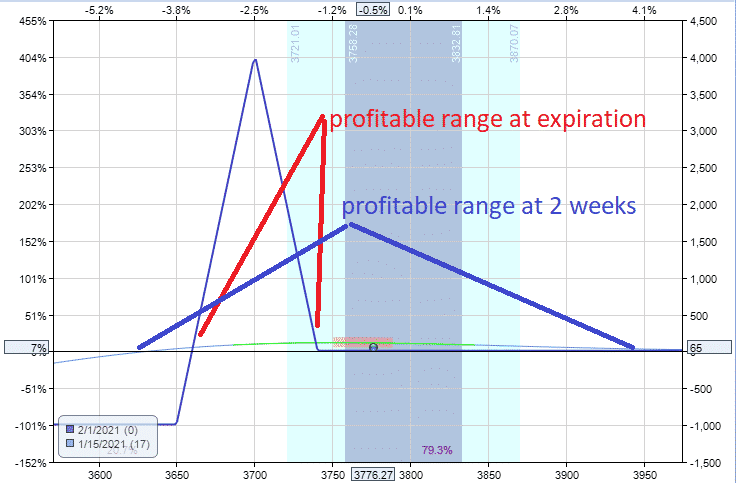
Hence our edge is in the butterfly’s first half of life, not the latter half.
SPX Results
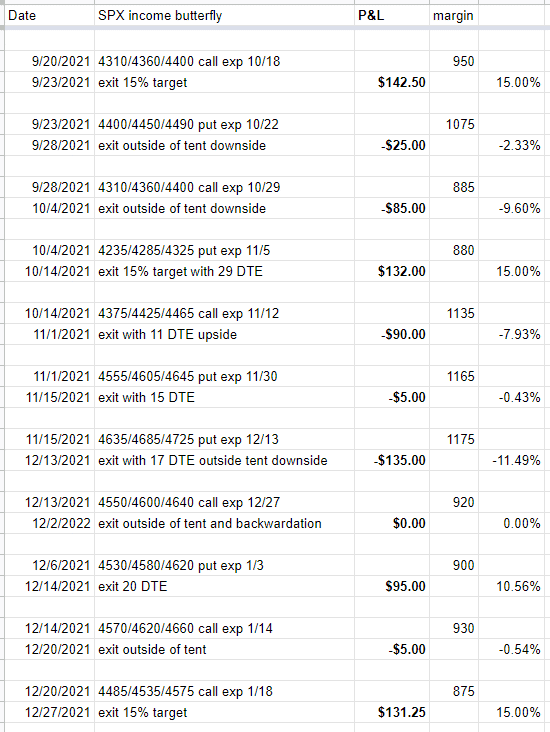
Using only one contract (with a max margin of $1500), the SPX income butterfly earned $1004 for 2021.
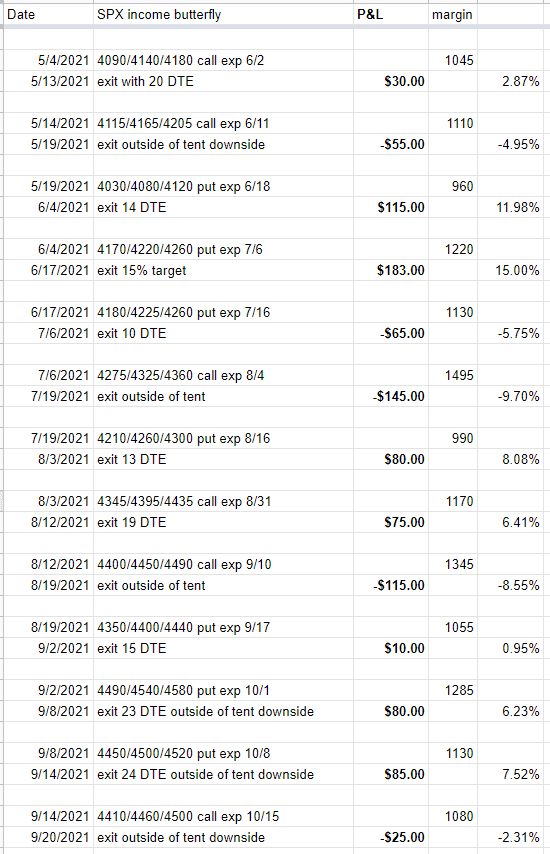
On average, it generated $84 a month using $1500 of capital — that is 5.58% per month, or 67% return annualized.
Taking into account losing trades, each trade returned on average 2.83% on the risk that it took.
RUT Results
Because the price of RUT is larger, it uses more capital.
But the results are similar.
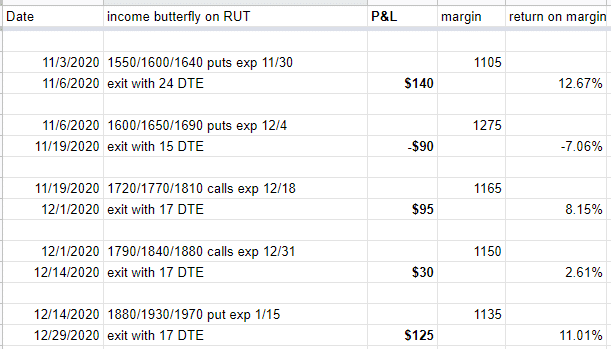
Profit for the year 2020: $936
Average P&L per month: $78
Average return per month on $2000 capital: $3.9%
Annualized return: 46.8%
Average percent return per trade: 3.64%
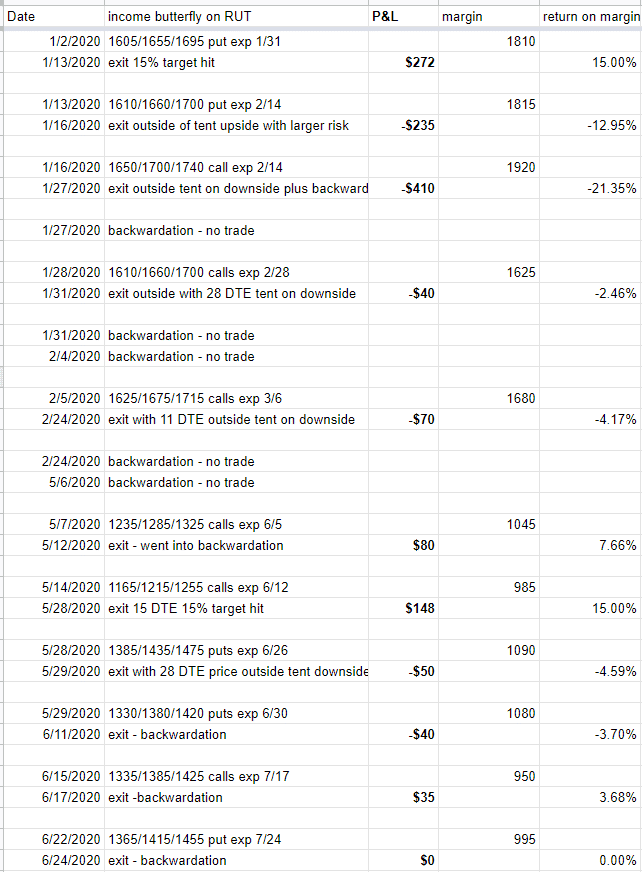
The last entry shown above exited at exactly breakeven.
These are not counted as winners or losers.
We ignored those trades in our calculations.
In the last three entries, we had to exit the trade pre-maturely when the market turned into backwardation in the middle of the trade.
Yes, we checked www.vixcentral.com every day that we are in the trade.
We also check every day to see when it returned to contango so we can immediately start up the butterflies again.
Sometimes it can be the very next day (as in the following trade listed below).
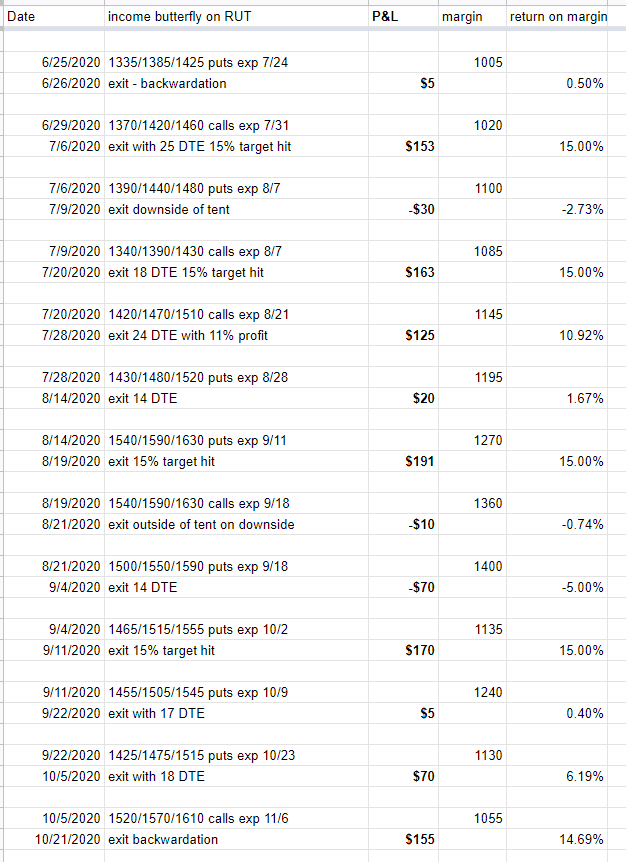
Oh, boy. More backwardation is seen on the log.
The year 2020 was a rougher year than 2021.
Conclusion
The structure of the butterfly was inspired by Dan Sheridan’s “Mango Butterfly” and Mark Fenton’s SPX butterfly
Dan makes non-directional trades a good portion of his portfolio.
These backtests have shown that it is possible for non-directional theta positive trades to “beat the market” even though the market, despite the market making impressive returns of 18.4% and 28.7% for years 2020 and 2021, respectively.
It makes sense that the SPX backtest made more money than the RUT backtest. Because the year 2021 was more bullish than the year 2020.
Averaging the results of the two backtest gives us an annualized return of 57%.
Trade safe!
Disclaimer: The information above is for educational purposes only and should not be treated as investment advice. The strategy presented would not be suitable for investors who are not familiar with exchange traded options. Any readers interested in this strategy should do their own research and seek advice from a licensed financial adviser.


Hello Gavin, Many thanks for the Butterfly Setup. Well I am fairly a new trader and I am starting with very limited capital and I think Butterfly strategy suits my conservative trading style. Can you please guide me if there are any books on specifically Butterfly Strategy or any contents, articles? I am gathering as much information as I can on Butterfly strategy before putting my capital on the market.
Sure, you can start here:
https://optionstradingiq.com/butterfly-spreads/
Great explanation as usual. Will it help to know the historical prices of butterflies?
Like 100 point ATM(body) 30 dte butterfly at 20 vix is $14.
Do you know where can we get this information?
You can try Option Net Explorer:
https://optionstradingiq.com/optionnet-explorer-review/