


Long Term Secrets to Short Term Trading is a book by Larry Williams.
You’ve never heard of Larry Williams?
He’s only been trading for 50 years.
He’s created a bunch of indicators, the most well-known of which is the “Williams %R.”
He once turned $10,000 into a million dollars in one year to win the 1987 World Cup Championship of Futures Trading.
Contents
- The Kelly Mirage
- Risk Management
- Market Is Non-Random
- Thoughts On Day Trading
- Market Structure
- Cycles
- Some Patterns
- Storytelling
The Kelly Mirage
Larry admits that he won this championship partly by luck.
He was using the Kelly formula, which he did not understand at the time.
The Kelly formula is very aggressive and aims to determine the trade size needed to maximize returns.
Given inputs of win rate and risk/reward ratio, the formula would sometimes tell you to bet 25% of your account into one trade.
What?!
That means four losing trades in a row would lose nearly your entire account.
On Investopedia any various sites, you will find the “2% rule” that says not to risk more than 2% of your account on any one trade.
The Kelly formula also assumes that the win rate remains very consistent — which you will not have (unless you are running a high-frequency algo).
In hindsight, Larry says that a 10% account risk per trade is too risky, resulting in a 34% draw-down with four losers in a row.
He has a system that is 86% accurate, and even that system will generate four losers in a row multiple times.
So the results could have easily gone against him, causing him to blow up his account and the competition.
Larry says in the book that he does not use the Kelly ratio now, nor does he recommend it. “Beware of the mirage.” [page 306]
Risk Management
Under the section My Most Important Market Belief, Larry writes.
“I have developed a powerful and profitable belief system: I believe the current trade I am in will be a loser . a big loser at that. This continues to be my most important market mantra. Winners we can handle, it’s the losses that kill you.”
This reminds him to stick with his stop-losses, not be complacent, and keep money management at the forefront of his mind.
He says.
“Loss control is still what separates winners from losers. In trading it takes only one trade that gets away from you to wipe out your bank account. Just one.”
Market Is Non-Random
Certainly, there is randomness in the market.
But it is not 100% random.
If it were, then like a coin toss, there should be a 50% chance that the close is greater than the open and a 50% chance that the close is less than the open.
But that is not the case.
There is a slightly higher chance that the close is greater than the open.
There is slight positive skew in the market.
For the S&P 500, the skew is about a 53% chance that close will be higher than open on any given day.
For the DAX from 1998 to mid-2011, if you buy after every red candle and exit on the same day’s close, you win 52% of the time.
But will have a net loss of –$60,558 because your losses are far bigger than your wins.
If the DAX was random, then a typical down day shouldn’t be larger than a typical up.
What if you buy after two consecutive red candles or buy after three consecutive red candles. The win rate and profits increase.
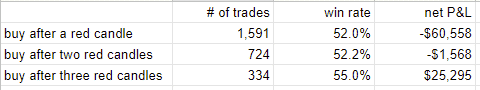
That doesn’t look random.
It says that a green candle has a greater chance of appearing after three consecutive reds than after one red.
A coin flip that is indeed random has a 50/50 chance of heads coming up even after nine heads in a row.
A coin does not have memory.
The market does.
Fond of analogies, Larry writes.
“…although that drunken sailor does swagger, stagger, and seemingly move in a random fashion, there is a method to his madness. He is trying to go someplace.”
In his colorful language, Larry says that chart patterns such as flags, W bottoms, head, and shoulders, etc. are
“Fascinating stuff, but wrong-headed.”
He doesn’t believe in Fibonacci either.
But if you do and it works for you, go for it. He says.
*”But to each his own. As they say, this is just one man’s opinion.”*
Thoughts On Day Trading
When Larry refers to “short-term trading,” he is talking about capturing a 2 to 5-day swing, not day-trading.
He doesn’t believe in trying to capture intra-day swings.
This opinion comes after bankrolling about two hotshot traders per year for 35 years.
He says, “I just don’t think it can be done.”
Under the section, The Real Secret to Short-Term Trading, he writes.
“The “secret” is that the shorter your time frame of trading, the less money you will make. It takes time for profits to grow.”
With day-trading, you can not hold a trend long enough to make money.
Hence you need to increase the size of your position, which means larger losses.
Opportunities come from large-range candles (rather than small-range candles).
But when this large range of candles happens, the price tends to open at one end of the candle and ends at the other end.
So, the best day-trading strategy he knows of is to buy at the open, put on a stop, and exit at the close (or later).
If you want to try day-trading anyways, read Chapter 9 of the book.
He will give you some more pointers.
Market Structure
What he does believe in are price action and market structure.
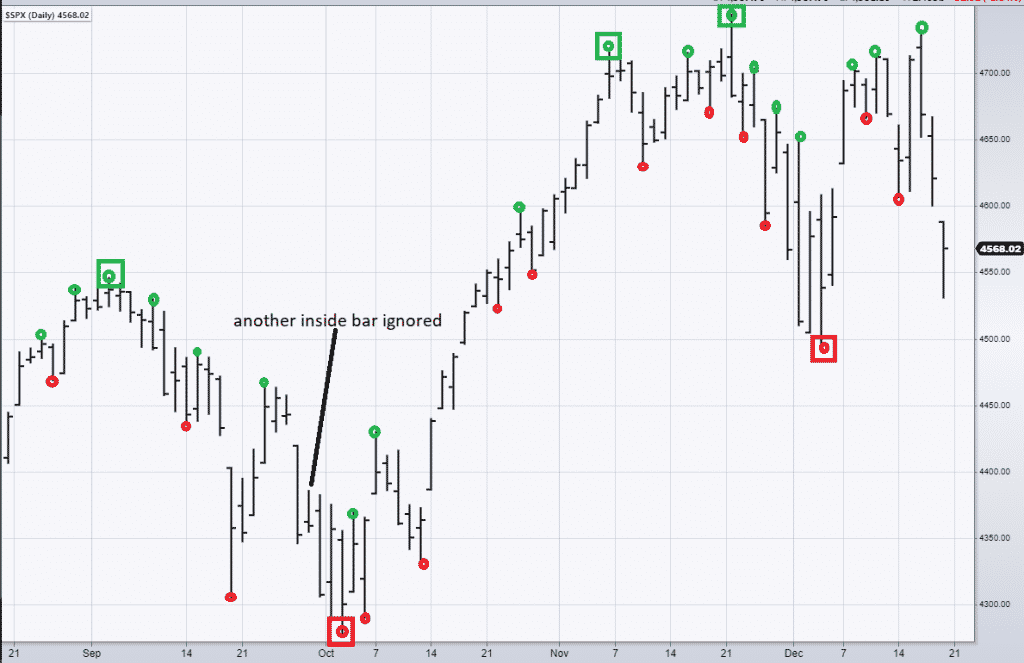
He defines a “short-term high” as any candlestick high where the preceding candle high is not as high, and the subsequent candle high is not as high.
Taking a recent screenshot from stockcharts.com as an example, I’ve circled all the short-term highs in the SPX chart.
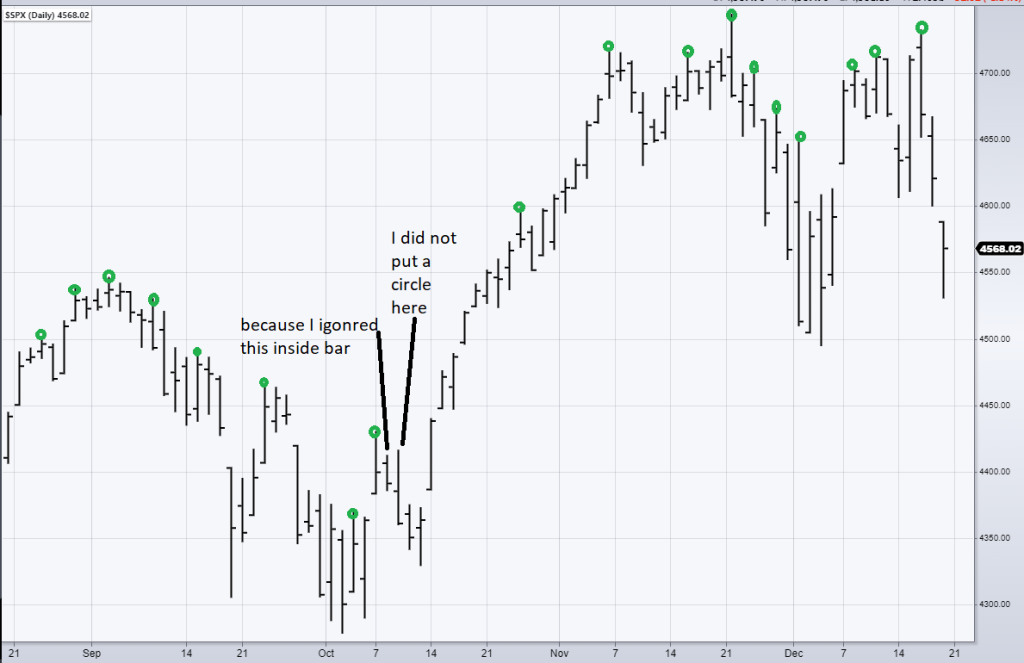
He says to ignore any “inside bars” (where the high is lower than the previous high and the low is higher than the previous low).
Pretend they are not there.
An “intermediate-term high” is any short-term high where the previous short-term high is not as high as it, and the next short-term high is not as high as it.
I’ve boxed all the intermediate-term highs.
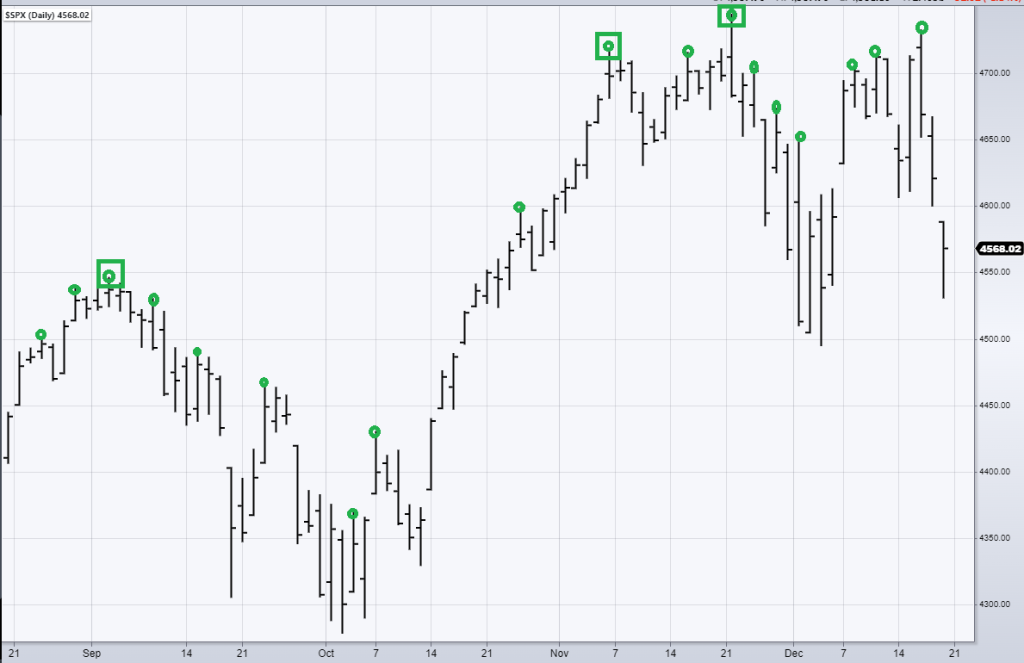
Do similarly for the short-term lows and intermediate-term lows.
Now connect the green and red boxes alternatingly in a zig-zag fashion.
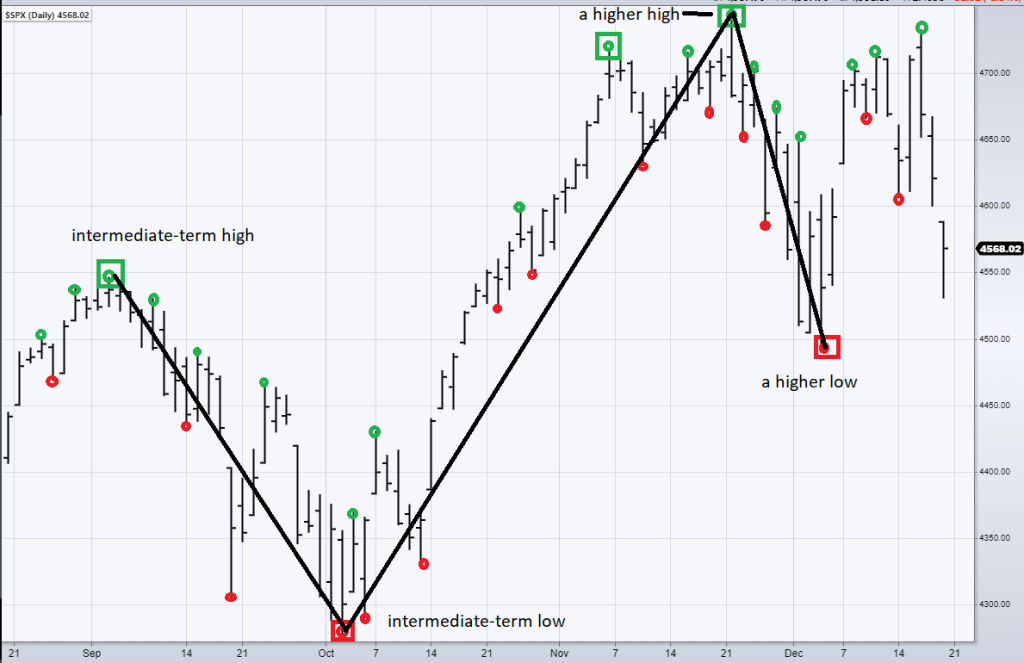
You may need to skip some boxes because you cannot connect a green box to another green box, for example.
The market is in a confirmed intermediate uptrend because you now see it has a high followed by a higher high.
It has a low followed by another higher lower.
Larry says your best opportunity is to follow the intermediate trend.
At this point, we don’t know if the trend will continue or break.
If the price goes lower than the low at 4500, the trend is broken because it means there will eventually be an intermediate-low to be formed below the low of 4500.
And that means we no longer have “higher lows.”
If that happens, it is a trend change, and we need to know when the trend changes.
Cycles
Larry is into market cycles.
He’s still looking into inter-market cycles to this day.
One takeaway from Chapter 2 is that a period of narrow-range bars is followed by a period of large-range bars, and vice versa.
You may see this pattern if you take a look at the ATR indicator or the Bollinger Bands width indicator.
The indicator cycles up and down, up and down.
Larry is also is fond of concepts such as “trading day of the week” (TDW) and “trading day of the month” (TDM), “seasonal patterns,” and likes reading the Commitments of Traders report.
He has statistics showing that the S&P500 tends to go up more on Mondays than any other day of the week.
And has a proclivity to sell off on Thursdays and sometimes spilling into Fridays.
The edge is small, but it proves the non-randomness of markets.
He does not trade this edge on its own but may stack this additional edge together with other statistical advantages of a particular trade.
He writes, “My strategy is to find a bias such as TDW and TDM and then couple it with another bias to load or stack the deck in my favor.”
Some Patterns
Larry has 1 to 5-day reversal type patterns that he trades. He says.
“The best patterns I have found have a common element tying them together: Patterns that represent extreme market emotions reliably set up trades for price swings in the opposite direction. In other words, what the public sees on their charts as being negative is most often apt to be positive for short-term market moves, and vice versa.”
Take, for example, an outside day with a close below the previous low.
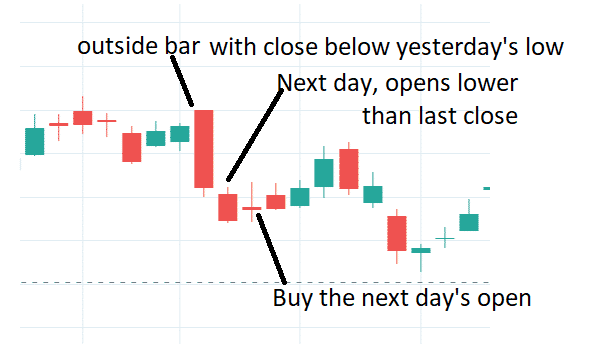
The textbook would say this is a “bearish engulfing” pattern.
And the public would most likely go short. But instead, he says it is bullish.
To further improve the accuracy of the bullish pattern, he says to wait for the day after the outside bar. If it opens lower than the outside bar’s close, then buy at tomorrow’s open, as long as tomorrow is not a Thursday — remember TDW and statistics on buying after multiple down days.
He exits such trades if his stop is hit or he exits at the first profitable opening.
This is known as his “bailout” profit-taking technique.
He may give the trade at least a day or two before the bailout exit in a slower-moving market.
If an opposite signal comes while in a trade, exit and go with the new signal without waiting for the bailout.
You never know, sometimes the bounce may last only one or two days, or it can last many days like the one below.
He trades commodities and futures, but not options.
So, these short-duration profit taking may seem relatively short-term for the typical option trader.
A workaround to consider is to look for these setups in the weekly chart and then trade the options on the daily chart.
His analogy is that the public is like fish that gets lured in by the wiggling worm of the market.
He was introduced to this concept from the works of Wyckoff, who thinks of the market as ruled by a collective mind or a “Composite Operator.”
This operator draws the public in at the wrong times, which is why so many retail traders lose, and some feel that the market is rigged.
Retail traders trade breakouts and get “trapped” when the breakout fails, and the stops are hit.
Larry trades the false breakouts using a couple of price patterns he termed “smash day reversals.”
Because the examples in the book use OHLC bars, I’ll illustrate what he means by using candlesticks here (because I know you probably like the looks of candlesticks better).
The first is the “naked close”.
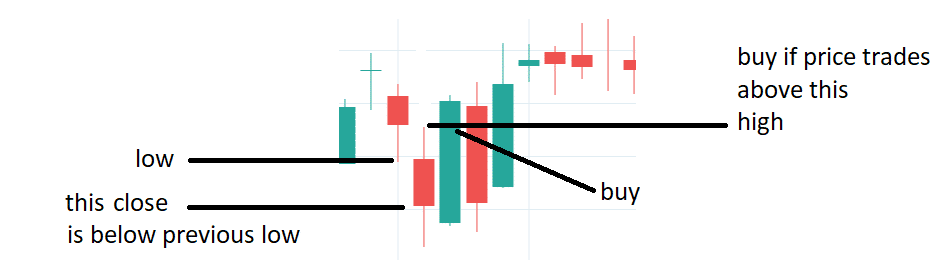
In the above, the setup candle is the red one that closed below yesterday’s low.
The public sees that as bearish and maybe going short (especially if it has broken down from a range).
Many times, they are correct.
However, if prices reverse immediately the next day (green candle) and go past the high of the setup candle, that is the trigger to go long.
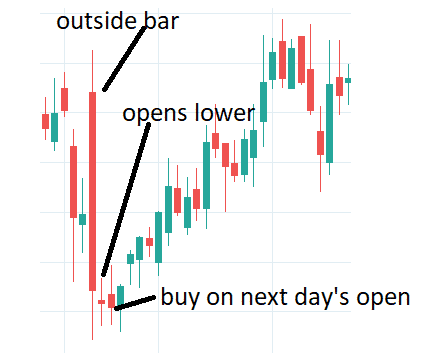
In the below example, the close of the setup candle clears the highs of multiple candles (even better).
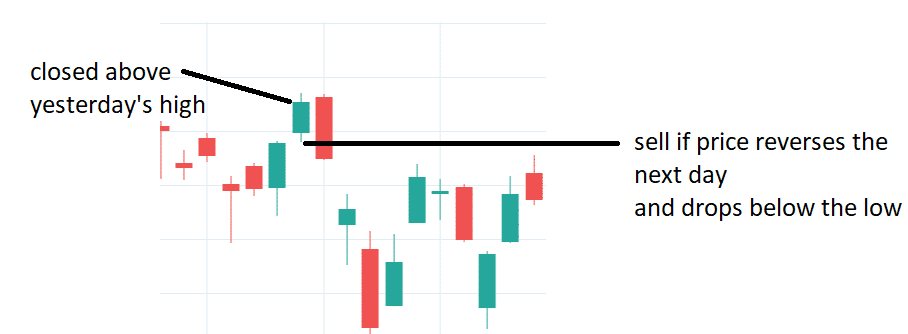
But if the next candle (red candle) reverses all that work and drops down below the low of the setup candle (possibly triggering a whole bunch of stops), then go short.
The second set of patterns is the “hidden smash day”.
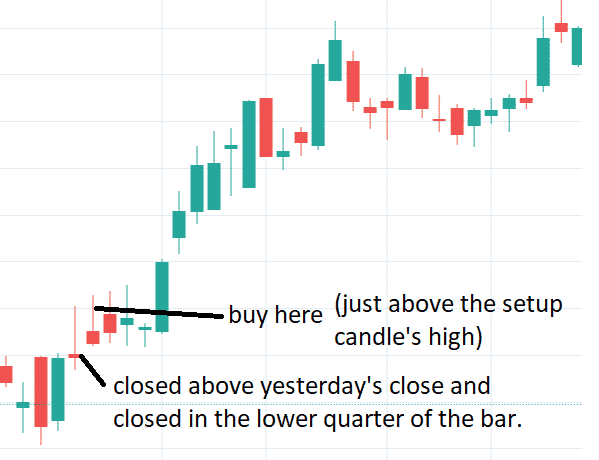
The setup candle is a candle that closes in the lower 25% of its length.
And the close is above yesterday’s close.
Often will have a long upper wick, which the public will see as bearish price rejection, which in many cases it is.
But in the case where it is not, as in the case when the next candle just shoots up past the wick, then it is a trigger to go long.
Below is the reverse example.
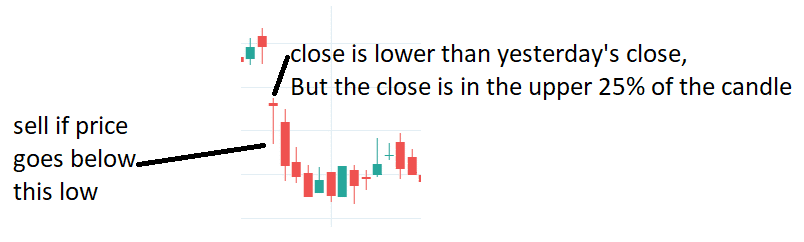
If it helps you to remember, think of this as a failed hammer pattern.
The public had been taught to buy the hammer with a long lower wick.
And much of the time, it works. Because hammers (especially weekly hammers) are quite strong patterns.
However, if the hammer is forming a lower close and the hammer fails by price breaking down below its tail triggering all the retail stops, then it is time to do the opposite and go short.
Trader Linda Raschke calls this pattern the price “eating the tail”.
Larry says that if “what should happen in the market doesn’t”, then trade in the direction of the new information.
Larry warns not to trade these patterns in isolation.
“The key, though, is to make certain you have something else backing the trade, something suggestive of the action you are taking, otherwise you are just using the price to predict price. Your best trades will come from loading the trade with several qualifiers, not just a price structure.”
Even though this book is in its second edition, it was published back in 2011.
So here I’ve picked out an example from recent charts showing the use of these patterns used in combination with false breakouts or breakdowns.
The market is in a range after a downtrend, and then there is a candle that closed below the low of the range.
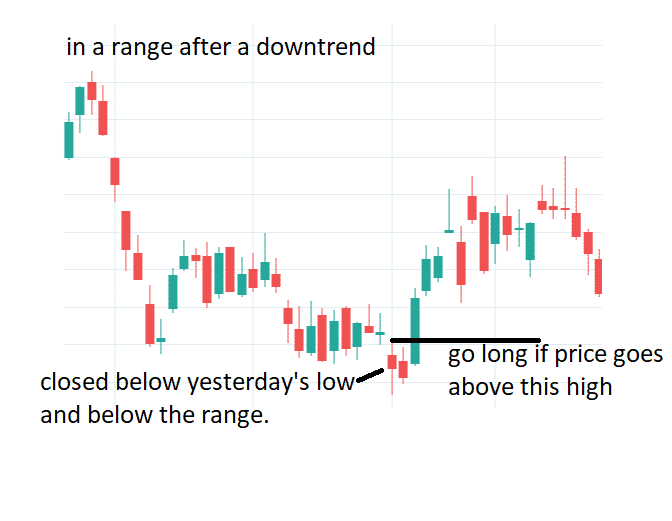
You would think that the price would continue down.
But what should have happened didn’t.
It reversed within one to three days, so we would go long in the reversal direction (that big green candle broke the high of the setup candle).
Storytelling
Turn out Larry likes telling stories.
“What did I like most about those hunting trips.” [page 22]
“I love to play Pick Up Sticks as a kid.” [page 315]
“My son, Dr. Jason Williams, is a psychiatrist trained at Johns Hopkins.” [page 380]
“Years ago, I was on the board of directors of a small bank in Montana.” [page 272]
“I will never forget campaigning for the United States Senate in the general election and knocking on doors.” [page 287]
Really? Do I really need to know that your father is a part-time bee-keeper and sells honey [page 312]?
If one has the amount of life experience and trading experience that Larry has, he’s entitled to his stories.
At least, we now know that Larry comes from humble beginnings where his father was.
“…putting in over 40 hours a week, then more hours on weekends at Doc Zinc’s stinky sulfur refinery. And as if that weren’t enough, he would stay up late at night reading books, taking courses on electronics.”
On page 20, Larry said that Jack McAferty “… was the toughest kid in Billings. Fact is, he was the toughest kid in the entire state of Montana.”
At that point, I wasn’t sure if I was reading a novel or a book on short-term trading.
He goes on to write something seemingly totally unrelated to trading.
“As a kid, I was not particularly good at fighting, but I was great at starting fights. In the late 1990s, I managed several heavyweight champion fighters.” [page267]
But he does, in fact, somehow relate each story to trading.
“While boxing may not seem germane to you in terms of trading, I assure you that there is no greater battle you’ll ever be engaged in, in your entire life, that is tougher than the market. . That battle is you versus the market, that battle is you versus other participants, and that battle is also you versus yourself.” [page 268]
Here is another.
“Getting in physical shape means going to the gym each day. a matter of using repetitive practice. From my former life as a marathon runner, I know that success depended on my ability to sustain discomfort for long periods. This is an invaluable mental asset for a trader. I looked at thousands upon thousands of days of charts and data, looking for patterns. In a very real way, I was paper trading — practicing — on the past.” [page 270]
Some readers will find the nuggets in his stories interesting. Other readers will be thinking or crying out loud, “Don’t tell me stories. Tell me how to make money already.”
Larry does tell some of his strategies in the book.
However, some of the strategies that worked then may no longer work today. Even Larry writes that .
“Fourteen years later, I would not be caught dead trading markets now that I traded at that time. The markets, like life, are full of change.”
And that .
“One of the markets I trade the most heavily in, bonds, traded in a totally different way after 1988 than prior to that date.”
On two other occasions, he writes.
“What once worked no longer works.” [page 216]
And “I estimate I made over $1,000,000 trading this pattern, but, sadly, it no longer works.” [page 204]
He says it is more important to learn and follow basic trading principles and respond to change rather than blindly trading an unchanging system.
He writes.
“I will stick to the fundamentals, as taught, with a healthy willingness to adapt to change. When I stay flexible, I do not get bent out of shape.”
Larry says you also need the right balance between confidence and fear.
“I have an immense fear of trading. I have seen people wiped out, losing all they owned from poor speculation. Some went bankrupt, some really did go crazy, and several killed themselves.” [page 288]
He writes of one such story.
“After we had developed a three-year friendship, he revealed to me his technique: to sell rallies and buy back on dips in the stock market… This was a great technique during that time period, and it amassed a fortune for Frankie. Then along came the most predictable, yet unpredictable, bull market of all time. What no one realized was that there would be no pullbacks along the way, as we had seen during the previous 18 years. . He kept selling rallies and was never able to cover on dips; there just weren’t any. Eventually, he became so frustrated with losses and the lack of success (like all great traders, he was also compulsive about winning), that he apparently committed suicide.” [page 147]
The story seems quite similar to that of Jesse Livermore, the trader portrayed in the book “Reminiscences of a Stock Operator.” Jesse was also a trader that had amassed great wealth and lost it all (multiple times) and in the end committed suicide. Clearly, the position size was way too big.
Win big, lose big.
Traders, please trade safely and do get yourself into the kind of danger as in these cautionary tales.
Trade safe!
Disclaimer: The information above is for educational purposes only and should not be treated as investment advice. The strategy presented would not be suitable for investors who are not familiar with exchange traded options. Any readers interested in this strategy should do their own research and seek advice from a licensed financial adviser.

Amazon Associate Disclosure
Options Trading IQ is a participant in the Amazon Services LLC Associates Program, an affiliate advertising program designed to provide a means for sites to earn advertising fees by advertising and linking to amazon.com


Hi Gavin, I want to draw you attention and give you trade idea as per the same book. Most probably you already read all book inside Larry explain that if buy SP500 every Monday and hold 6 six day that is very valuable strategy. So my idea is if we buy every Monday weekly SPY and leave expire ??? Could you backrest this idea ??
hi gavin, the info given by u in market structure is good but explains only one example . do u have another example where the market is not in intermediate term high.
Not at the moment, sorry.
This is one of the best explanation summary from Larry’s book.
I have 1 question, when we are marking the Short term highs & low’s. We know how to deal with inside bars.
But when there is outside bar. How to deal with it while marking the market structure. He just touches on it little bit in his book but never explained it in detail.
You have any explanation about it?
Thanks.