


Today, we are continuing our discussion on using multiple timeframe analysis.
This time we will look at specific examples and provide our backtest results.
Contents
- Introduction
- The Hammer Candle
- Market Noise
- Upward Sloping Moving Averagen
- The Benefits of Manual Backtesting.
- What Is A Pullback
- What To Do Monday Morning
- Bull Put Spread
- Targets And Exits
- First Example
- Second Example
- Third Example
- Backtest Results
- More Statistics
- One Trade Went Bad After Earnings
- Conclusion
Introduction
In the last article, we’ve introduced you to multiple timeframe analysis.
Today, we will give you an easy introductory strategy that has been backtested to show profitability.
It involves finding a hammer candlestick touching an upward sloping major moving average in the weekly chart.
Then dropping down to the daily chart to initiate a bull put spread if the next trading session produces a confirmation signal.
Don’t worry.
We will give you all the specific rules and show you our backtested results.
The Hammer Candle
When a hammer candle is formed, the psychology of the market participants is that bulls snapped up the stock on the decline.
Then they went back up in price where they started.
The market participants rejected the prices that are represented by the wick of the candle.
This means that prices are more likely to move above the hammer than below it, especially if the hammer appears at the bottom of a pullback in an existing uptrend.
To see the definition of a candlestick pattern and understand the psychology of the traders that this pattern indicates, see our previous articles here and here
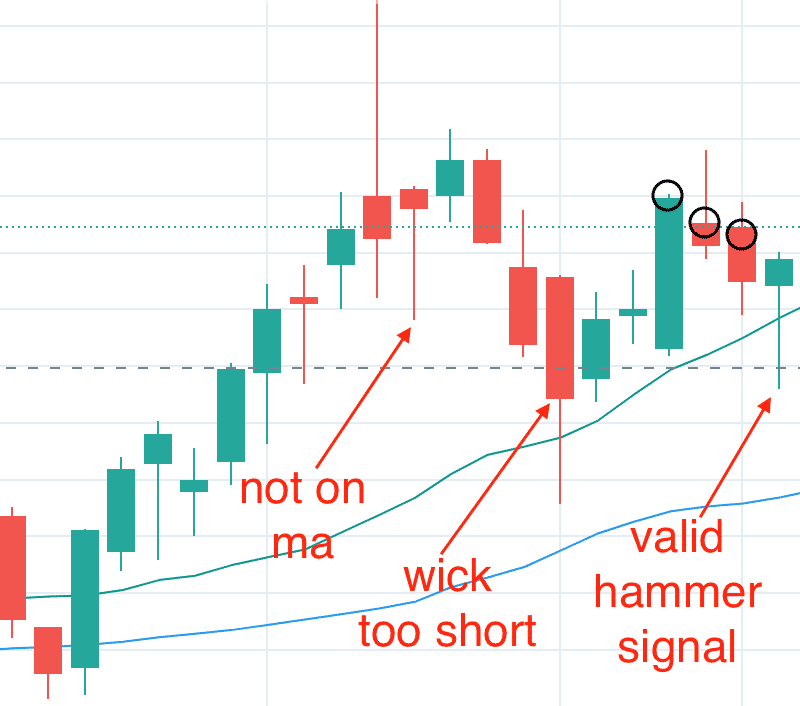
There are two common ways to determine if a candle is a hammer:
One is.
The bottom wick is at least twice as long as the body.
And the top wick is shorter than the bottom wick.
The body is the solid part of the candle defined by the open and close.
And then there is the stricter definition.
The open and close must occur in the top third of the length of the candle.
The size of the candle is defined by the high and the low.
For this particular strategy, we will use the first less stringent definition.
This will provide more opportunities for signals since this strategy doesn’t produce that many signals in the first place.
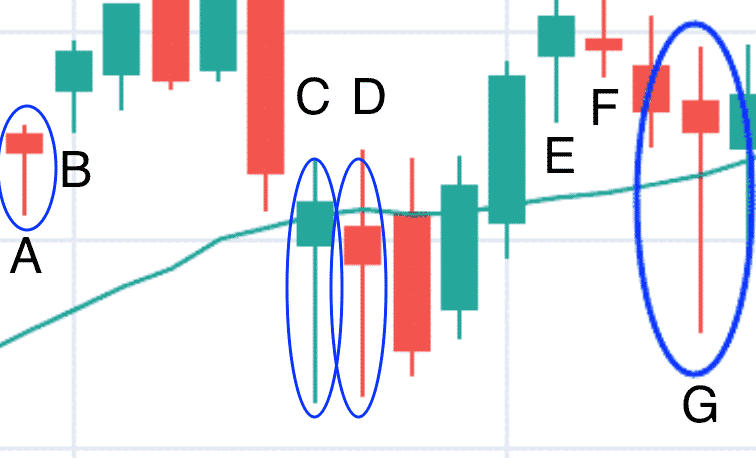
Per this definition, candles A, C, D, and G in the above screenshot are valid hammers.
Candles B and E do not have long enough bottom wicks.
And candle F has a top wick that is too long.
The color of the candle is not relevant.
Market Noise
The market has random noise.
Price can fluctuate up and down randomly for no reason.
Random noise and produce a hammer candle purely by chance, without any of the psychological sentiment associated with that candlestick pattern.
Many believe that this noise is more pronounced in lower timeframes.
That is why day trading is so difficult (if you have ever tried it).
Hence, we will look for the hammer in a higher timeframe (supposedly with less noise).
We will use the weekly candlestick chart.
Upward Sloping Moving Average
In addition, we need to find a hammer at the bottom of a pullback and touching an upward sloping major moving average — namely, the 20-period moving average, 50-period, or 200-period moving average.
The Benefits of Manual Backtesting.
As an exercise, you should look for these hammers at the bottom of a pullback that touches an upward sloping moving average and then see how price reacts after this candle.
Record and tally your results in a spreadsheet.
I have seen enough instances of this pattern that I already have internalized the belief that price will go higher after the hammer more often than not.
While you may want to believe me and say that you believe me, you may not have internalized that belief unless you have seen it with your own eyes.
If you have not internalized this belief, then you may start to doubt the strategy and override the rules and signals in the middle of a live trade.
This is one advantage of manual backtesting over automated computer backtesting.
I have seen computerized backtest results, and I have been told of backtesting results from reputable investors.
However, I don’t have as strong of a conviction as when I’ve done the manual backtesting myself (or forward testing with journal logs).
What is a Pullback
As you do your manual search of these hammers, you will run into questions.
Hopefully, you don’t have any more questions about what is a hammer candle.
But you might have other questions such as:
Is the following considered a pullback?
And what is meant by the hammer being at the bottom of a pullback?
Is this hammer at the bottom of a pullback?
How large of a pullback before I consider it as a valid signal?
This is where you refine the strategy to define the answers to these questions.
Set up rules to leave no scenario in doubt.
Here we will give you the rules that we used in our backtest.
Feel free to come up with your own rules.
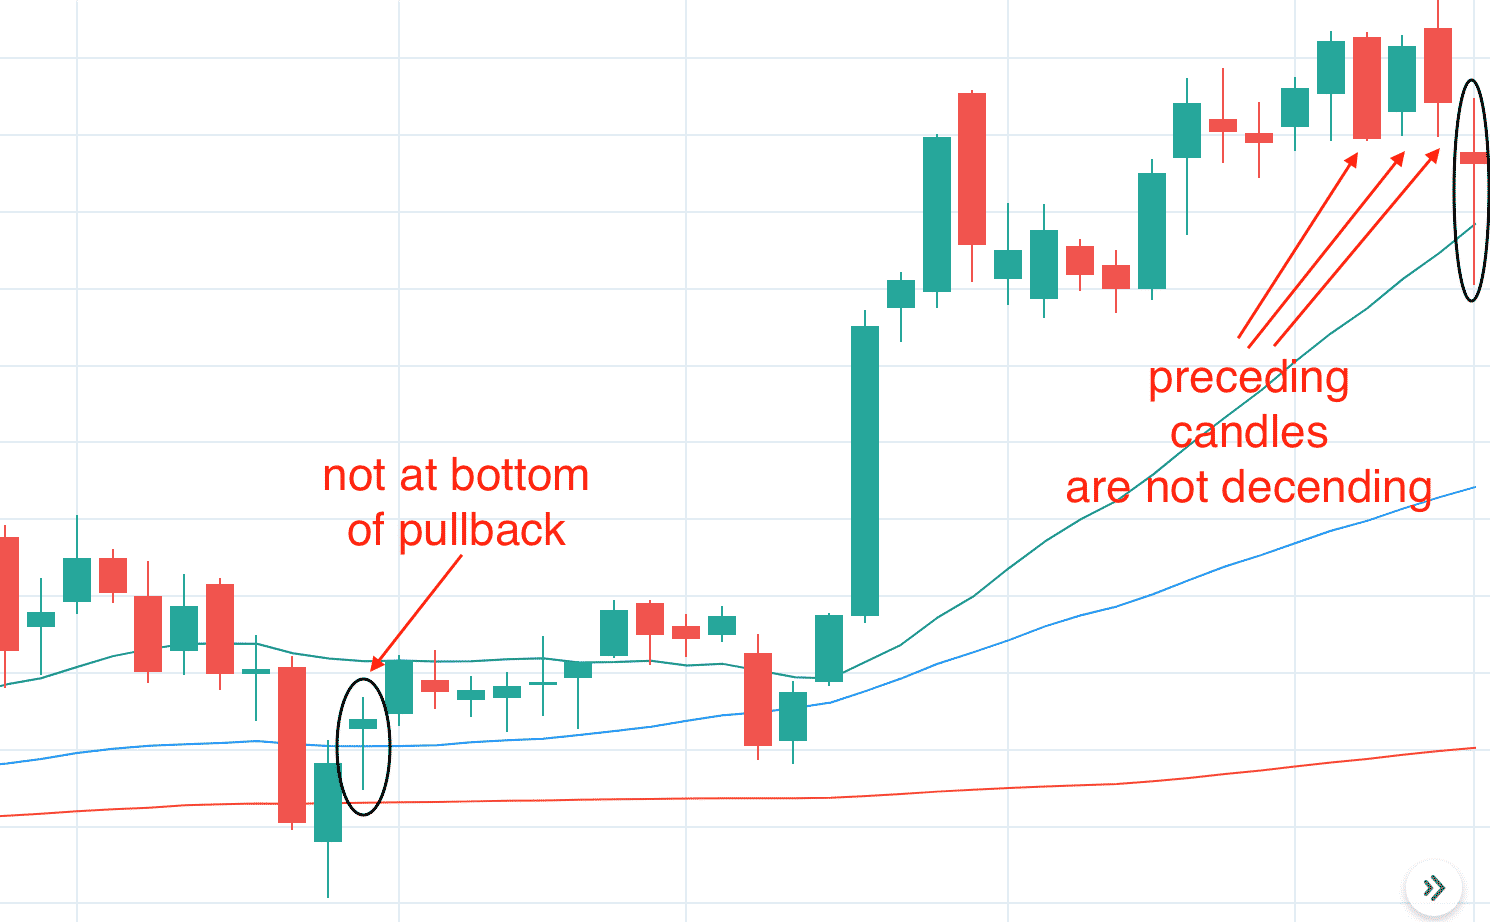
A pullback is a valid pullback if the preceding three candles before the hammer are either:
- a) all red
- b) the midpoints of the bodies are descending
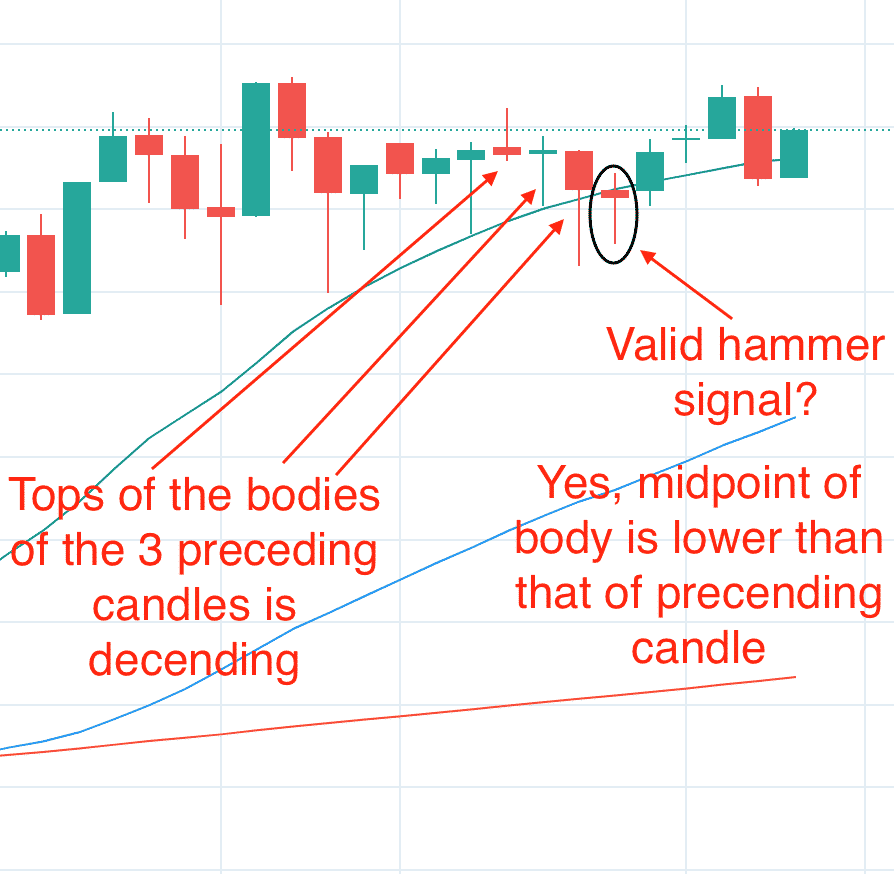
- c) the tops of the bodies are descending
- d) or the bottoms of the bodies are descending.
The hammer is at the bottom of the pullback, if either:
- a) the low of the hammer is lower than the low of the preceding candle
- b) or the midpoint of the hammer body is lower than the midpoint of the body of the preceding candle.
Per our rules, the following are all valid signals.
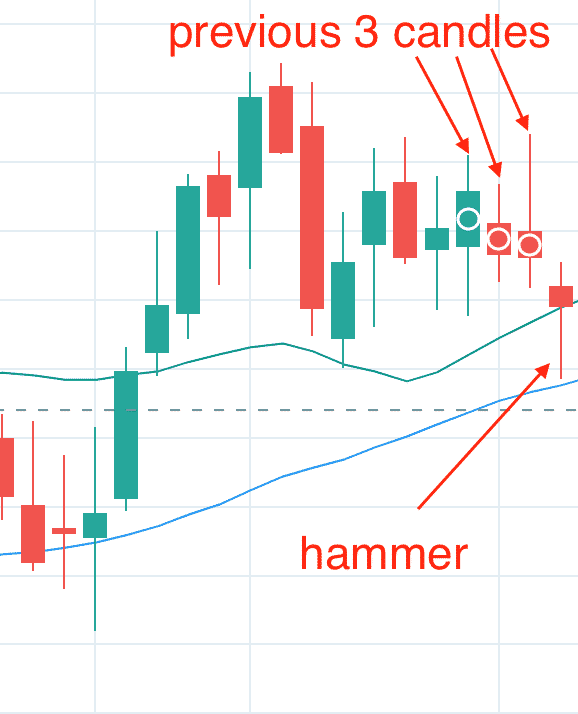
Another valid hammer:
Also a valid hammer:
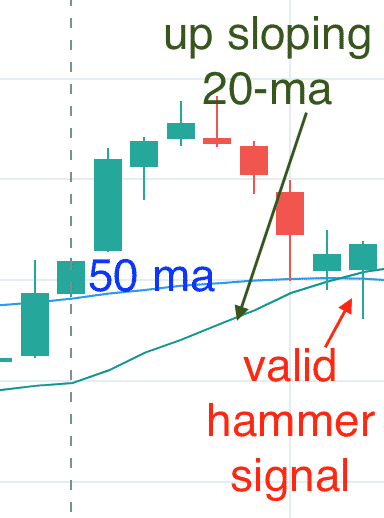
If the hammer sits on two moving averages, as long as one is sloping up, it is a valid signal.
However, the following two hammers are not valid signals.
When scanning for hammers at the right edge of the weekly chart, you need to wait for the weekly hammer to complete its formation.
That means you have to wait for the weekend to look for these.
What To Do Monday Morning
Once you find a set of tickers that just formed a hammer on the weekly chart, switch to a daily chart of that ticker on Monday morning.
If, at any time, the stock trades above the high of Friday’s daily candle, that is a signal to go long the stock.
If the stock never trades above the previous trading session’s high, then there is no trade.
If Friday or Monday is a holiday, then adjust accordingly for previous or next trading sessions.
Bull Put Spread
If you get the confirmation signal on Monday, put on a bull put spread with the short leg at around 25 delta and the long leg at 15 delta.
Use the next monthly expiration that is greater than 38 days away.
For our backtest, we are using end-of-day numbers from OptionNet Explorer.
In your live trading, you can put on the spread whenever you like, of course.
Or put in the order Monday evening to be executed on Tuesday morning.
Targets and Exits
If the bull put spread makes 50% of max profit, exit the trade and take the profit.
If the price closes below the short strike, exit the trade (most likely for a loss).
If there are less than 21 days to expiration, exit the trade and take whatever profit or loss at the time. This is known as a timed exit.
If you don’t want to monitor the trade, you can put in an automated order to take profit, set an alert if the price closes below the strike price, and set a calendar reminder when there are less than 21 days to expiration.
We are keeping the rules simple for the sake of the backtest.
But if you have spread management strategies in place that works for you, feel free to use them.
We believe that profits can be increased from the backtest results if you have a good strategy for hedging and rolling spreads when they get tested.
But that’s a topic for another day.
First Example
In this weekly chart of Verizon Communication (VZ).
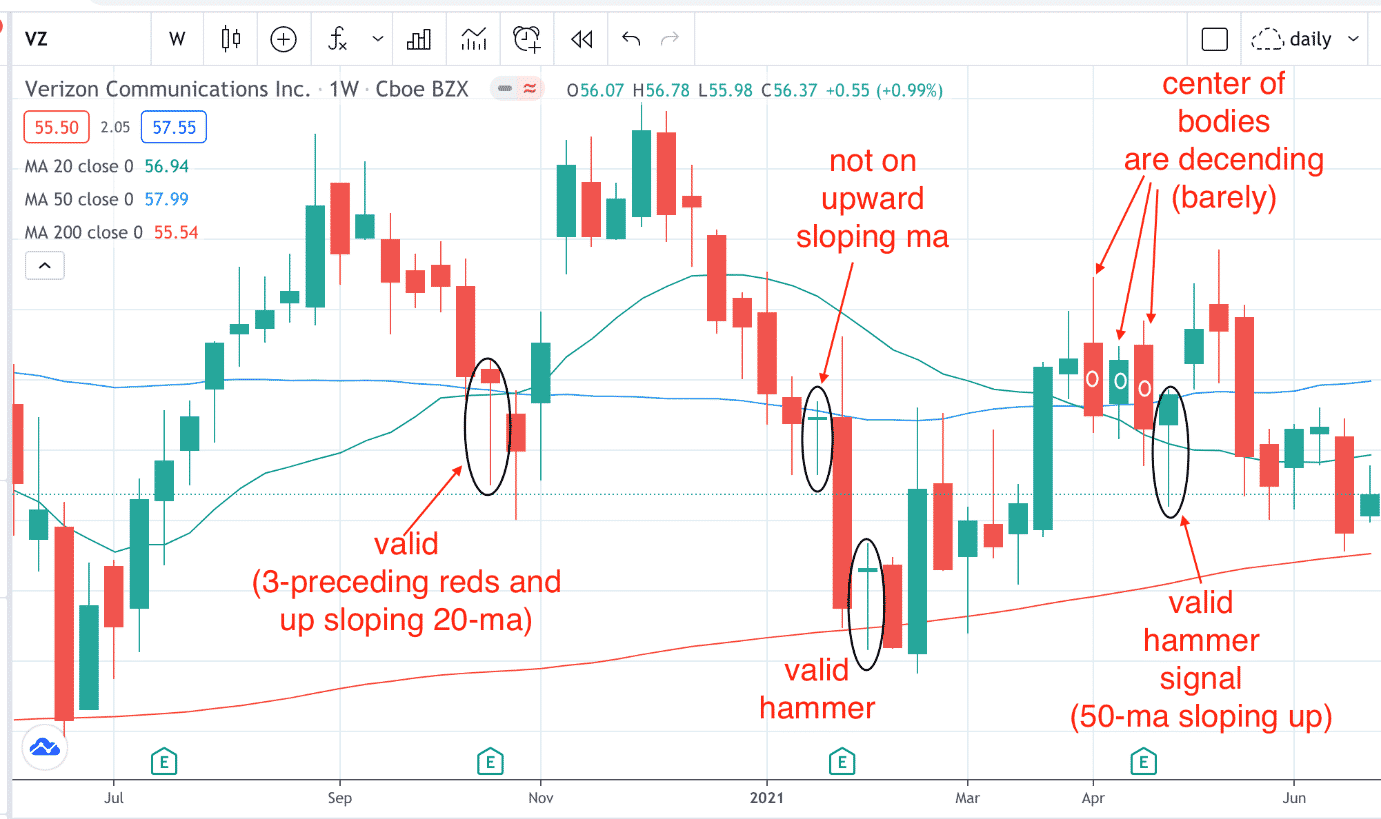
We see four hammers, only three of which are a valid signal:
1) the hammer on the week of October 26th, 2020
2) the hammer on the week of February 1st, 2021
3) and the hammer on the week of April 26th, 2021
Let’s take the trade based on the hammer formed on the week of October 26th, 2020.
The following Monday is November 2nd, and we switch to the daily chart.
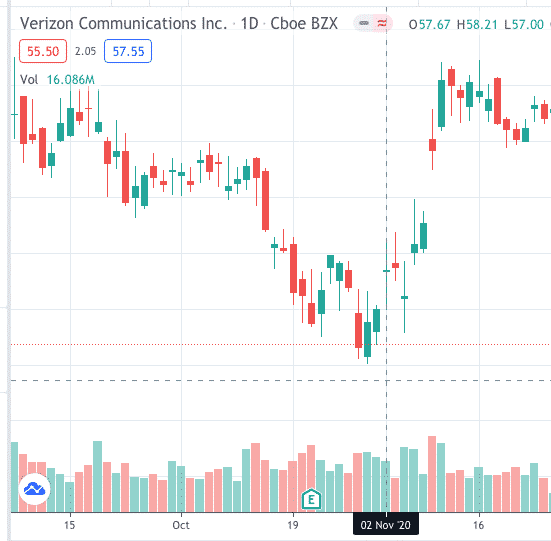
On November 2nd, the stock traded above the high of its previous candle.
So the following bull put spread was initiated in OptionNet Explorer.
Date: Nov 2, 2020
Price: $57.70
Buy 14 Dec 18 VZ $52.5 put @ $0.46
Sell 14 Dec 18 VZ $55 put @ $0.84
Credit/Share: $0.38
Initial Credit Received: $532
Max Risk: $2968
Risk/Reward: 5.58
We trade enough contracts to get an initial credit of at least $500.
This keeps the position size of each trade roughly the same.
VZ gapped up on November 9th, which causes our trade to cross the profit threshold of $266 and exit the trade.
In our backtest, we will note a profit and loss (P&L) of $266 — assuming automatic profit taking when that level was reached rather than putting the P&L at the close of the day.
So the first hammer was a winner.
Second Example
Let’s look at the VZ hammer on week on February 1st, 2021.
The Monday trading day is after the weekly hammer is February 8th.
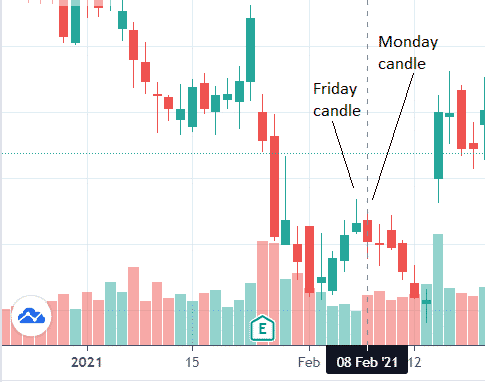
We on the daily chart that the February 8th session did not trade above the head of Friday’s candle.
Therefore no trade.
This confirmation rule did keep us out of a potentially bad trade. We see that the price kept going down the rest of the week.
We see that it would not have been a good trade on the weekly chart because the candle following the hammer did not go up even though the hammer was touching the upward-sloping 200-period moving average.
To be profitable, it necessary to know when NOT to trade.
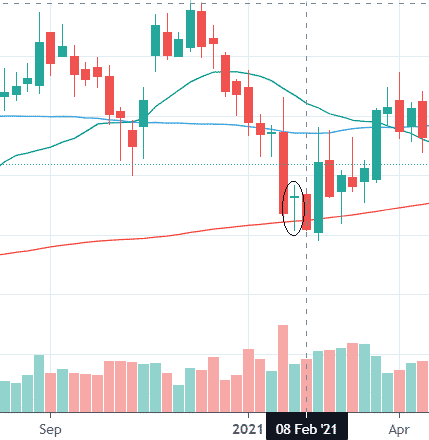
Third Example
Now let’s look at the hammer on VZ the week of April 26th, 2021.
The following Monday, May 3rd, did trade higher than the head of the previous candle.
We are good to go.
Date: May 3rd, 2021
Price: $57.92
Buy 8 Dec 18 VZ $55 put @ $0.34
Sell 8 Dec 18 VZ $57.5 put @ $0.96
Credit/Share: $0.63
Initial Credit Received: $500
Max Risk: $1500
Risk/Reward: 3
Profits of $250 were taken one week later, on May 10th.
Backtest Results
Okay, so we have two data points.
And both trades were winners.
Find at least 30 such hammer patterns and see what those results are.
Anything less than 30 can be attributed to luck.
Ideally, you should probably do 100 of these — or at least enough until you have confidence in the pattern.
Uh, wait. One hundred times?
That’s going to take hours, maybe days.
Umm, yeah.
When you see an athlete makes a beautiful jump shot, putting a basketball through a hoop, you are not just watching their work during the game.
There were many hours of practice that went into that shot. Same here.
Okay, we will do the first 30 trades for you.
You can do the remaining 70.
This is very tedious work, sometimes done late at night, and not done by a computer.
So if an error crept into one of these, forgive me.
By doing enough occurrences, if one or two errors are made (either in the backtest or in live trading), then it probably will not invalidate the results.
According to the following 30 backtest trades:
Results:
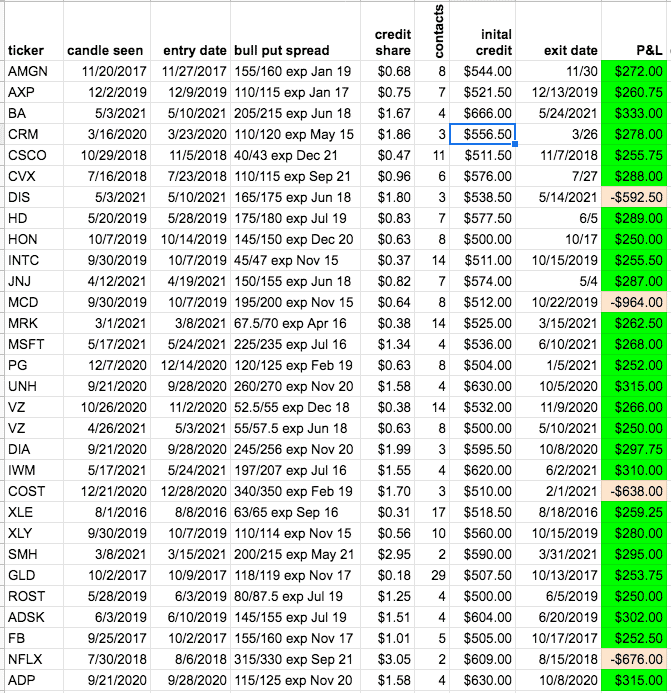
We have 26 winners and 4 losers, giving an 87% win rate.
The win rate of a strategy does not tell you whether a strategy is profitable or not. You need the amount of the average win and the amount of the average loss as well.
Amount of average win: $276.84
Amount of average loss: –$717.63
Average loss / average win = 2.6
With the average loss being almost three times greater than the average win, one loss will typically wipe out three wins. This means that you need at least a 75% win rate to be profitable with these statistics.
The backtest shows an 87% win rate, so this should be a profitable strategy.
Calculating the average P&L of the 30 trades, we do see that it is positive.
P&L of average trade: $144.24
Plugging our numbers into “Trader’s Equation”…
(average win) x (percentage winner) <=> (average loss) x (percentage losers)
$276.84 x 0.87 <=> $717.63 x 0.13
$240.85 > $93.29
We see that we get a positive expectancy with the winning percentage times the average win being greater than the losing percentage times the average loss.
More Statistics
The better you know the characteristics of a strategy, the better you will trade it.
With a spreadsheet, it is easy to calculate more statistics.
With an initial bull put spread credit of around $552 for each spread, the average max risk of these spreads was $2805.
The average risk to reward ratio of these bull put spreads is about 5.
The percent gain on the max risk is… $144 / $2805 = 5%
Average days in trade: 10 days
The shortest trades took 2 days.
The longest trade in the backtest went for 35 calendar days and exited with the timed exit with 18 days till expiration.
That trade lost –$638.
The trade that lost the most had a loss of –$964.
The trade that won the most had a profit of $333.
One Trade Went Bad After Earnings
It is always good to look at what happened in the trade that lost the most money.
McDonald’s (MCD) saw a hammer on the week of September 30th, 2019.
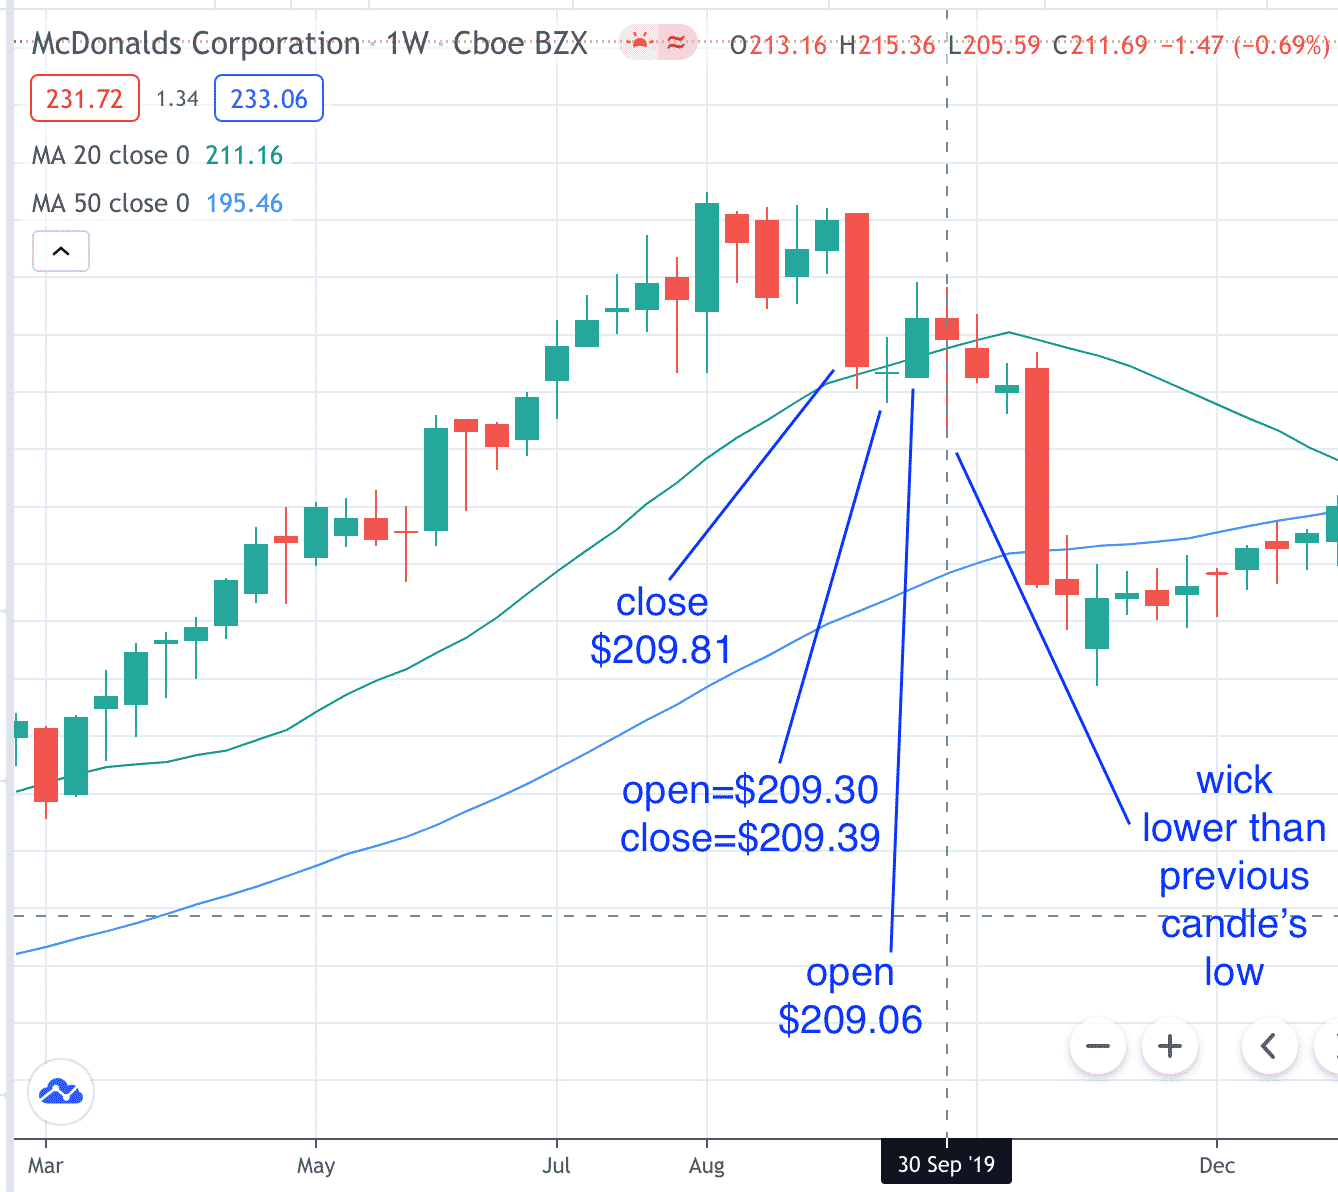
It is a valid setup.
The bottoms of the bodies of the three preceding candles are descending. The wick of the hammer is lower than the previous candle.
The hammer is touching the 20-period upward sloping moving average.
Although, right after the hammer, the moving average starts turning down.
The daily chart does show that the following Monday traded above Friday’s high — a valid confirmation signal.
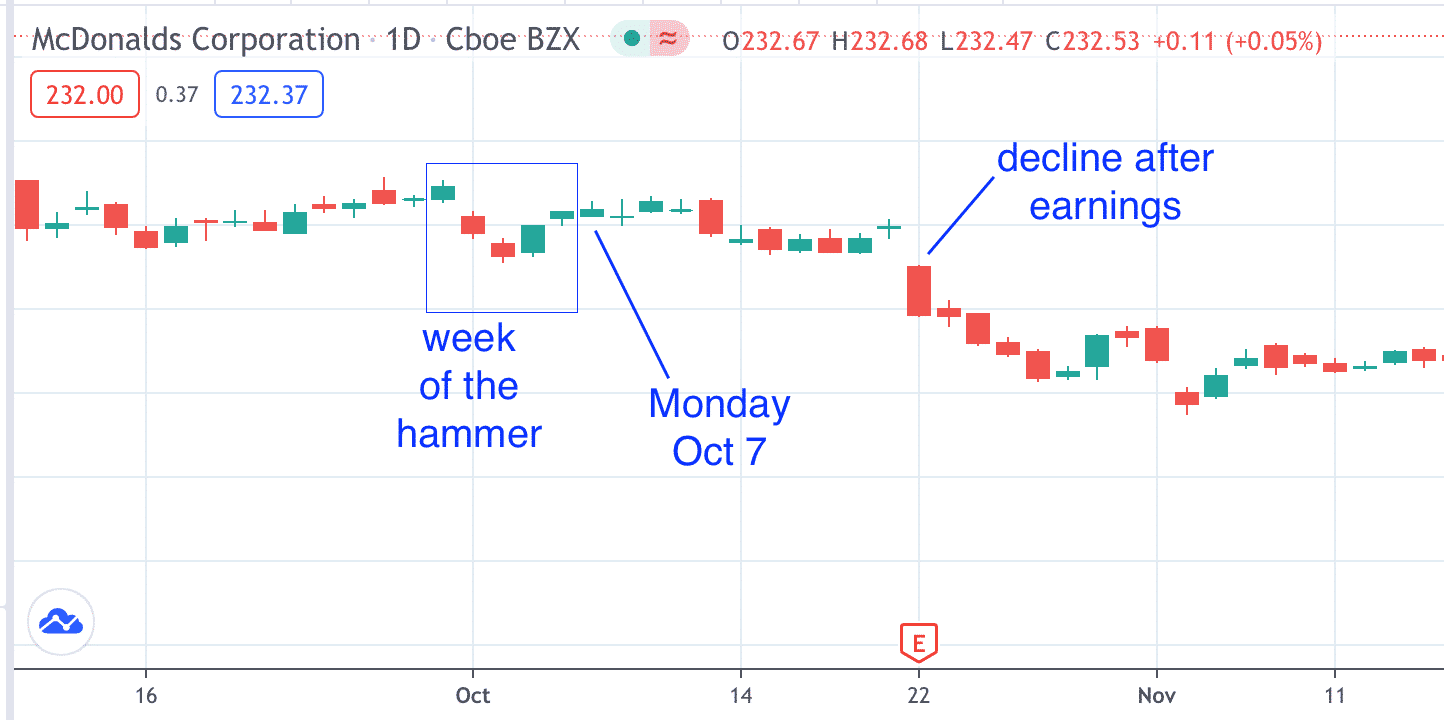
But look. We see that our trade duration happened during an earnings announcement in which the stock price declined.
Some investors may choose to opt-out of trading over earnings.
But that’s up to you.
Conclusion
Backtesting shows that trading the weekly hammer on the daily chart using bull put spreads following specific rules is a profitable strategy.
However, one problem was noticed only when doing the manual backtest because this pattern is rare to find.
There are some stocks where this pattern does not occur for many years.
To get enough occurrences to make enough profits, traders may have to look through many tickers.
Possible improvements on this strategy to increase the number of occurrences could include relaxing the rules — perhaps require only a two-candle pullback instead of three candles.
Allow for trades even on flat moving averages in addition to upward sloping.
Consider it be a positive confirmation if Monday or Tuesday trades above the high of Friday.
And so on.
Of course, if you alter the rules, the statistics will be different, and you have to backtest to see if it still gives you positive results.
But at least now you know how to backtest strategies.
Trade safe!
Disclaimer: The information above is for educational purposes only and should not be treated as investment advice. The strategy presented would not be suitable for investors who are not familiar with exchange traded options. Any readers interested in this strategy should do their own research and seek advice from a licensed financial adviser.


