


Today, we are looking at multiple timeframe analysis.
You will learn what this is and how to use it.
Contents
- Introduction to Multiple Timeframe Analysis
- Multiple Timeframe Analysis Example
- It Does Not Always Work
- Alignment In Multiple Timeframes
- Bearish Example
- What’s Next
Introduction to Multiple Timeframe Analysis
Suppose we were looking at the logs of an investor initiating long trades based on double-bottom chart patterns.
Double bottom patterns don’t work all the time, but this investor’s trades have higher reliability than expected.
What is the secret?
Could it be that another indicator is being used in conjunction with the pattern?
Yes, that definitely could be.
Another possibility is that the investor’s trades are being informed by the technical analysis of a higher timeframe — using a chart that is not the chart that is being traded on.
That is the case that we’ll talk about today.
The investor starts the analysis in the higher timeframe and then trades in the lower timeframe.
For option investors, the weekly and the daily timeframes are good choices.
For longer-term investors, the monthly and the weekly timeframes may also work.
This article will use the weekly candlestick chart as the higher timeframe.
Each candle represents a week.
The date on the horizontal axis is the date on which that trading week starts.
We will use the daily chart as the shorter timeframe in which we will trade.
Keep in mind that support and resistance, trendlines, charts, and candlestick patterns work in all timeframes.
The investor starts the technical analysis on the higher timeframe.
When this timeframe shows a bullish signal, the investor drops down to a lower time to looks for or waits for a bullish signal before initiating the trade.
Hence the trade is started when multiple timeframes agree, providing a greater degree of reliability.
Multiple Timeframe Analysis Example
For example, consider Microsoft (MSFT) on the weekly chart.

We see prices nicely contained above the 20-period moving average.
Since we are on a weekly chart, the 20-period moving average is the 20-week moving average.
On the week of May 10th, 2021, MSFT came down to touch the moving average and then went back up, forming a hammer.
The following article will see how important a weekly candle touching an upward sloping moving average is.
But for now, we are expecting next week’s candle to continue up above the head of the hammer.
On Monday, May 17th, the start of the following weekly candle, we switch to the daily chart to see if any bullish pattern emerges — providing us an opportunity to enter into a bullish trade.
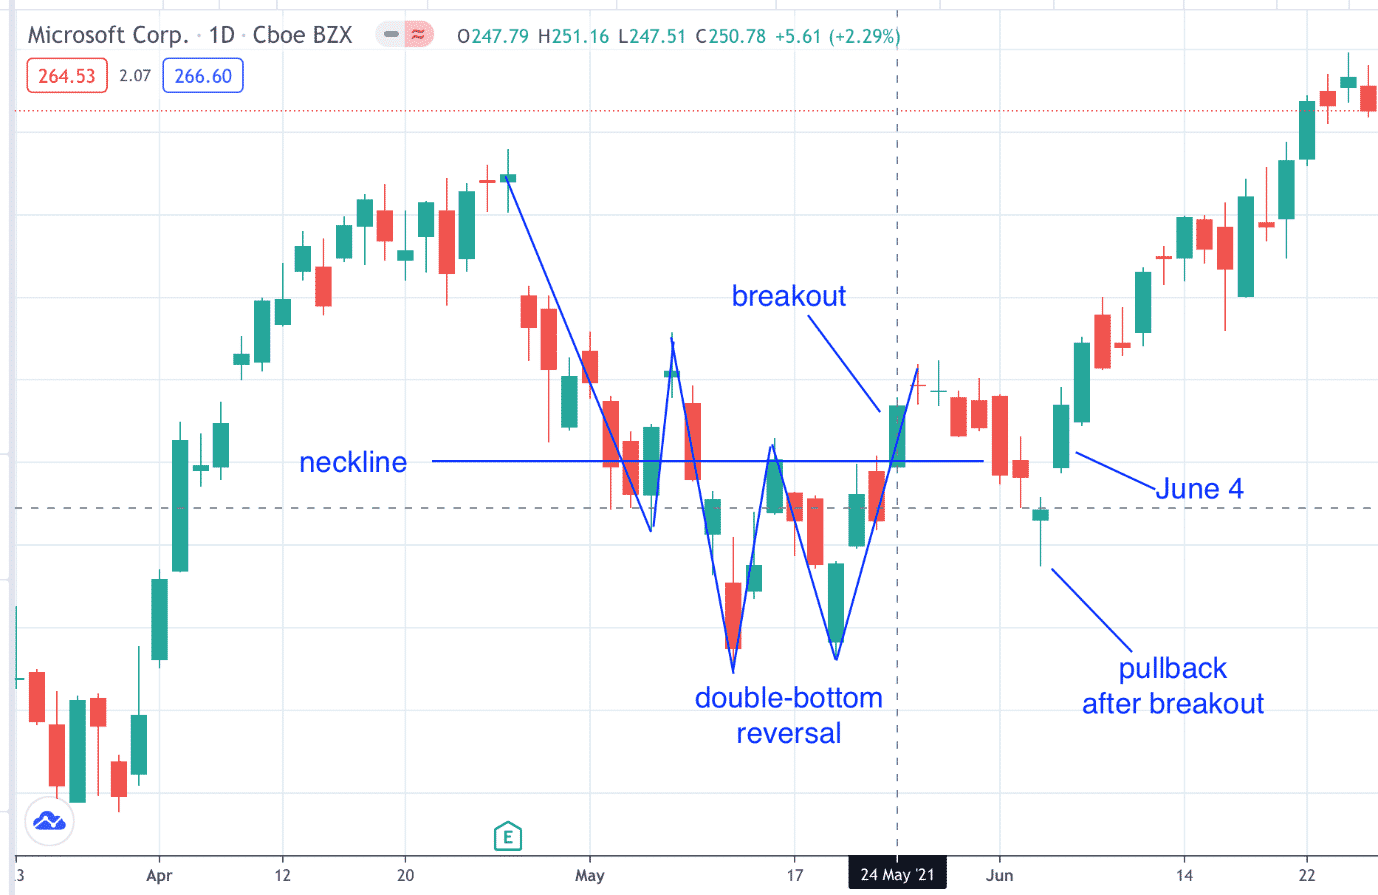
On May 24th, we see prices break above the resistance neckline with a bullish candle after forming a double-bottom reversal pattern.
An investor can go long at the close of this daily candle.
But be prepared to hold through a possible pullback.
Or the investor can wait for a possible pullback and then go long (as on June 4th after the daily hammer).
Either way, prices continue up after that.
This should turn out to be a successful trade.
It Does Not Always Work
Similarly, consider Walmart (WMT) on the weekly chart in the latter half of 2020.
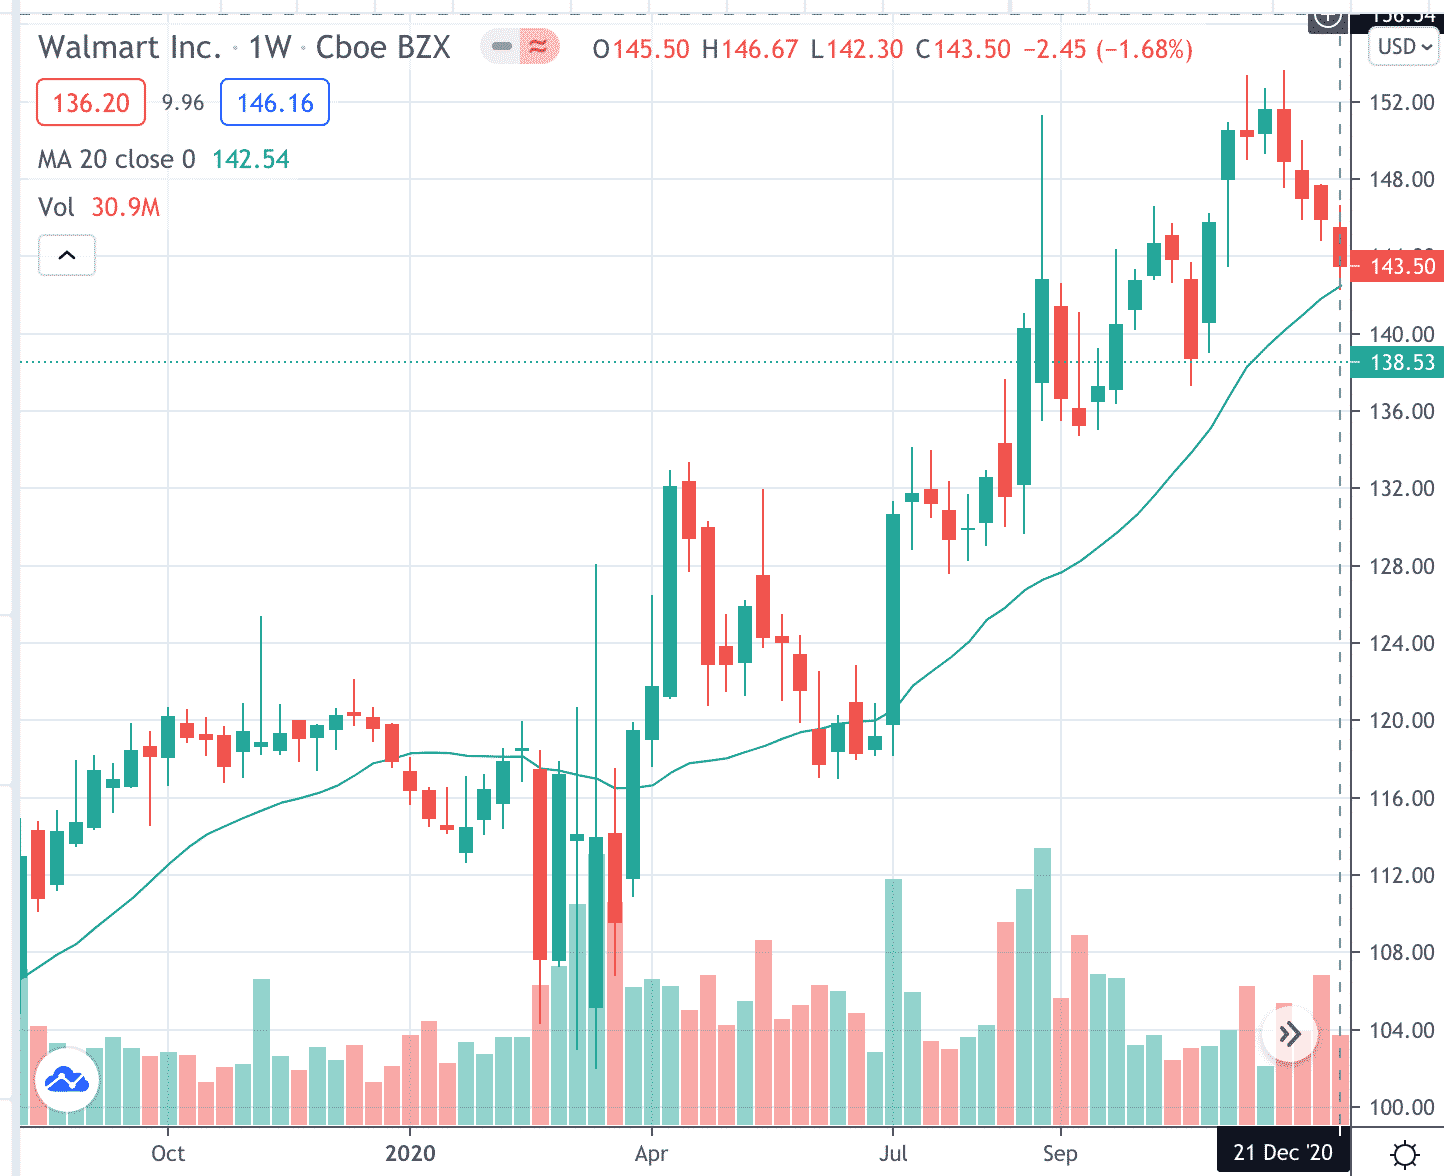
WMT was in an uptrend above the 20-period moving average.
On the week of December 21st, 2020, the price came back down to touch the 20-period moving average.
Since this can represent a place of value, the investor is looking for a bullish trade expecting the price to bounce up from the 20-week moving average.
The investor switches to the daily chart on Monday, December 28th, to see if a bullish technical pattern appears that week so that they can go long (either purchasing the stock or using options).
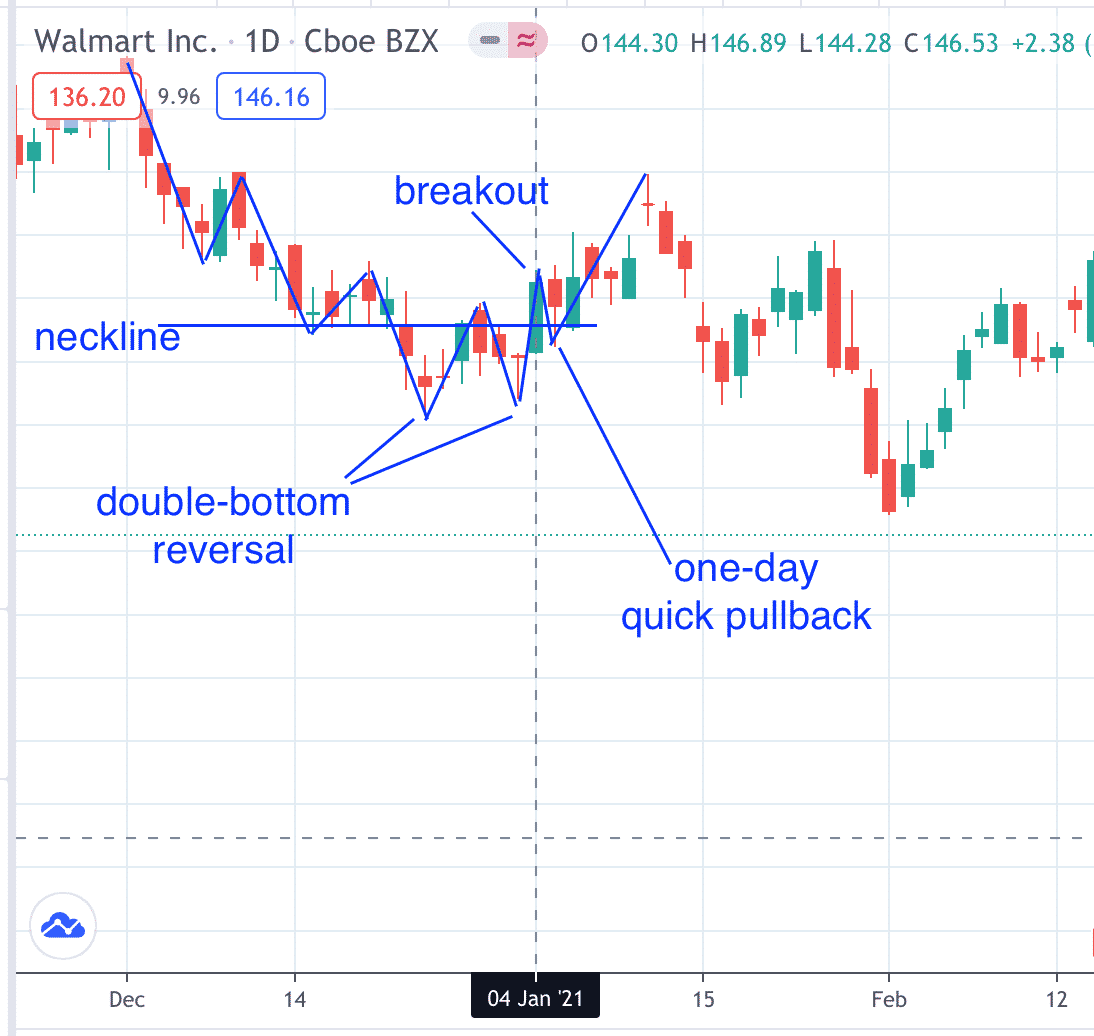
On December 31st, WMT put in a hammer candle with a low nearly at the previous swing low — a potential double bottom.
On January 4th, 2021, stock rallies breaking above the neckline of the double bottom.
The investor goes long on the close.
The stock went up for a little bit but then falters and comes back down.
Depending on how the investor trades this, it might or might not have worked out.
Alignment in Multiple Timeframes
There is a multitude of strategies that can be hashed out for multiple timeframe trading.
The thing that they have in common is the alignment of multiple timeframes.
The trade is initiated when a bullish signal occurs in the higher timeframe, and then another bullish signal occurs in the lower timeframe.
The two technical signals can be of various sorts.
In the following weekly chart, United Health (UNH) broke out of a double top resistance on the week of March 22nd, 2021.
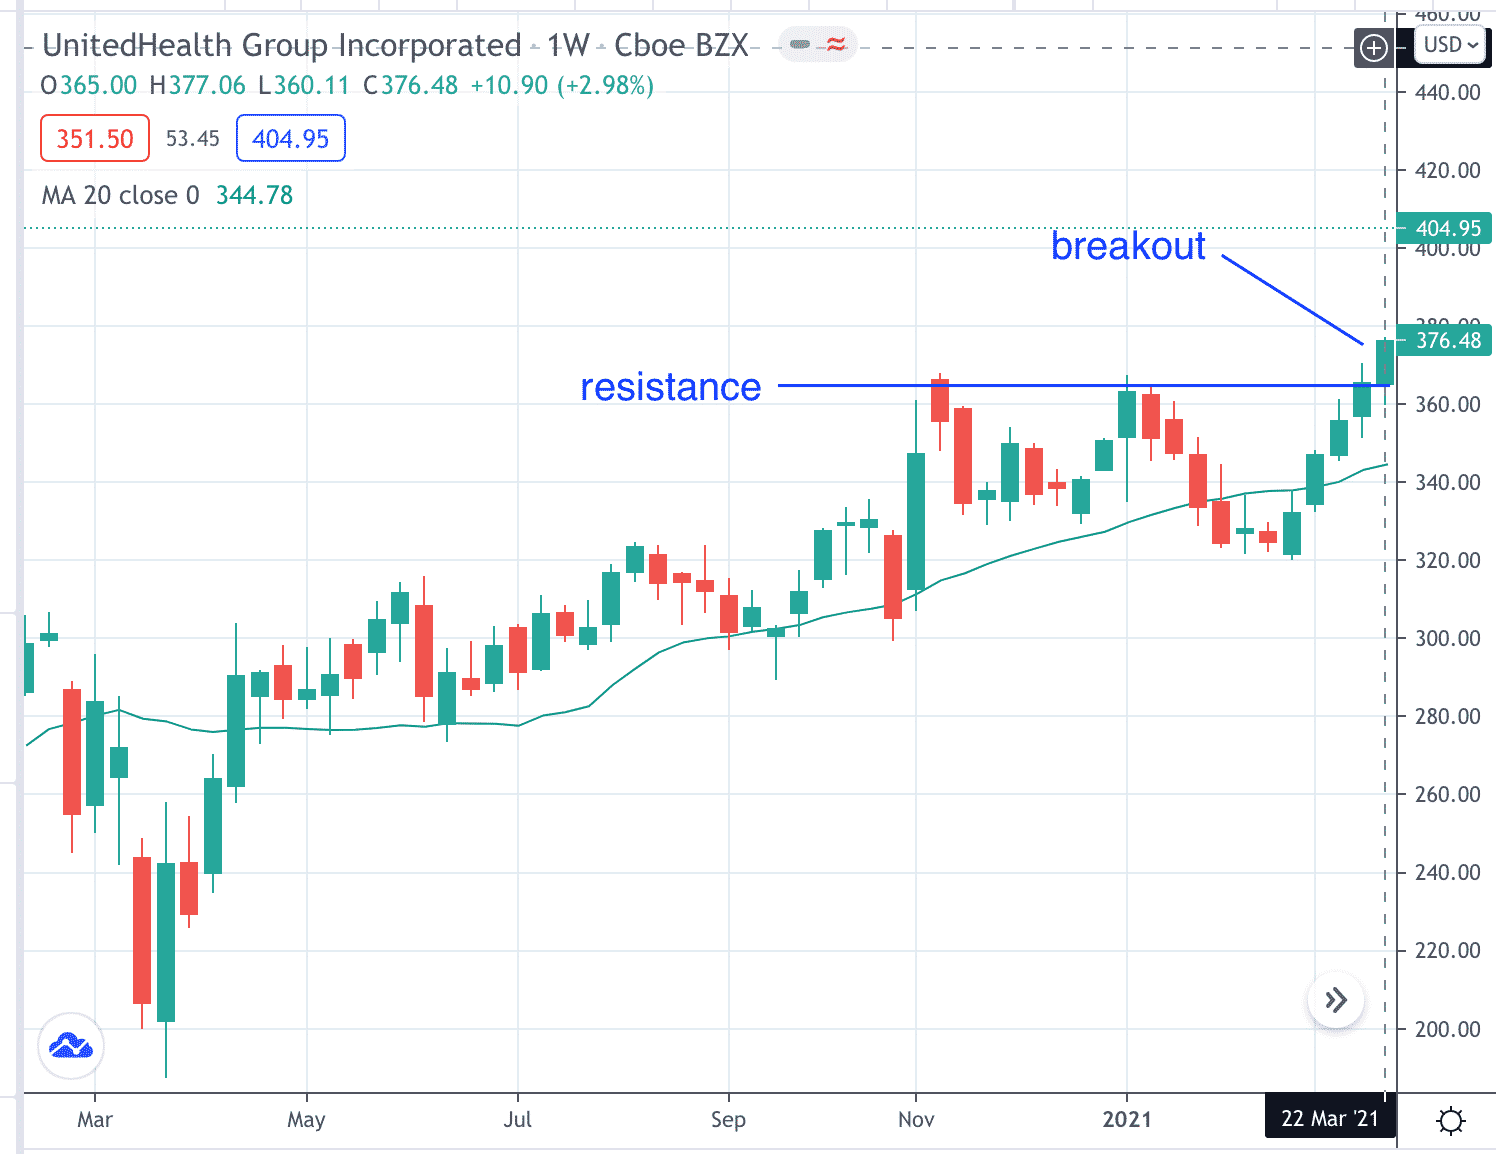
On Monday, March 29th, after the breakout on the weekly chart, the investor looks on the daily chart for a technical signal to initiate a bullish trade.
On April 7th, UNH puts in a hammer candle after coming back down to value to touch the 20-day moving average.
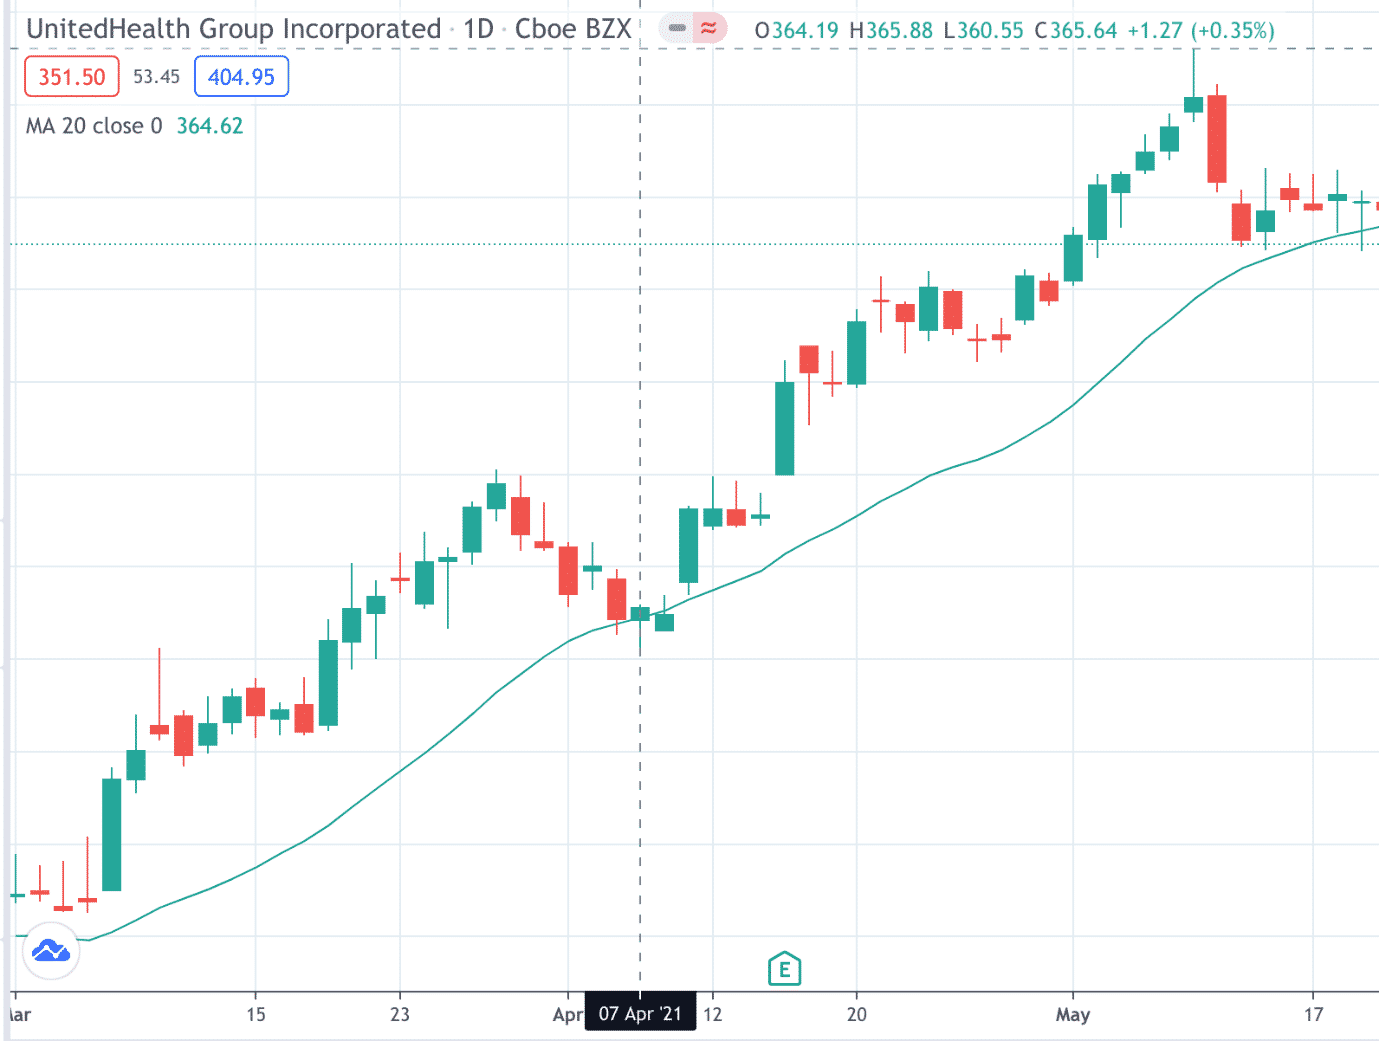
The next day April 8th, UNH trades above the high of that candle, and the investor goes long with a stop one ATR below the low of the hammer candle.
The price then went up and away.
Bearish Example
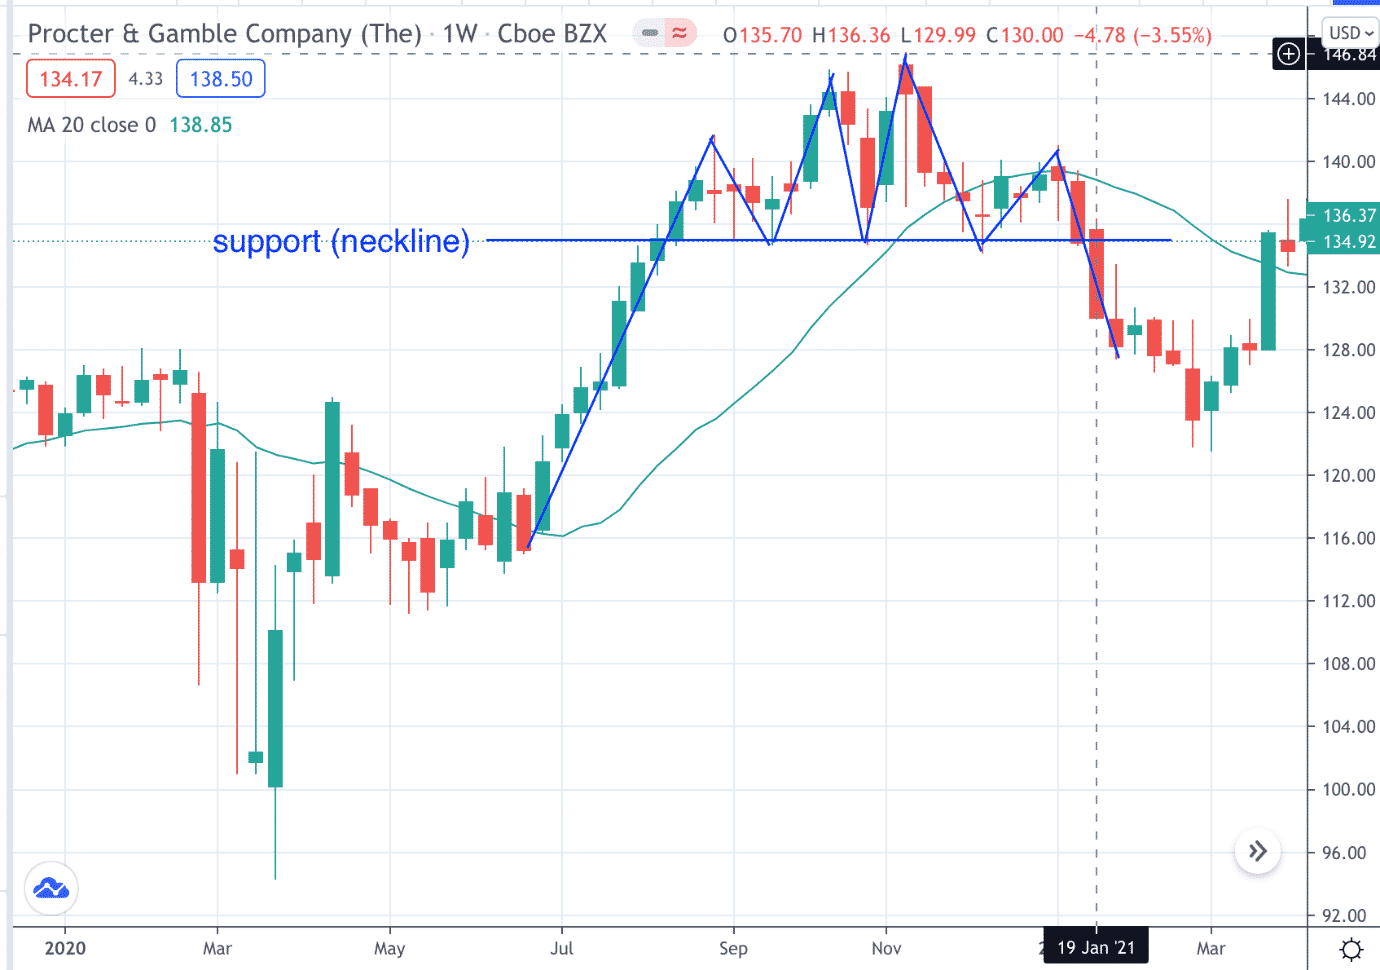
Now we will look at a bearish example with bearish technicals on both the weekly and daily charts of Proctor and Gamble (PG).
On the weekly chart, PG broke the neckline support of a head and shoulders pattern on the week of January 19th, 2021.
On the daily chart on January 27th, PG breaks below the last swing low.
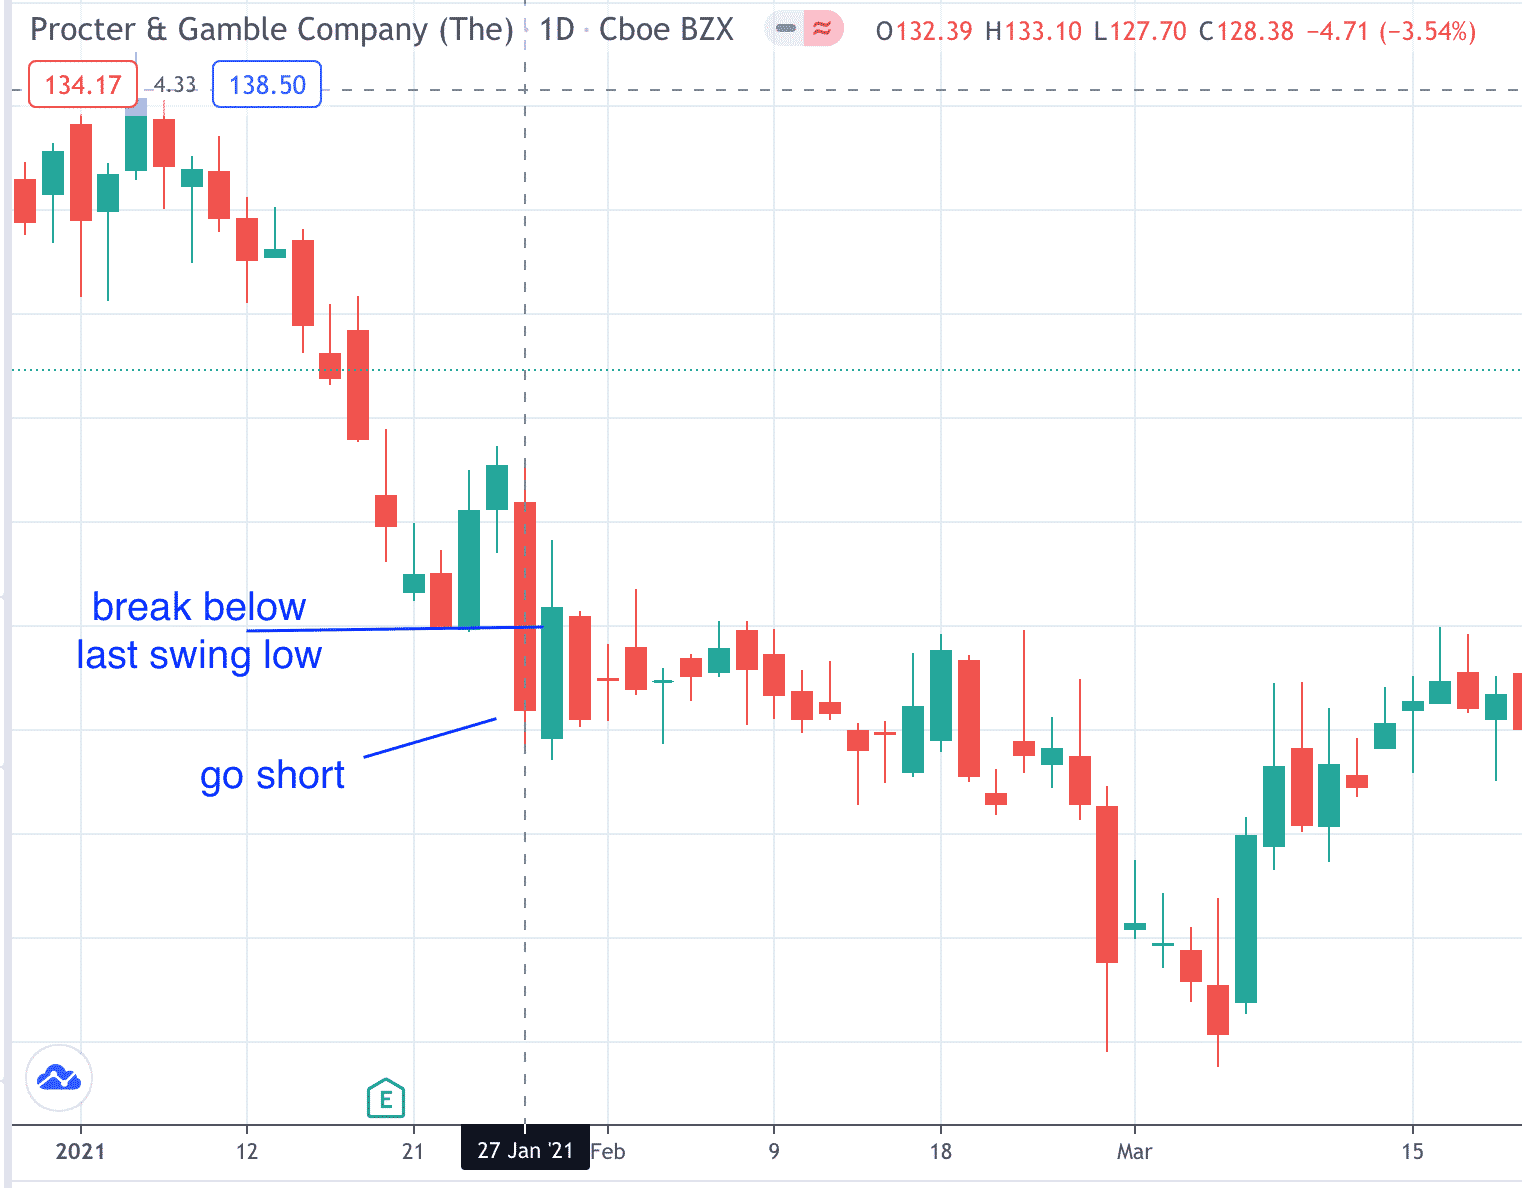
With bearish technicals on both the weekly and daily charts, the investor goes short at the market close.
And prices keep going down until March 4th.
What’s Next
Now that you know how to trade the weekly and daily charts in conjunction, discretionary traders can use their discretion and decide what technical patterns to look for in each timeframe.
Systematic traders would prefer to have more defined systemic rules.
In the next article, we will give systematic traders a strategy that uses the weekly and daily timeframes.
We’ll give you all the well-defined rules as well as backtested results. So, stay tuned.
Trade safe!
Disclaimer: The information above is for educational purposes only and should not be treated as investment advice. The strategy presented would not be suitable for investors who are not familiar with exchange traded options. Any readers interested in this strategy should do their own research and seek advice from a licensed financial adviser.


