


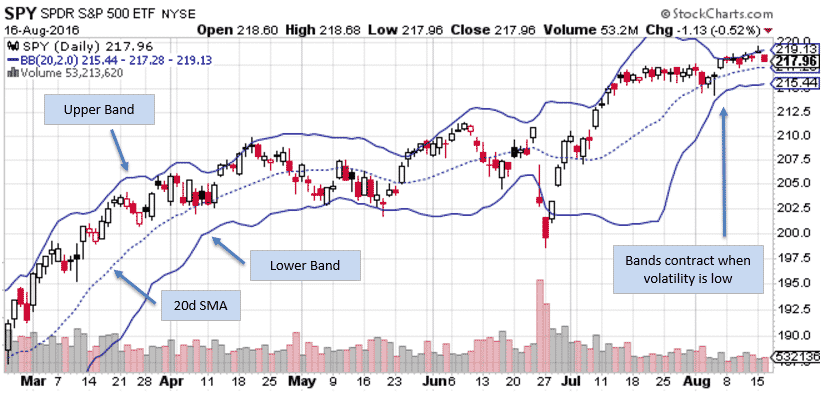
Bollinger Bands® are a favourite trading indicator among professional traders. Bollinger Bands were developed and made famous by legendary technical trader John Bollinger and are plotted 2 standard deviations away from a simple moving average. The usual moving average used is the 20 day.
When market volatility increases, Bollinger Bands will widen and move further away from the average. Conversely, when volatility contracts, the Bands will move closer together.
Combining Bollinger Bands with a Bollinger Band width indicator can be an awesome early indicator of whether a stock is likely to increase or decrease in volatility going forward.
In this article, you’re going to learn how to spot high probability set ups using Bollinger Bands including some real life examples.
Bollinger Bands Explained
Bollinger Bands are price channels with the upper band being 2 standard deviations above the middle line and the lower band being 2 standard deviations below from the middle line. The middle line is typically a 20 day moving average.
Traders can alter the standard parameters, for example, Rolf from Tradeciety recommends changing the standard deviation to 2.5 to give more reliable signals.
Having a stock touch one of the outer Bollinger Bands does not signal the end of a trend. In fact, it can sometimes mean the opposite.
Looking at the chart below, you can see a number of times when price touched an outer band, but continued in the same direction for a few more days.
Using Bollinger Bands to Determine Range Expansion or Contraction
My favourite method for using Bollinger Bands is to determine whether a stock is likely to experience a range expansion or contraction in the weeks and months ahead.
We can do this by looking at the past behaviour of the stock and adding an indicator to show the Bollinger bandwidth.
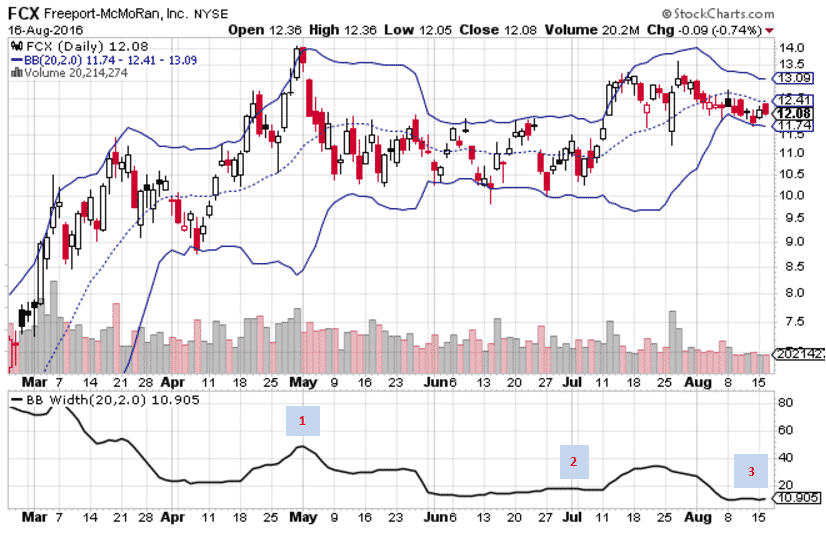
On the FCX chart below we have 3 points of interest:
- At this point, the Bollinger band width is quite wide in comparison to the rest of the range. Generally, after a period of high volatility, a stock will tend to consolidate or go through a period of low volatility. Notice that after this period of expansion, FCX trades sideways for nearly 2 months.
- At point 2, the Bollinger Bands are very narrow and have been for some time. This can indicate a breakout is imminent. That turned out to be correct with FCX moving from $10.60 $13.00 in 3 trading days. That’s a move of 22.6% in 3 days! See below for a trade I placed during this time.
- Again we see very narrow Bollinger Bands. Potentially FCX is going to experience another breakout in the next few weeks.
Trade Examples Using Bollinger Bands
Recently I made a trade in FCX using Bollinger Bands and the principal of range expansion coming after a consolidation.
Looking at the previous chart, at Point 2, I decided to enter a Long Strangle with the assumption that FCX would likely break out of the 2 month range it had been stuck in.
Trade Date: July 7th, 2016
Bought FCX Jan 20th 2017 $10 Put and $12 Call Strangle for $3.12
I like to go out 6 months for Long Strangles and set a time exit of two months. So if the trade is not working after 2 months, I get out with minimal time decay.
By July 12th the trade was looking very nice with FCX having moved from $10.60 to $13.00.
I closed the trade on July 20th when FCX was trading around $12.20.
Trade Date: July 20th, 2016
Sold FCX Jan 20th 2017 $10 Put and $12 Call Strangle for $3.55
Profit: 13.78%
The next trade example is using Bollinger Bands to predict when a stock might consolidate.
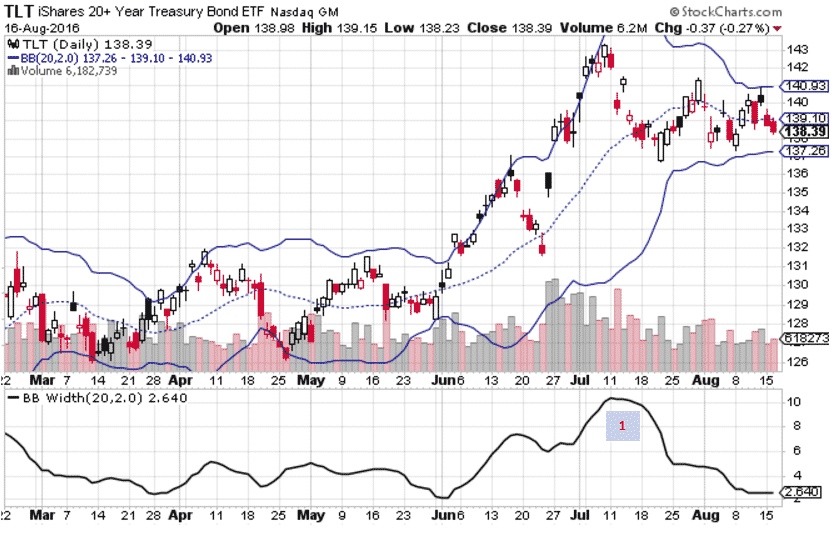
From early June to early July, TLT moved from 129 to 143, a move of 10.85% which is pretty big for a bond ETF.
During that time, the Bollinger Band width expanded massively from 3 to around 10.
Once TLT pulled back to the middle of the bands I figured it was due for a period of consolidation so this time I entered a Short Strangle.
Trade Date: July 20th, 2016
Sold TLT Aug 19th 2016 $131 Put and $148 Call Strangle for $0.48
I kept the trade to only 1-month duration in order to make the most of time decay. Implied volatility on TLT was in the high area of the 12-month range.
Due to the high volatility I was able to place the strikes well above and below the price of $139.
A month later, as we head into expiry, TLT is still trading around $139 and the Short Strangle will expire worthless.
You can see that Bollinger Bands can be a great indicator to add in to your trading arsenal. Combining the Bollinger bandwidth and an analysis of implied volatility can make a great foundation when looking to trade breakouts or consolidations.


There is an indicator on the TOS application that will identify periods of volatility expansion and contraction for those who desire an aid in determining high/low volatility levels. The indicator is TTM_Squeeze which is a John Carter study. The indicator includes a momentum overlay along with an indication of low volatility. The indicator compares the width of the Bollinger Bands to the width of Keltner Channels as a reference and signals low volatility with a change in indicator color.
I have found bollinger bands to be the best indicator for taking entries and exits, in tandem with a few other basic indicators for confirmation. They’re simply incredible and help me keep trading as simple as possible, always one of main goals.
Appreciate the article…!
Awesome Jim, how to you use them exactly? Sounds like maybe you use them more for long and short entries? I tend to look at the width more and determine whether the market is ready to consolidate or break out.