


Today, we are looking at the dragonfly doji pattern.
Various technical price patterns include doji, spinning tops, hammers and engulfing candles.
Each such pattern tells a lot about the asset’s price behavior and helps predict its future movement.
Contents
- What Is The Dragonfly Doji Pattern?
- How A Dragonfly Doji Pattern Forms
- What Does A Dragonfly Doji Tell Us?
- Examples Of Dragonfly Doji
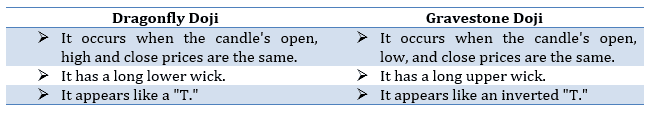
- Difference Between Dragonfly Doji And Gravestone Doji Patterns
- How To Trade The Dragonfly Doji Pattern
- Conclusion
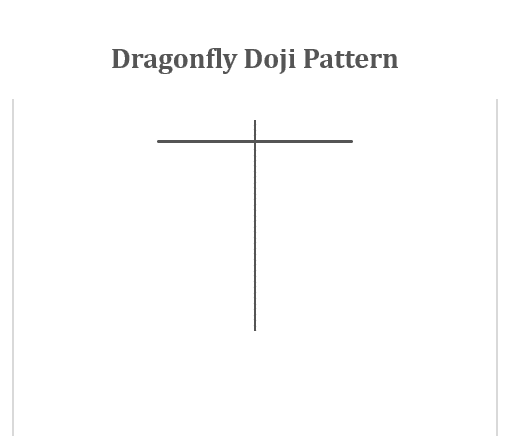
What Is The Dragonfly Doji Pattern?
The dragonfly doji pattern is a technical price pattern where the open, high, and close prices are the same.
It signals a possible reversal on the downside or upside based on the price’s past action.
The long lower wick in the pattern suggests that first, there was aggressive selling during the beginning period of the candle.
However, the buyers successfully absorbed the selling pressure and moved the price up to close it near its opening price.
How A Dragonfly Doji Pattern Forms
A dragonfly doji forms when the open, close, and high prices are the same.
The pattern has a long lower wick suggesting that the buyers absorbed the initial selling pressure.
Thus, the price managed to close near its opening price.
What Does A Dragonfly Doji Tell Us?
The dragonfly doji pattern does not occur regularly.
However, whenever it occurs, it serves as a warning sign for the change in price direction.
For example, the formation of the pattern in a preceding downtrend may signal a possible forthcoming price rise.
Similarly, its formation in a preceding uptrend signals increasing selling pressure, which may lead to a price decline.
The candle following the pattern needs to confirm the price reversal.
The pattern formation in an uptrend shows the increasing selling pressure.
The buyers absorbed the selling pressure and managed to close the price near its opening price.
However, the aggressive selling pressure is a warning signal that a price reversal could be on the cards.
The following candle must confirm the bearish reversal by closing below the dragonfly doji candle.
The price reversal gets invalid if the price continues to rise upside in the following candle.
The pattern formation in a downtrend indicates that the sellers during the start managed to push the price down.
Finally, however, the buyers emerged and absorbed the selling pressure pushing the price upwards to close near the open.
Therefore, the emerging buyers in the downtrend could signal upside price reversal.
The following candle confirms the price reversal if the price closes above the dragonfly doji candle.
The reliability of the price reversal depends upon the rally on the following day.
Examples Of Dragonfly Doji
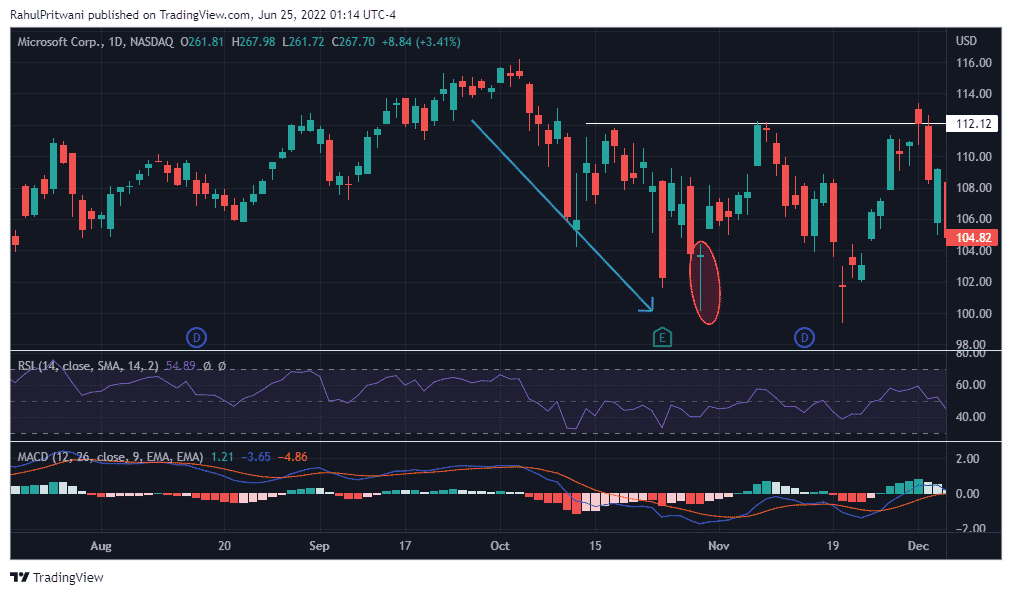
The chart below shows Microsoft Corporation (MSFT) ‘s price on a daily timeframe.
A dragonfly doji pattern formation can be seen on October 30th, 2018.
The pattern formation in a downtrend signaled possible upside reversal, and the price reversed to touch its next swing high of $112.
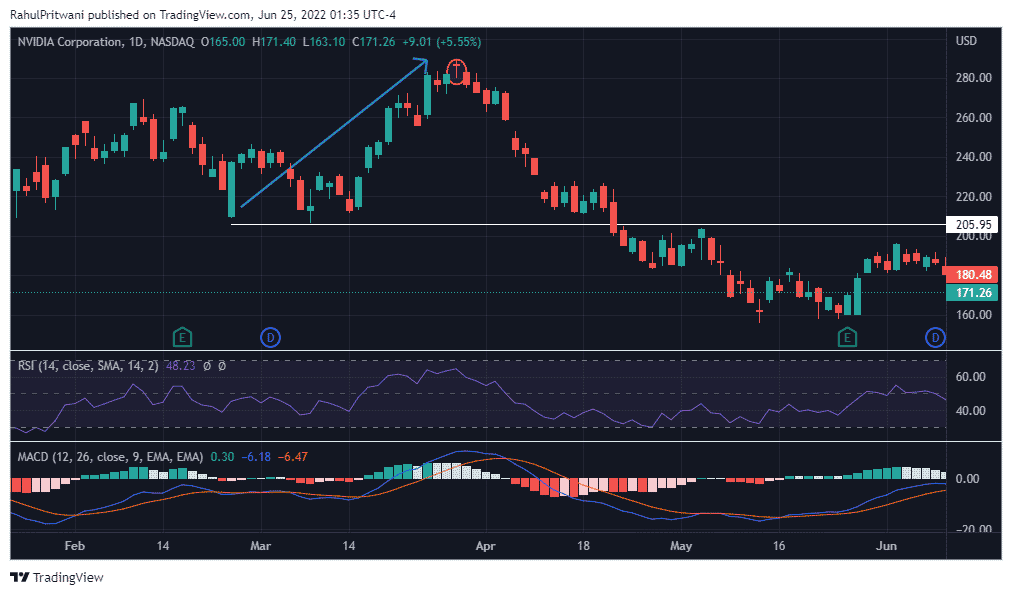
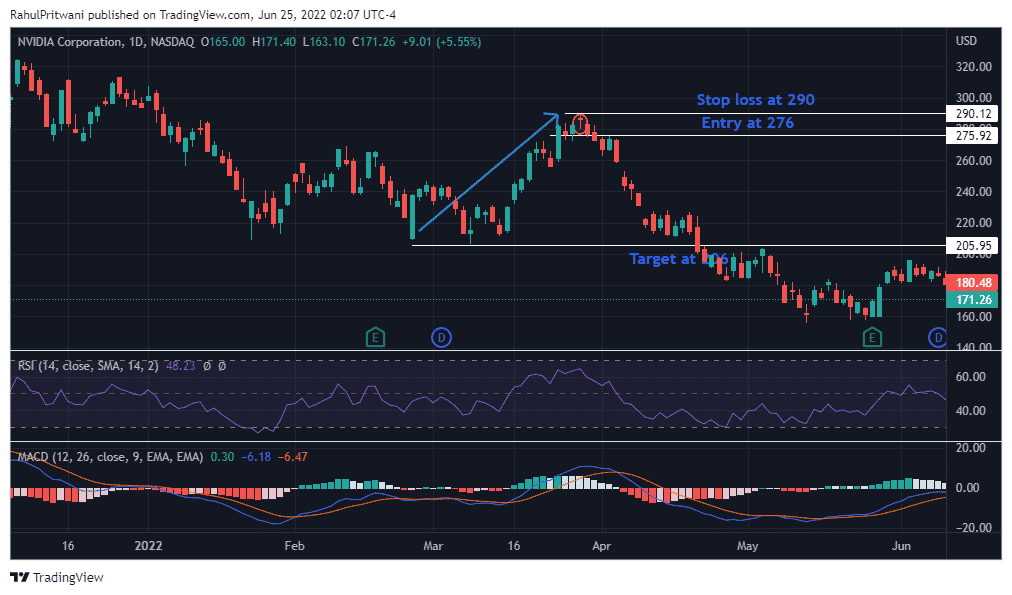
The chart below shows Nvidia Corporation (NVDA)’s price on a daily timeframe.
A dragonfly doji pattern formation can be seen on March 29th, 2022.
The pattern formation in an uptrend signaled possible downside reversal, and the price reversed to touch its next swing low of $206.
Difference Between Dragonfly Doji And Gravestone Doji Patterns
How To Trade The Dragonfly Doji Pattern
Dragonfly doji in an uptrend indicates a possible downside reversal, and in a downtrend, it indicates a possible upside reversal.
Traders can trade the pattern for bearish reversal by initiating short trade during the following confirmation candle or even after its close.
The stop loss for the short trade can be placed at the high of the candle.
Let’s see how to trade the pattern in an uptrend.
A dragonfly doji pattern formation can be seen in the NVDA’s day chart on March 29th,2022.
An uptrend precedes the dragonfly doji pattern, and such pattern formation indicates a possible downside reversal.
First, the following candle needs to confirm by closing below the pattern’s closing price.
The following bearish candle closes below the pattern in the chart, confirming the bearish reversal.
Thus, traders can initiate a short position during or at the close of the confirmation candle at $276.
The stop loss can be the high of the pattern at $290, and the target can be the next swing low at $206.
The price fell and reached the target within a month.
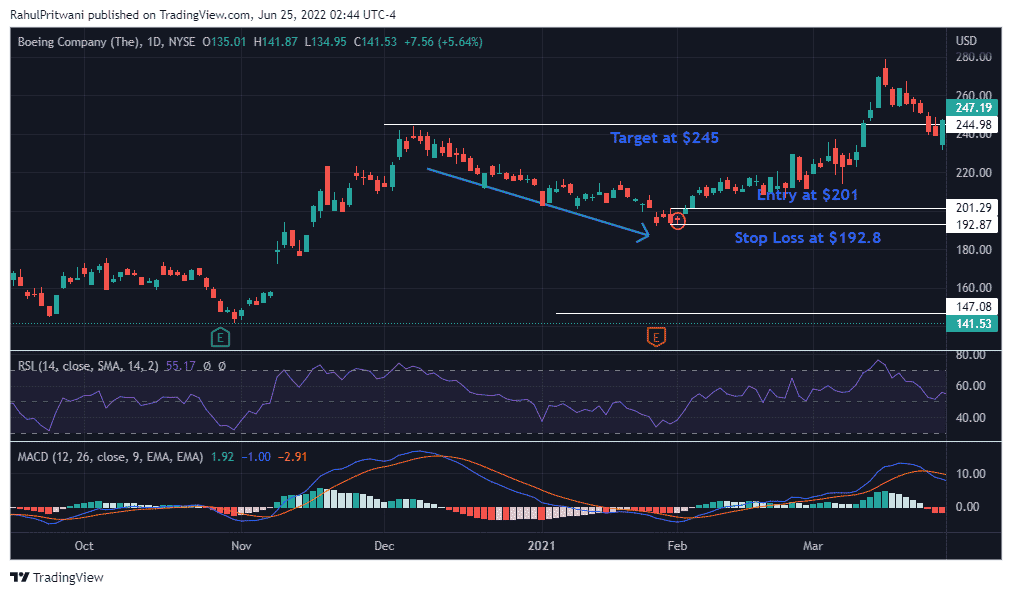
Similarly, the formation of the pattern in a downtrend can be traded for a potential upside reversal.
For example, the Boeing Company (BA) daily timeframe chart below shows the dragonfly doji formation on February 1st,2021.
A downtrend precedes the pattern, and thus, it indicates a possible upside reversal.
The next candle confirms the bullish reversal by closing above the pattern’s closing price.
Traders can initiate a long position during or at the close of the confirmation candle at $201.
The stop loss can be placed below the pattern at $192.8, and the target can be the next swing high at $245.
The price reached the target on March 10th,2021.
Sometimes, the dragonfly doji pattern, combined with the confirmation candle, can put the stop loss too far away from the entry point, which may not favor the risk-reward ratio.
Hence, traders should take trade only when it is justifiable in terms of risk and reward.
Conclusion
Dragonfly doji is one of the reversal patterns that traders can use to initiate a trade in the price reversal direction.
However, the trade should be initiated only after the confirmation candle that follows the pattern, which can give more clarity regarding the price reversal.
Trade safe!
Disclaimer: The information above is for educational purposes only and should not be treated as investment advice. The strategy presented would not be suitable for investors who are not familiar with exchange traded options. Any readers interested in this strategy should do their own research and seek advice from a licensed financial adviser.


