


Today, we’re looking at the piercing pattern candlestick and the bearish engulfing candlestick. Read on and enjoy!
Contents
- Piercing Pattern Candlestick on SPX
- Piercing Line Candlestick on NDX
- Piercing Line Candlesticks On ETFs And Stocks
- Not Piercing Pattern
- Bullish Engulfing
- The Psychology Behind the Pattern
- Should We Trade This Pattern?
- Conclusion
It is quite apropos to talk about these patterns now.
Because as I’m composing this, we just saw the piercing line candlestick pattern happen on the SPX and the NDX indices.
And we saw the bullish engulfing pattern appear on quite a few of the equities as well.
Let’s see how these patterns play out.
Piercing Pattern Candlestick on SPX
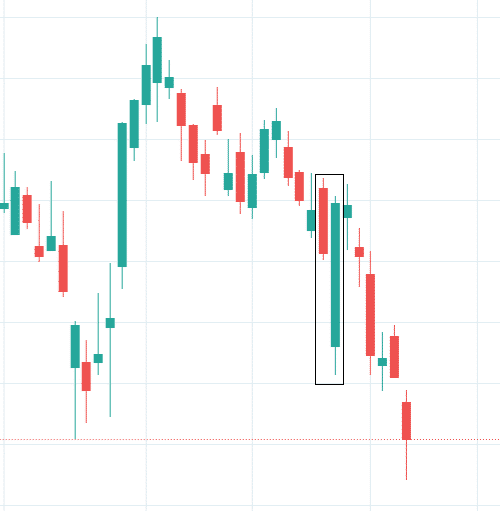
On February 24, 2022, the piercing line pattern formed on the SPX (S&P 500 index).
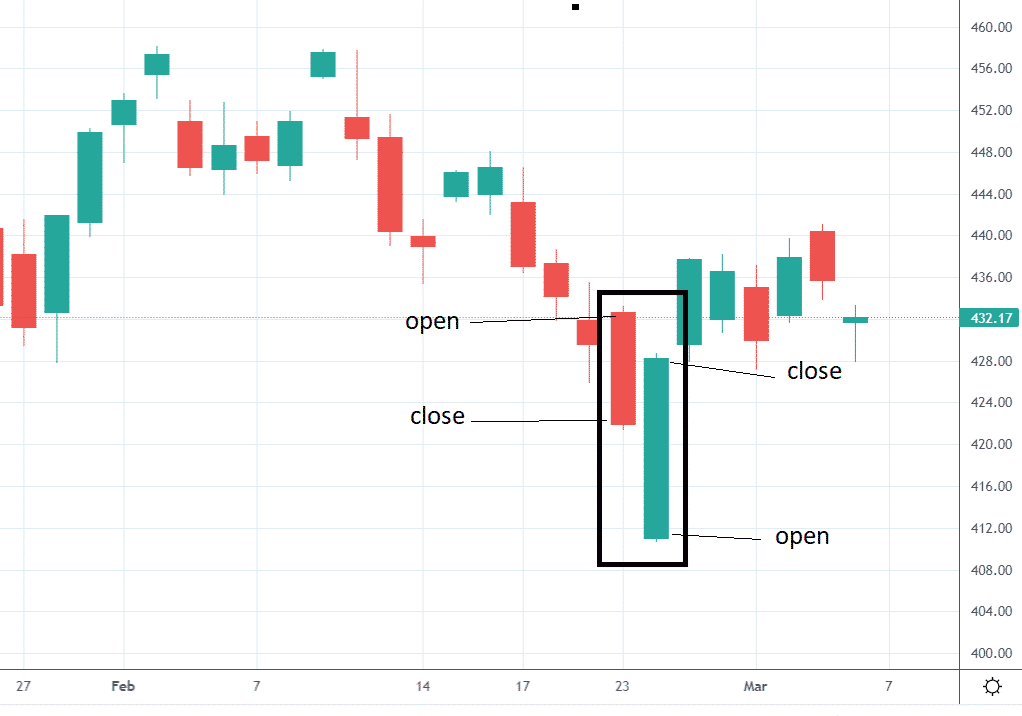
The piercing line pattern is a bullish reversal pattern.
For this pattern to be valid, the price must decrease for one or two candles before this pattern.
The pattern consists of two candles as marked.
The first candle is a down-day candle that continues the downward movement.
The second candle is a bullish up-day candle that reverses up.
The second candle must open lower than the first candle’s close.
In other words, the second candle gaps lower from one day to the next.
During the course of the day on the second candle, the buyer pushes the price higher past the midpoint of the first candle’s body.
This pattern predicts a short-term up movement of price.
Like most candlestick patterns, it can not predict any more than five candles ahead.
In this case, we see that the price did go up slightly within the next five candles.
Piercing Line Candlestick on NDX
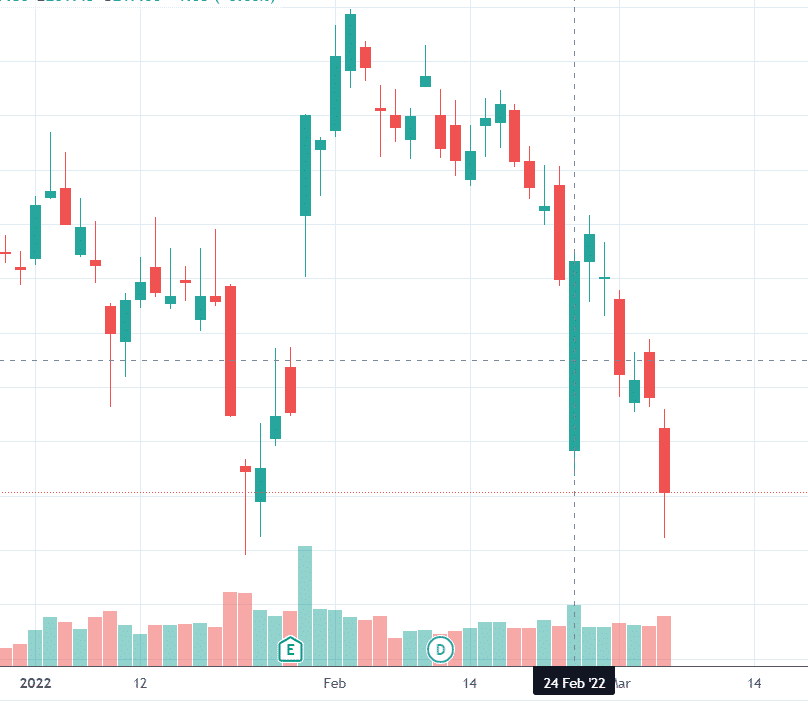
On that same day, we see the same pattern on the NDX (US 100 index)…
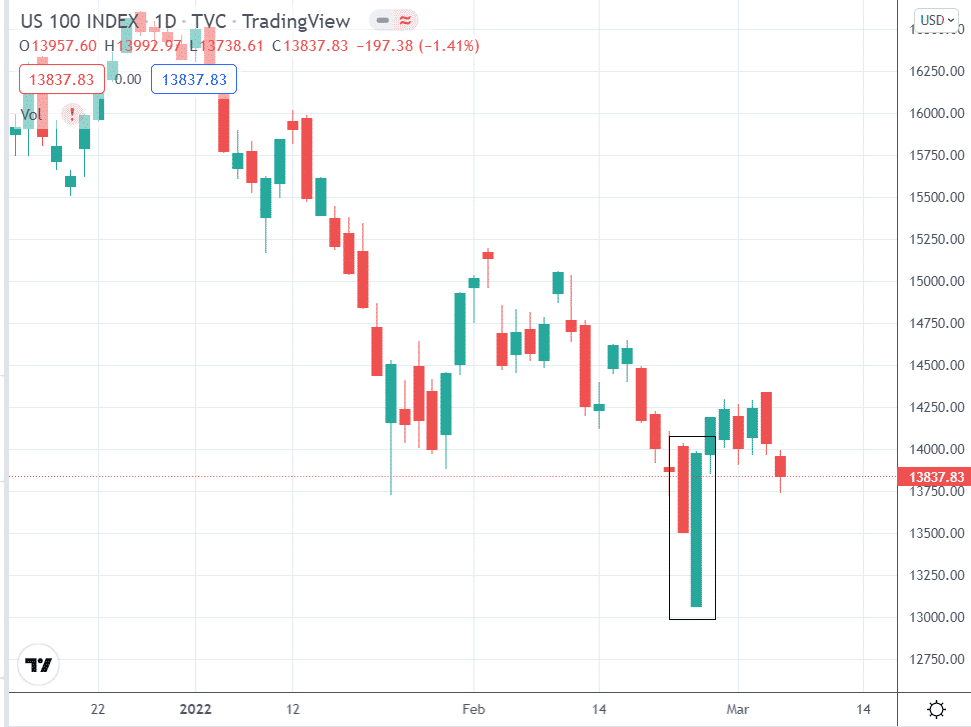
This price action looks even more bullish than the SPX.
Right after the opening of the second candle, the price continues straight up past the mid-body of the first candle and keeps going up until the close.
If the closing bell didn’t ring, it probably would have gone up higher.
There are barely any wicks top or bottom of the candle.
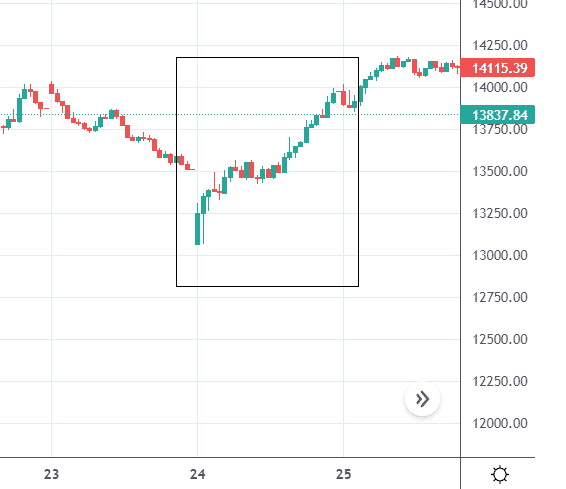
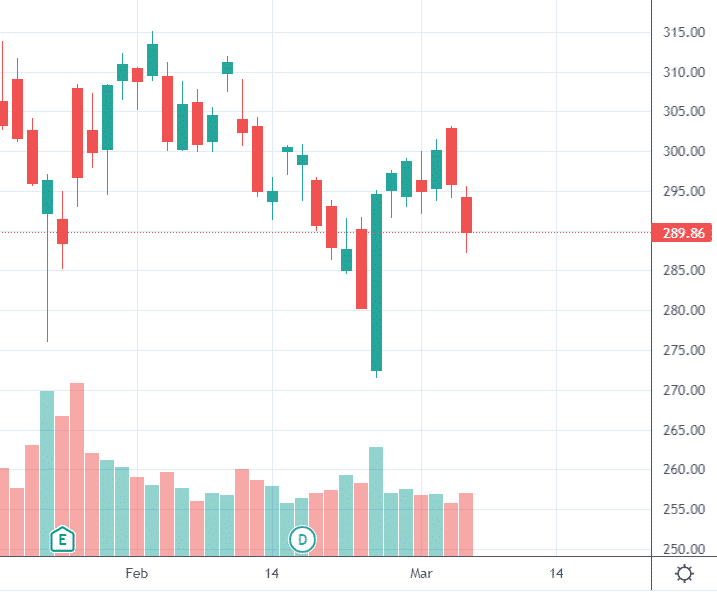
Taking a look at the 15-minute chart confirms this bullish price action.
Piercing Line Candlesticks On ETFs And Stocks
We see the same pattern on SPY and QQQ since these two ETFs track the SPX and NDX, respectively.
Looking through the major constituents of SPY and QQQ, we can see this reversal pattern on quite many stocks.
Of those showing the piercing pattern, we asked if the close five days later is above the pattern, within the pattern, or below the pattern.
AAPL – above AMZN – within TSLA – above NVDA – within MA – below DIS – within AVGO – within CMCSA – above AMD – within HON – above ADP – above ADI – within LRCX – within
For the most part, the price did stop its downtrend (at least for the short term).
And in some cases, the price reversed up slightly.
For the case of Mastercard (MA), the price continued to fall below the pattern.
This is a failed pattern.
Not Piercing Pattern
The chart on Visa (V) looks very similar to Mastercard (its competitor).
But it is not a failed piercing pattern because it was not a piercing pattern to be with.
While the big green candle looks very bullish, the buyers could not push the price past the midpoint of the previous day’s candle.
The piecing pattern is named as such because buyers take back control from the sellers and can pierce deep into the sellers’ territory.
The definition of “deep” can be subjective.
Many will use 50% or more into the body because it is easy to spot the midpoint of the previous candle visually.
Bullish Engulfing
If the buyers continue past the midpoint and even past the open of the previous day’s candle, we have a bullish engulfing pattern, as we saw with Microsoft (MSFT) on February 24.
The resulting pattern is easy to spot because the second candle’s green body completely contains the first candle’s red body.
A few other equities formed the bullish engulfing pattern as well…
MSFT – above GOOGL – above FB – within COST – above TMO – above ADBE – within CRM – within INTC – above QCOM – within NFLX – within TXN – within TMUS – within INTU – within PYPL – within AMAT – within ISRG – above FISV – above
We asked the same question if the close five days later is above the pattern, below the pattern, or within the bounds of the pattern.
The Psychology Behind the Pattern
Here is the chart of INTC:
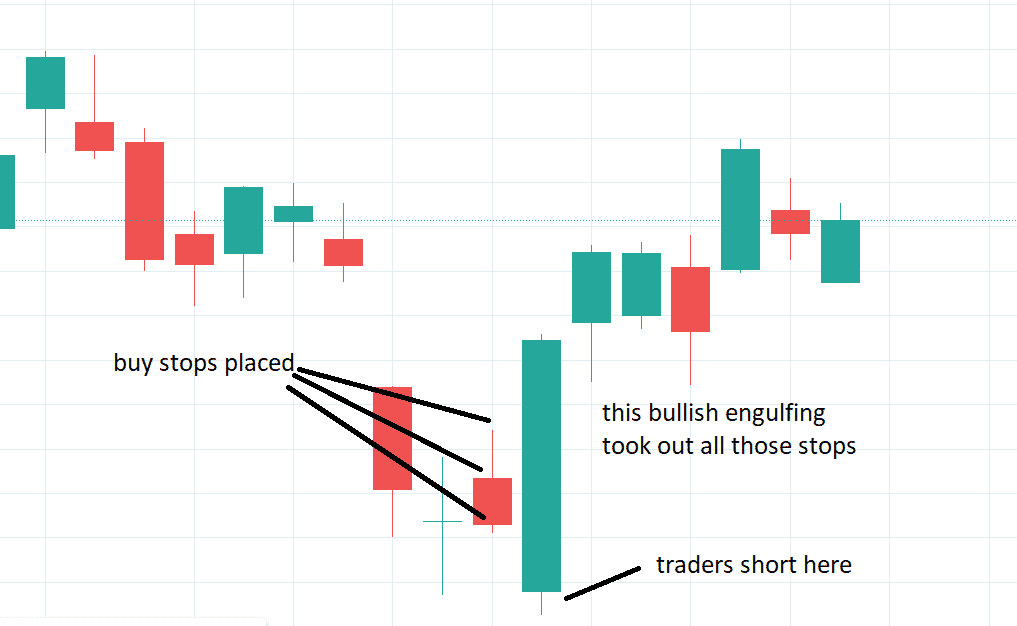
Traders see the price going lower, including the down day seen on the first candle of the pattern.
They are thinking of shorting the stock.
And when it gaps lower the next day, they initiate the short.
Some might put a stop-loss order above the close, above the open, or possibly above the high of the previous day.
A lot of the time, these traders are correct, and the stock keeps going lower.
When that is the case, the piercing line and bullish engulfing pattern do not form.
Sometimes, these traders are wrong, and the price reverses against them.
In the case of the piercing line, the price triggers any stops placed near the previous day’s close.
In the case of the bullish engulfing, price takes out those stops plus any stops placed near the previous day’s open.
And in the case of the bullish engulfing that engulfs the entire previous day’s candle, it takes out even more stops.
When traders are short, and their stops are triggered, this causes them to “buy to cover” their short stock.
This buying activity helps fuel (in a small way) the upward price movement.
Should We Trade This Pattern?
The observations suggest that the piercing line and the bullish engulfing have a slight tendency to pause the existing downward movement of price temporarily.
And in some cases, it may produce a temporary short-term reversal.
One can not draw too strong of a conclusion based on the patterns seen on one day alone. So we look to others who have done more extensive studies.
Tom Bulkowski did some extensive studies and said:
“The theoretical performance of the piercing pattern candlestick is as a bullish reversal and testing found that it acts that way 64% of the time. That is quite good. Better yet, the overall performance ranks 13th out of 103 candles.” source: ThePatternSite.com
For the bullish engulfing, he writes:
“The bullish engulfing candlestick acts as a bullish reversal 63% of the time, which is respectable, ranking 22 where one is best out of 103 candle patterns.” source: ThePatternSite.com
On that same page, he suggests…
“Trade bullish engulfing candlesticks when the primary trend is upward. Look for a downward retrace in a rising price trend for the best chance of success.”
We would agree that it is better to trade in the direction of the primary trend.
If we are going to trade reversals, we should trade reversals back into the direction of the primary trend.
On SPY on the daily timeframe, the primary trend is down — as noted by the lower lows and lower highs.
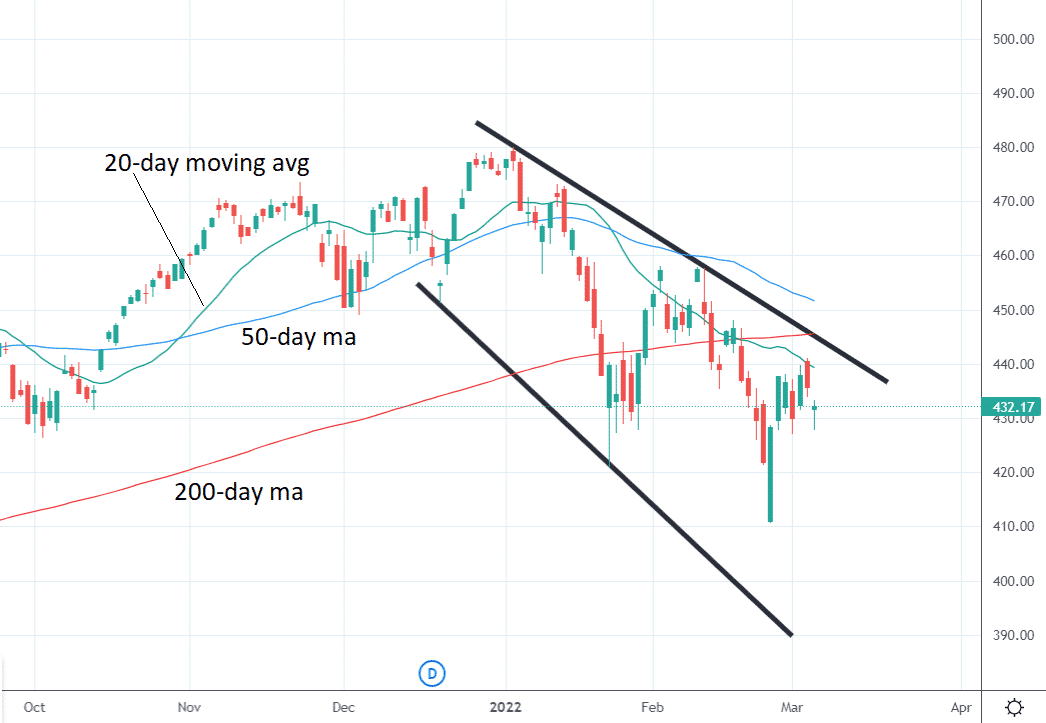
Price is below a downward sloping 20-day moving average.
The 20-day moving average is below the 50-day moving average.
Price is below the 200-day moving average, which is considered bearish.
And if you are using RSI as a trend indicator, its value is below 50.
We would much rather trade the following piercing line pattern seen on the SPY on March 25, 2021.
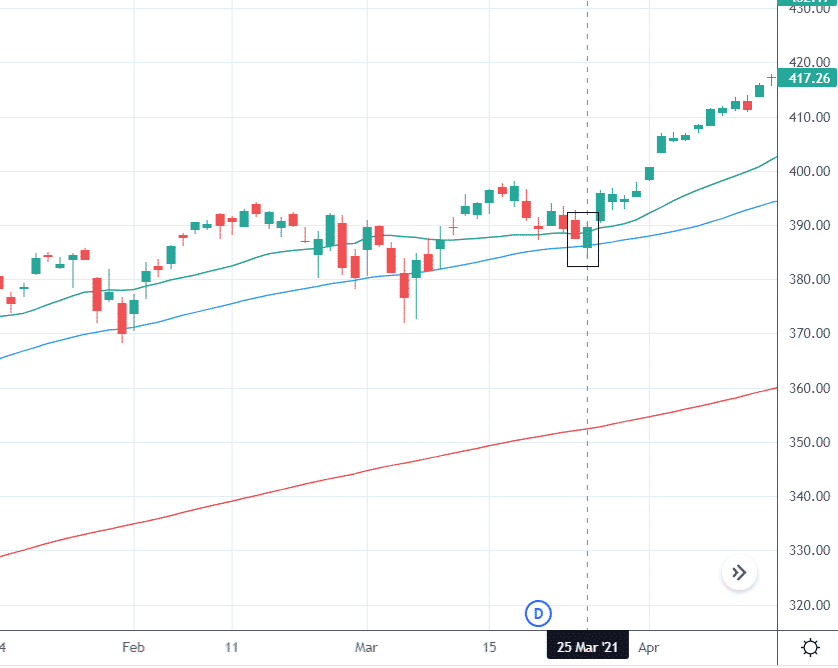
See the difference?
Here, the primary trend is up.
Price is making a pullback, with price going lower when the bullish piercing pattern appeared.
Traders who took that as a sign that the pullback is over would go long, hopping back onto the bullish uptrend.
And they would have been successful.
Conclusion
We focus on the bullish piercing line and the bullish engulfing patterns because the market has an upward bias.
We do not pay much attention to the bearish versions of these patterns.
Candlestick patterns should not be used in isolation.
You cannot just take every piercing line and bullish engulfing you see.
Look for the bigger context, and when stacked with other confluence of factors such as other technicals or fundamentals, the edge might become large enough to initiate trades.
Trade safe!
Disclaimer: The information above is for educational purposes only and should not be treated as investment advice. The strategy presented would not be suitable for investors who are not familiar with exchange traded options. Any readers interested in this strategy should do their own research and seek advice from a licensed financial adviser.


