


Today we’ll talk about what is a rounding top pattern; a chart pattern used in technical analysis.
Many reversal patterns give an early indication of the reversal of the trend.
Though such patterns cannot be infallible, they make the traders prepare for any possible trend reversal.
One such reversal pattern is rounding top formation.
So, let’s proceed to dig deep into it.
Contents
- What Is A Rounding Top Pattern?
- Identifying The Rounding Top Pattern
- Understanding The Rounding Top Pattern
- How To Trade The Rounding Top Pattern
- Conclusion
What Is A Rounding Top Pattern?
A rounding top pattern is a price pattern which forms a downtrend sloping curve when graphed.
It is also referred to as “inverse saucer” as it looks similar to an inverted “U” shape.
Rounding tops are usually formed at the end of the extended uptrend, indicating early signs of a possible reversal.
The formation of such a pattern may take weeks, months, or even years.
The longer it takes for such a pattern formation, the longer the forecasted trend change.
Identifying The Rounding Top Pattern
Rounding top formation has got specific characteristics such as:-
- An uptrend precedes the formation of a rounding top pattern.
- A rounding top is formed when the price stabilizes for a long duration.
- Neckline support is noticed with the rounding top, which is expected to be broken for a trend change.
Understanding The Rounding Top Pattern
Identifying the rounding top pattern becomes vital to anticipate the trend change in price from trending upward to downward.
It often occurs with a double top or triple top pattern.
Early identification of such rounding top patterns helps traders exit their long positions or even prepare for going short.
The price seems to be on an uptrend, and gradually when it extends higher, it tapers off and tends to trend lower.
Then, finally, the price stabilizes, and a rounding top pattern is noticed, with the price finding its support near the neckline.
Besides that, an inverted volume pattern is noticed, where the volume is high on either side and low in the middle of the rounding top pattern.
The volume is initially higher as the prices increase.
Then, with the price stabilization, the price of the security increased to a new high but with reduced volume.
As a result, it faces resistance and steadily decreases.
Thus, it leads to the formation of a rounding top with an inverted “U” shape.
As the price enters the sell-off phase, it makes a new high with a low volume and no subsequent follow-up.
Therefore, it usually indicates that the investors have become cautious of entering into fresh long positions.
It is expected that the existing investors will be exiting their long positions, and even fresh shorts will be created once the price breaks the neckline support.
How To Trade The Rounding Top Pattern
The formation of a rounding top pattern indicates the weakening intention of the investors in holding the stock.
Therefore, it is expected that there will be a sell-off once the price breaks the crucial neckline support.
However, no pattern in markets is infallible, and the same goes for rounding top pattern.
Sometimes, it may also happen that the price takes support near the neckline and bounces back to form a new high.
Since the rounding top pattern is a reversal pattern in an uptrend, it provides a shorting opportunity once the price breaks the neckline support.
A short entry can be made once the price closes below the neckline support.
Usually, the target is the price length between the peak high of rounding top and neckline support.
The chart below is of Tesla, Inc. (TSLA) on a 3-hr timeframe.
It can be seen that the stock was in an uptrend before the rounding top formation.
The price stabilizes after forming a high of $885 on January 8th’2021.
After that, the price oscillates over a month between the neckline support of $774 and the peak high of $900.
Thus, a rounding top is formed during the process.
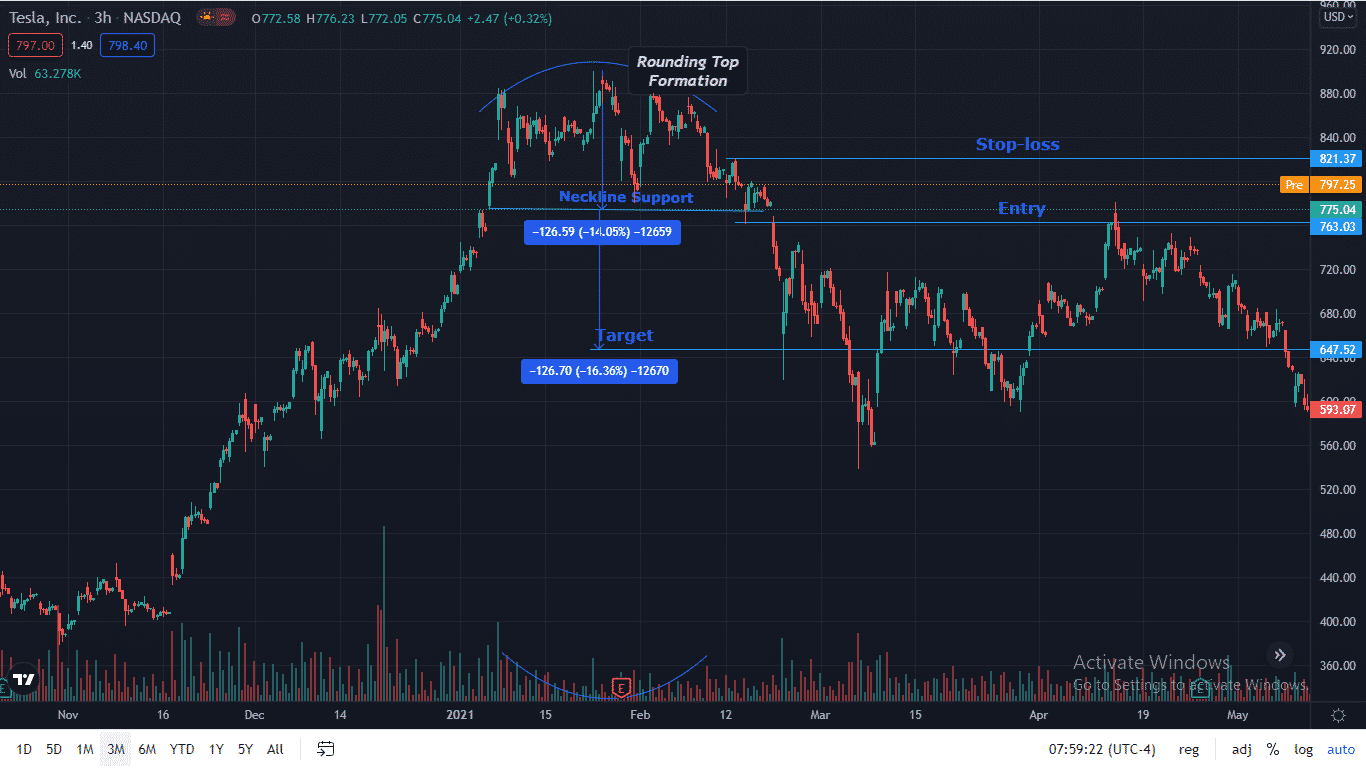
One can go short on a stock when the price breaks the neckline support on February 22nd’2021.
The stop-loss can be placed at a swing high of $821.
The minimum target can be price length between the peak high and neckline support, i.e., $126($900-$774).
Thus, the expected target price is $648($774-$126).
The price made a low of $620 on February 23rd’2021.
It retraced back to only fall again to $540.
Low volumes can be seen in the middle of the rounding top pattern in contrast to high volumes on either end.
Thus, the rounding top pattern must fulfill all its characteristics to provide a genuine trading opportunity, as witnessed in the chart above.
Conclusion
A rounding top pattern is a reversal pattern that gets formed in an uptrend.
Its formation can take days & weeks to months and years.
It prepares the traders to exit their long position or create fresh shorts once the price breaks its neckline support.
Thus, it is one of the best reversal patterns.
Trade safe!
Disclaimer: The information above is for educational purposes only and should not be treated as investment advice. The strategy presented would not be suitable for investors who are not familiar with exchange traded options. Any readers interested in this strategy should do their own research and seek advice from a licensed financial adviser.


