


Today, we are looking at a Parabolic SAR strategy.
Read on to learn all about this powerful strategy and let us know what you think.
Contents
- Multiple Ways to Use the Parabolic SAR
- Example
- PSAR As Trailing Stops
- Exit Signal
- Going Short
- Trend Following
- Secondary Indicator
- As Strike Placement
- Example
- Definition of SAR
Multiple Ways to Use the Parabolic SAR
The Parabolic SAR indicator should not be so easily dismissed as “just another indicator.”
Because J. Welles Wilder Jr created it, the same person who created the RSI and the ATR indicators, which are two very well-known and popularly used indicators.
We will first go over three uses of the Parabolic SAR — known as Parabolic Stop and Reverse or PSAR for short.
- To indicate entry into a trend
- Used for trailing stop loss placement
- Used of strike placement of short options
After learning how to drive the car, we will open the hood to see the magic of how the PSAR dots are calculated.
Example
Here is a Dow Jones ETF (DIA) chart with the Parabolic SAR indicator turned on.
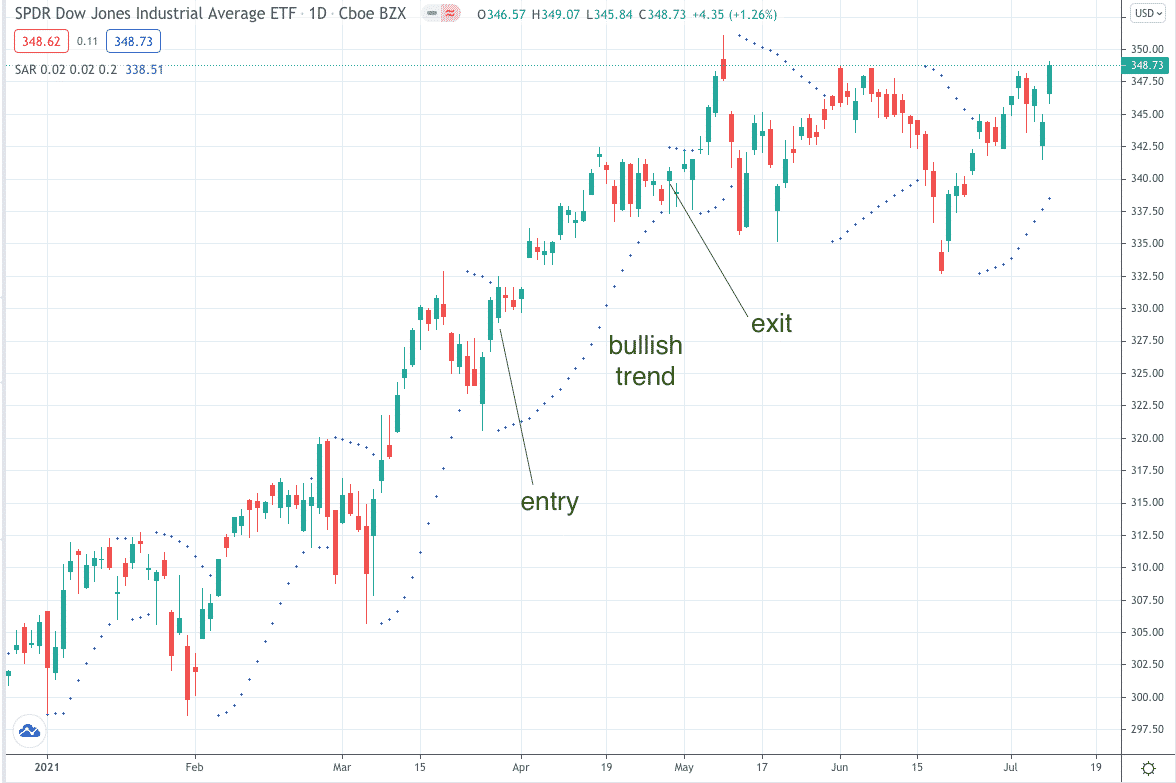
When the dots are below the price, it means bullish.
If an investor decides to trade, it is better to buy the stock than to sell it.
If the investor buys the stock, the dots will indicate where to place the stop loss.
Each subsequent trading day, a new dot is formed.
The stop loss is moved up to that new dot, also known as trailing the stops.
PSAR As Trailing Stops
A few characteristics of the PSAR make it very suitable for use as a trailing stop.
In an uptrend, each dot will move up to chase the price. This raises your stop loss to lock in profits as profits are made.
1. When the price is far away ahead of the dots, it indicates a strong trend. When the dots are getting closer to the price, it means the trend is weakening. The stop loss is tightening as well.
2. The dots will never back up, which enforces the rule that you should never move down your stop loss.
3. The dots are computed as a function of both the movement of price and the passage of time.
4. This results in the dots curving in a parabolic fashion.
Hence the name “Parabolic SAR.”
Exit Signal
At some point, the dots will no longer be under the price but switch to be above the price candles.
When this happens, it is a signal to get out of the long position.
Despite its name, “Stop And Reverse,” it is only recommended to exit the long position — not necessarily to reverse and go short.
Because if you study price action, the market does not “stop and reverse.”
It goes sideways and transitions (which the market is doing most of the time).
An uptrend is usually followed by a range-bound price movement, where you should neither go long nor short.
After that, the price can then reverse, or it can continue in the same up direction. It need not reverse.
Going Short
If and when an investor decides to short the stock, this flipping of the dots from below the price to above the price is a signal to enter the bearish trend.
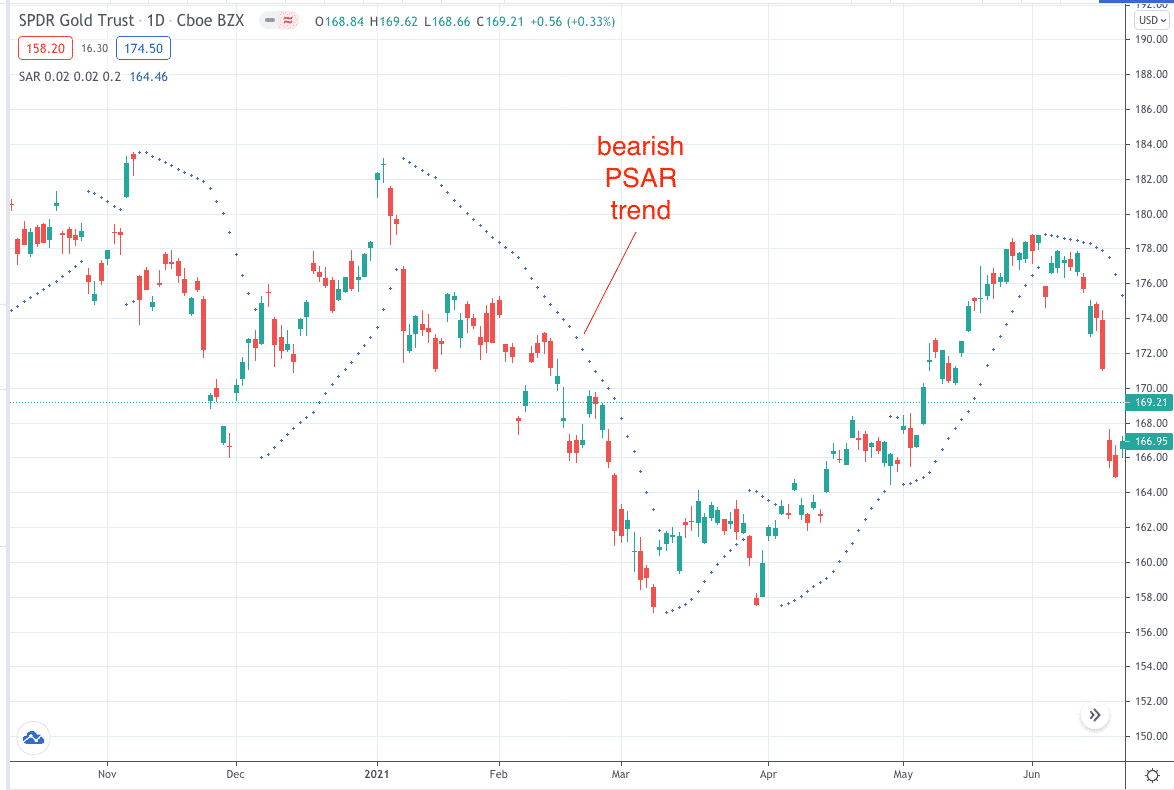
When shorting, use the dots above the candles as the stops.
At some point, the dots will switch again to be below the price candles.
If in a short position, this is when an investor would exit the position.
A bullish investor who sees the dots switching from being above price to going below price will enter a long trade at that time.
It is best to enter a trade at the start of a parabolic SAR trend.
That is to enter only when the dots switch sides.
An investor would not enter in the middle of a parabolic SAR trend.
This is to ride the parabolic SAR trend for as long as possible.
When an investor happens to catch a long trend, this is when profits are made.
In general, long trends tend to make more money than short trends.
Trend Following
The parabolic SAR is a trend following indicator.
It works best in a trending market.
It doesn’t work well in a range-bound market where the dots switch back and forth only after a few trading sessions.
Whip-saw price action can result in losses with this strategy.
In such conditions, it sometimes gives a buy signal even when the price is decreasing.
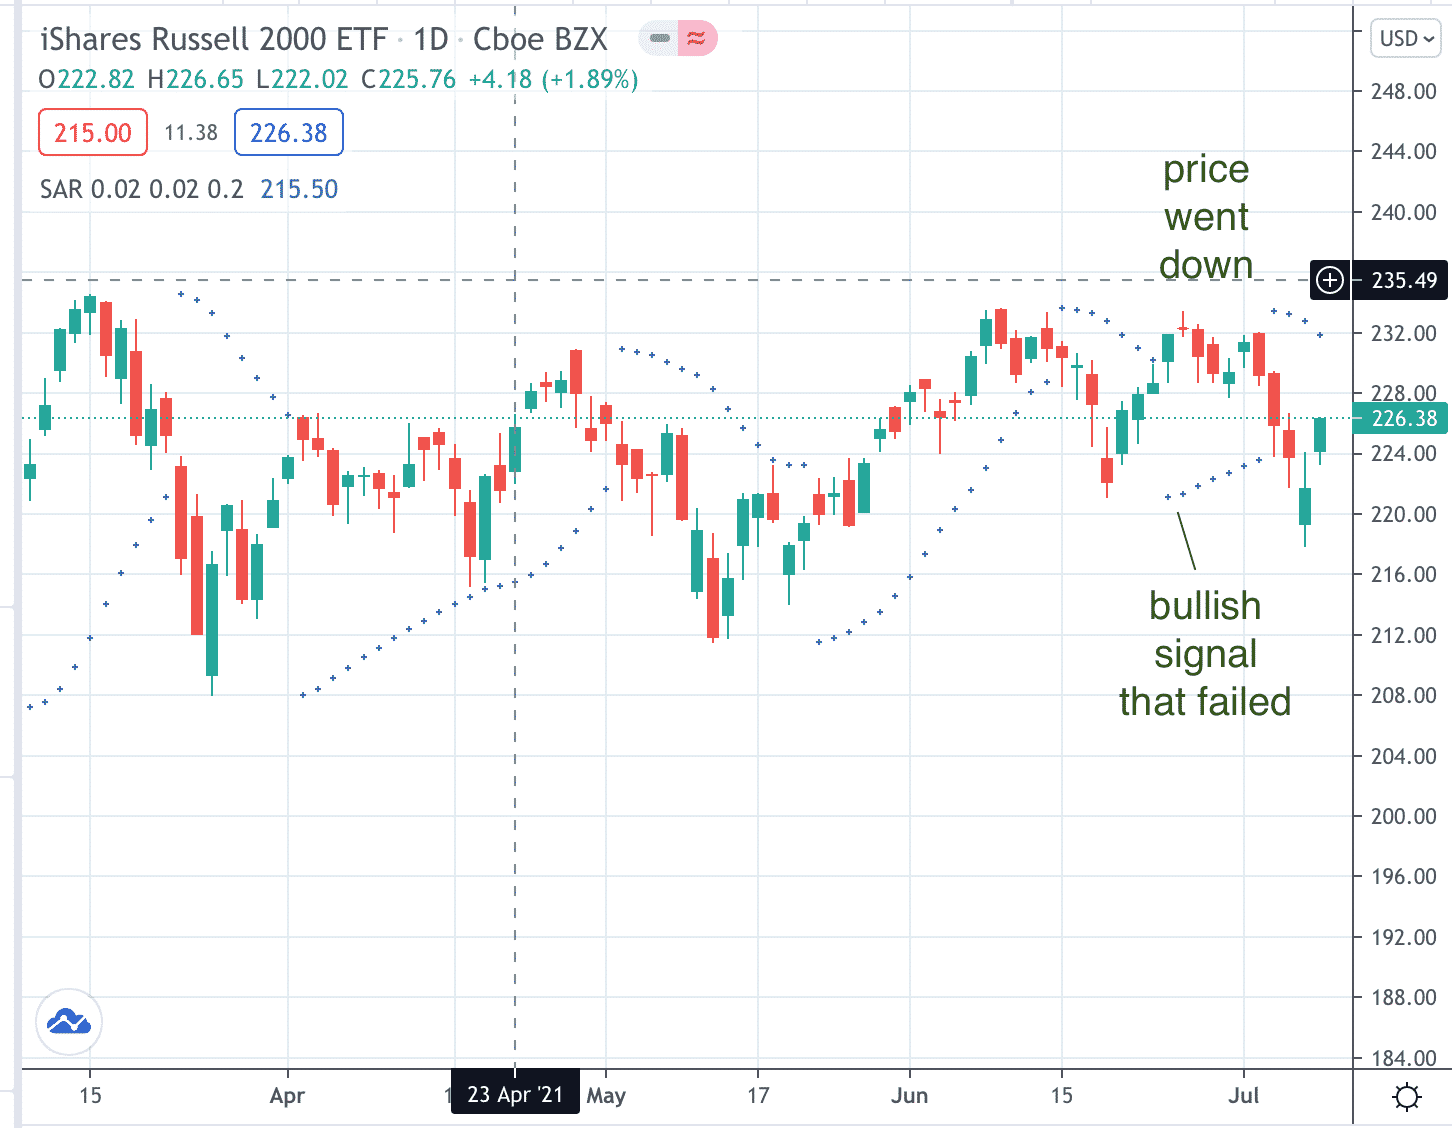
Hence, it is best to utilize the parabolic SAR only when price action is trending.
When the parabolic SAR gives a signal, the investor needs to decide whether to trade that signal or not.
If the investor takes every signal, it is not likely to be profitable because the market is non-trending most of the time.
Secondary Indicator
Since the parabolic SAR only works best in a select small portion of the time when the market is trending, how is an investor to know when to take a trade or not?
While some investors can tell by looking at the price action of the candles, many investors use a second indicator to determine whether to take a signal.
One possibility is to use moving averages.
An example of a strategic rule might be to go long on the PSAR signal if and only if the price is above the upward sloping 50-day moving average and if the 20-day moving average is above the 50-day moving average.
As Strike Placement
Options investors can go long by selling out-of-the-money puts or put spreads.
They can use the PSAR dots as locations for placing the short strike since the stops indicated by PSAR are where the price is not expected to fall to.
We certainly don’t want the price to fall down to our short strike.
It is the same concept for bear call spreads when going short.
Example
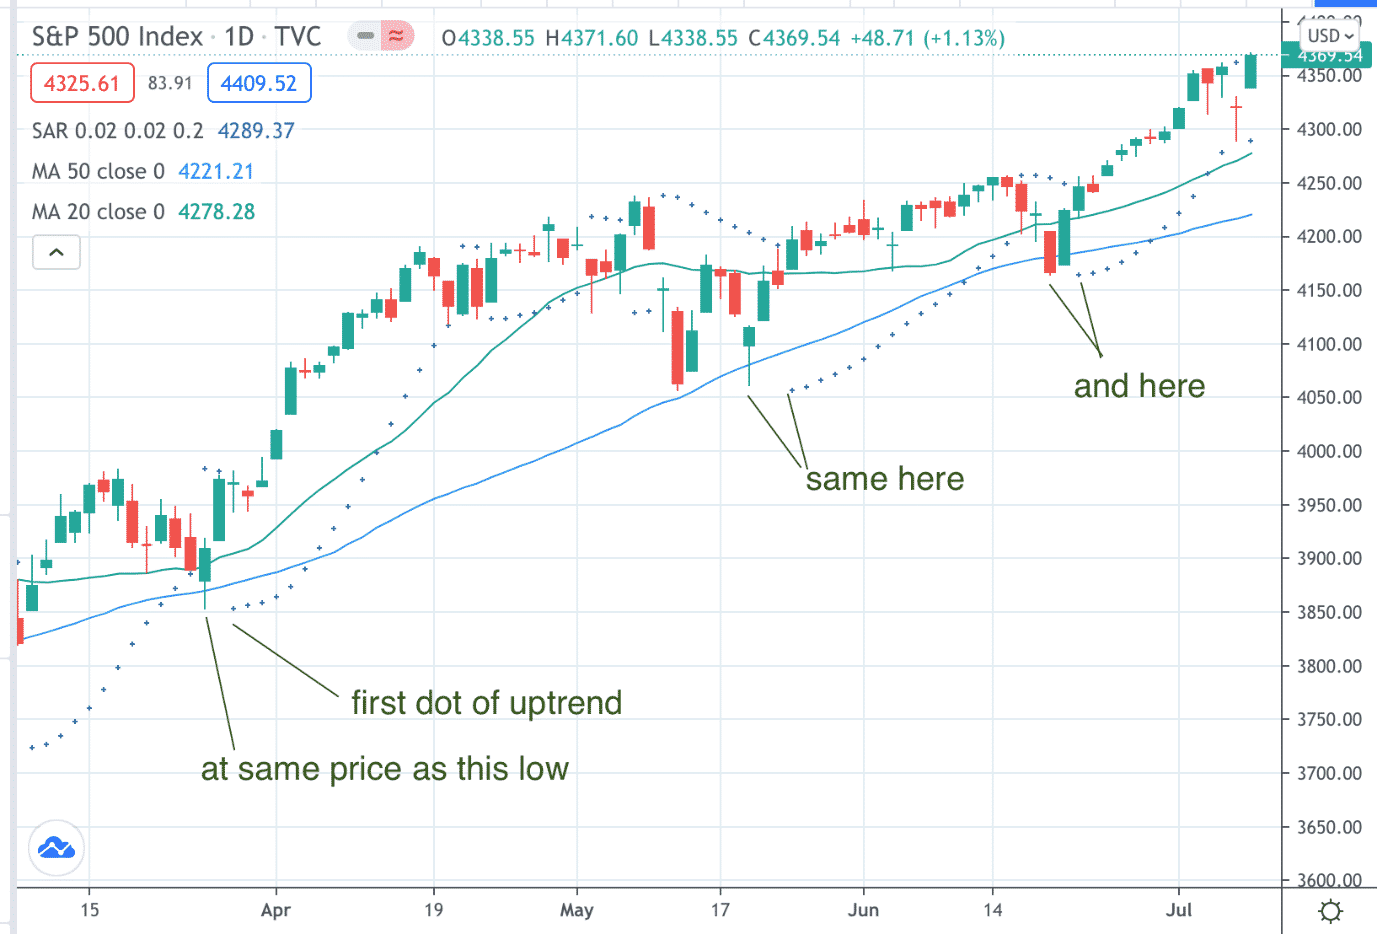
In this example of SPX, a signal to go long was given on March 29th.
It meets all the rules.
Price above the blue 50-day moving average, which is sloping up.
The green 20-day moving average is above the 50-day.
Note that the location of the first dot in an uptrend is precisely where the previous price low was.
This is not a coincidence.
It is also typically where investors like to put stop loss orders.
An investor sells a bull put spread with the short strike at this location at $3850.
Date: March 29, 2021 near market close
Price: $3971.10
Buy one $3825 SPX May 14 put @ $52.60
Sell one $3850 SPX May 14 put @ $57.60
Credit: $500
Max Risk: $2000
The investor plans to take profits at 50% of max profit.
Otherwise, exit when PSAR signals an exit.
If at less than 21 days till expiration and still in the trade, exit with whatever profit or loss.
On April 7th, the investor took profits of $250.
If this didn’t occur, the PSAR would have signaled an exit on April 21st.
It is debatable whether the investor should have taken profits at the 50% max profit or wait for PSAR to signal an exit.
Sometimes (such as this case), holding the trade longer until PSAR signals would have given bigger profits ($395 instead of $250).
But other times, if profit is not taken, the market takes back the profit by reversing the price before PSAR can signal an exit.
Definition of SAR
The algorithm for calculating the SAR dots is not trivial.
Investors who want to drive a car without learning how the engine works can safely do so.
The typical settings of the PSAR indicator:
Step Setting: 0.02
Max Step Value: 0.20
Let’s start by looking at an uptrend where the SAR dots are below the price.
The first dot of an uptrend is determined by the lowest point of the previous bear trend.
Each subsequent dot is then computed by:
SAR today = SAR yesterday + (Acceleration Factor) x ( EP – SAR yesterday)
Acceleration Factor
The Acceleration Factor starts initially to be the same value as Step Setting.
For each subsequent day that makes a new high, the Acceleration Factor is increased by the Step Setting, with a cap at the Max Step Value.
If a trading day does not make a new high, the Acceleration Factor does not change.
EP is the “Extreme Point” and is the highest point achieved in the current uptrend.
If the resulting calculation puts the SAR above the previous day’s low or today’s low, the SAR value is capped at the lower of the previous day’s and today’s low.
In this way, the SAR will never run into and collide with the price.
It is the next day’s price that might collide with the SAR.
If that happens, the bull trend changes to a bear trend, with SAR dots being placed above the price.
Investors who want to get into the finer details and see some sample calculations can read Wilder’s original text in his book “New Concepts in Technical Trading Systems,” published in 1978.
Trade safe!
Disclaimer: The information above is for educational purposes only and should not be treated as investment advice. The strategy presented would not be suitable for investors who are not familiar with exchange traded options. Any readers interested in this strategy should do their own research and seek advice from a licensed financial adviser.

Amazon Associate Disclosure
Options Trading IQ is a participant in the Amazon Services LLC Associates Program, an affiliate advertising program designed to provide a means for sites to earn advertising fees by advertising and linking to amazon.com


Great article , can you scan on TOS for Psar?
Thanks
Not sure, sorry I don’t have TOS.