


Today, we are looking at the golden cross strategy.
What is it?
Is it worth following?
What are the limitations.
These are the questions we will answer and more.
Contents
- What Is A Golden Cross?
- How To Interpret A Golden Cross?
- Scenarios Where Golden Cross Fails
- Golden Cross Trading Strategy
- Limitations Of Golden Cross
- Conclusion
What Is A Golden Cross?
A Golden Cross is often used in trading terminology and can be referred to as a bullish pattern scenario.
The generally accepted definition is when the 50-day moving average crosses over the 200-day moving average.
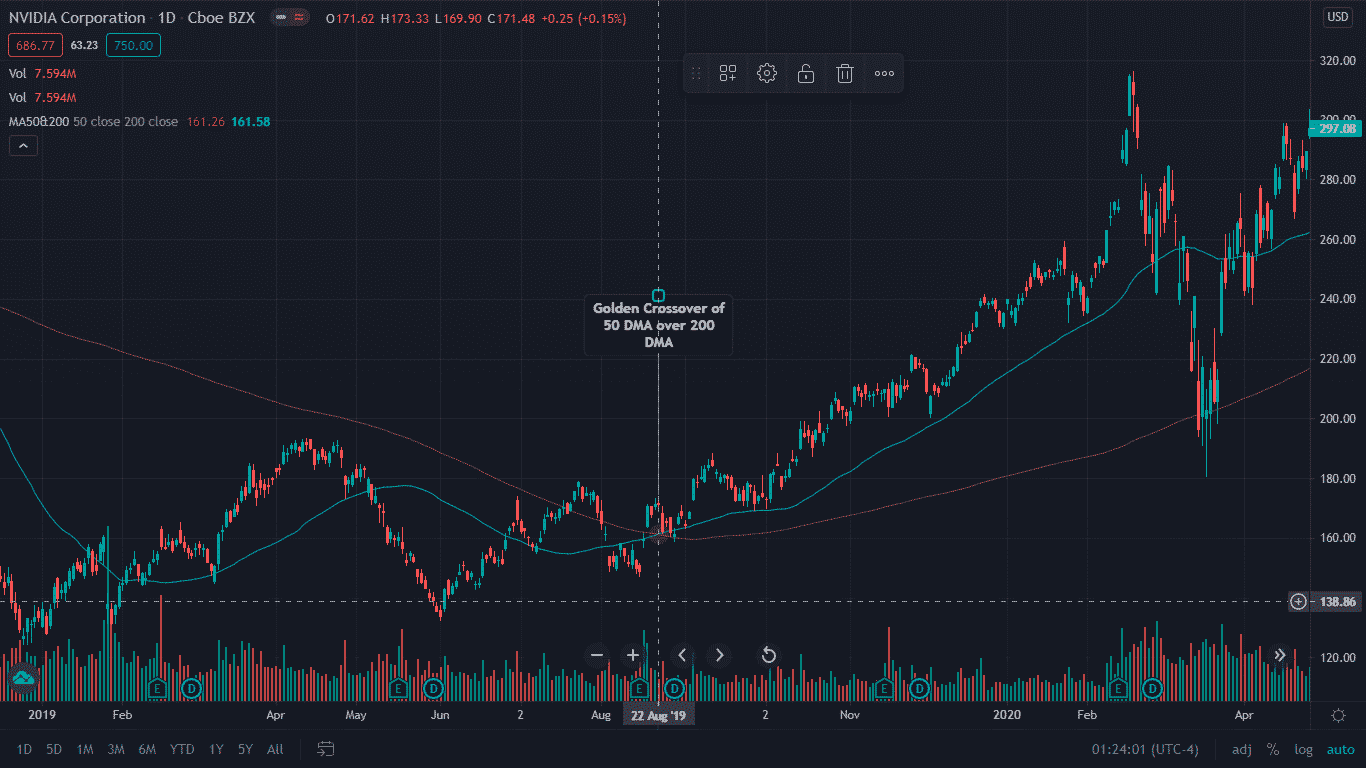
The chart below is of NVIDIA Corporation (NVDA) which had a golden cross on August 22nd, 2019.
The stock then experienced a sustained rally.
How To Interpret A Golden Cross?
A golden cross cannot be studied in isolation to understand the behavior and sentiment in the stock.
The trend before and after the crossover should be considered to form an opinion regarding the stock.
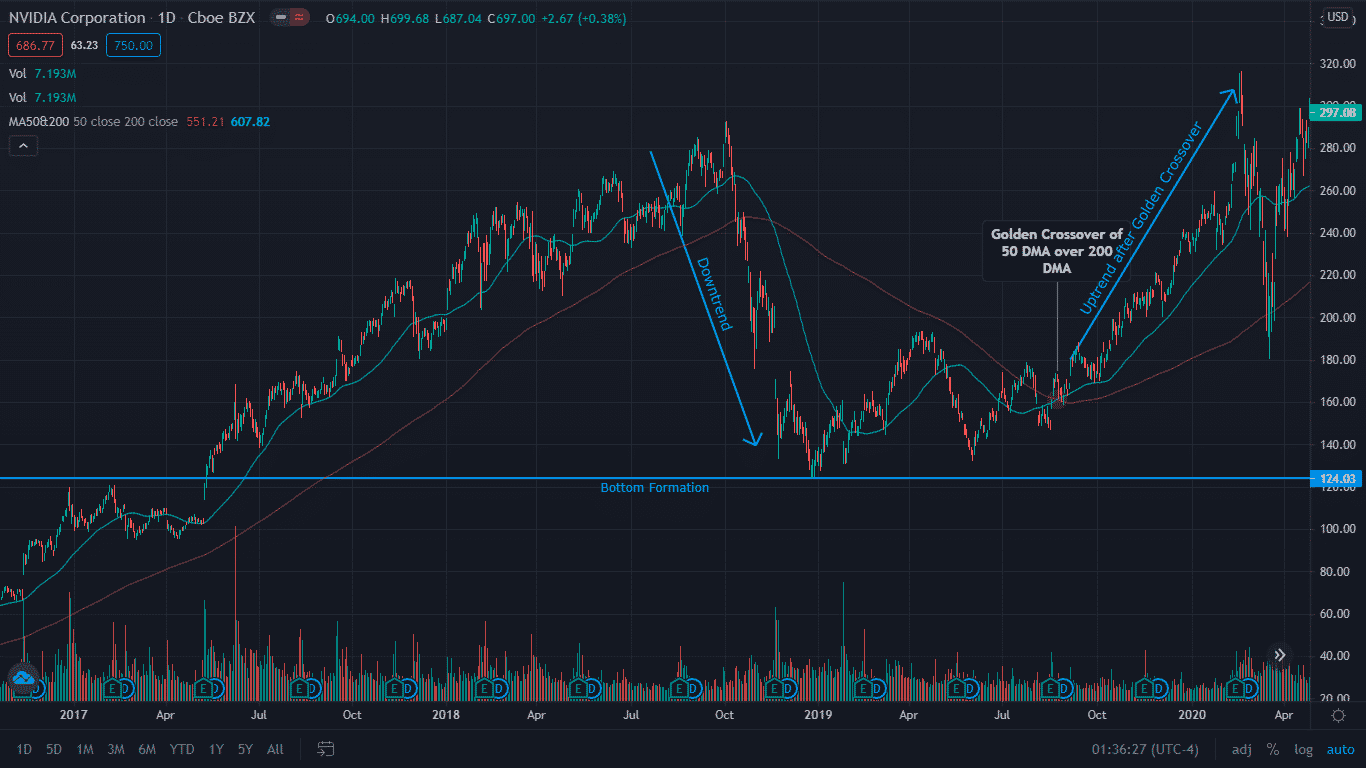
Hence, it is ideal to divide the behavior of the stock into three phases.
The first phase signals the bottom-out in a stock followed by the second phase where the 50-day crosses over the 200-day.
This signals that the stock is picking up strength with the last phase being the resumption of the uptrend after the crossover.
The below chart of NVDA reveals the three phases of the Golden Crossover.
Scenarios Where Golden Cross Fails
Simply going long when a golden cross occurs does not always work.
Often, the stock is in a consolidation phase and trading within a range, and traders get whipsawed following the golden cross.
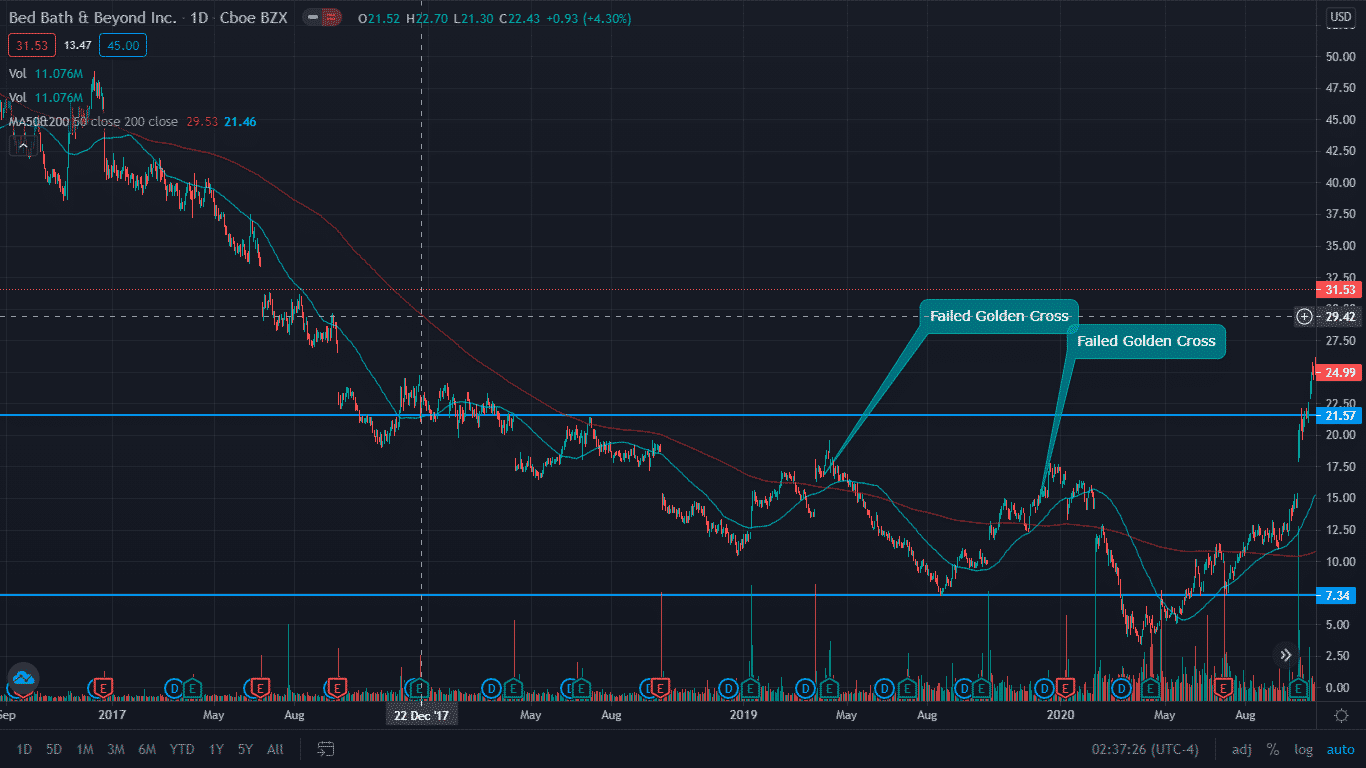
The chart below is of Bed Bath & Beyond Inc. (BBBY) which was trading within a range during the year 2019.
The stock saw two failed golden cross’ and such whipsaws in the stocks were enough to stop out bullish traders.
Hence, when trading in such crossovers, traders should also exercise their skills to judge the overall trend of the stock and use other parameters to determine stock strength.
Golden Cross Trading Strategy
Traders can use the golden cross to formulate their strategy, but it should not be the only factor used when going long.
The trend and sentiment of the stock should be ascertained, and it should also be determined whether the stock is in overbought/oversold territory.
The golden crossover strategy helps traders in initiating a long position in the stock and the reverse can indicate opportunities to go short.
That is when the 50-day moving average crosses below the 200-day moving average, which is also referred to as “Death Cross”.
When this occurs, long traders can close their positions.
Often, a death cross is used by traders for initiating fresh short positions in the stock.
Here, we will see how such a cross-over strategy can be streamlined to increase the odds of winning by traders.
Let us proceed with the step-by-step process in formulating a trade setup using such cross over strategy: –
- The first and foremost step involves identifying a Golden Cross on a higher timeframe, say daily.
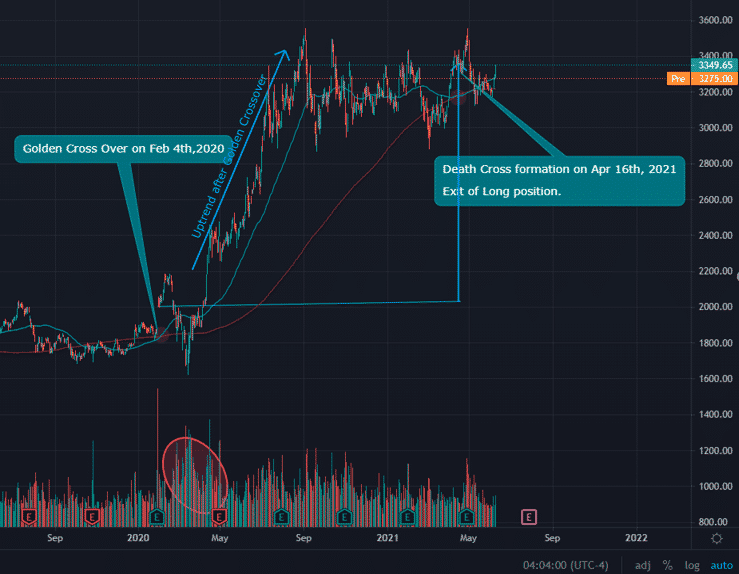
Here is an example of the below chart of Amazon.com, Inc. (AMZN) where a Golden Cross occurred around Feb 4th, 2020.
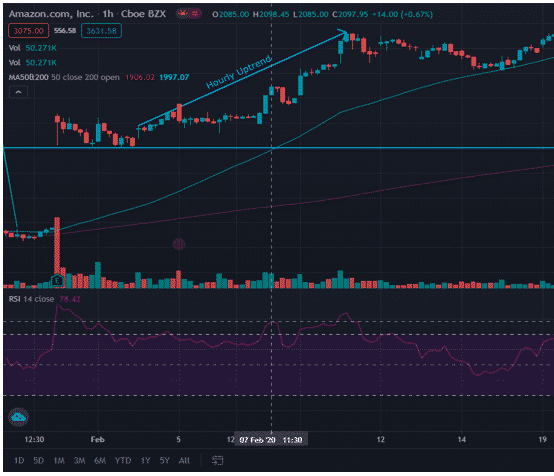
Amazon Golden Cross Strategy
Blindly going long on a golden crossover is not advisable.
Traders should look for an entry on a lower timeframe by identifying the trend, strength, and pattern in the stock.
As seen in the hourly chart of Amazon.com, after the crossover, the trend appears to be bullish with rising RSI after the stock held support at $ 2,000 which it failed to cross in its earlier attempts.
Thus, traders can initiate a long trade in the zone $ 2,000-2,050 after the crossover.
Monitoring the trade and using a stop loss strategy for riding with the trend and exiting at the correct time.
Traders can exit the long position when a death cross occurs which signals the trend reversal.
In this Amazon example, the stock rallied from $2000 to around $ 3,300 within a year before experiencing a death cross around April 16th, 2021.
This golden cross signal achieved a 50% return within one year.
Limitations Of Golden Cross
The golden crossover is a popular indicator that is used by traders for formulating long trade set ups.
However, often the stock becomes range bound and the whipsaws creating a problem for the traders.
Hence, the golden cross cannot be used in isolation for initiating a trade.
Other indicators such as volume and RSI, should be combined with the crossover indicator to determine a good entry point.
Golden crossovers tend to be more reliable on longer timeframes.
Conclusion
The golden cross indicator is one of the most important indicators which signals a longer-term bullish trend.
Due to its lagging nature, the golden cross often creates false signals and therefore should be use in conjunction with other technical indicators.
Trade safe!
Disclaimer: The information above is for educational purposes only and should not be treated as investment advice. The strategy presented would not be suitable for investors who are not familiar with exchange traded options. Any readers interested in this strategy should do their own research and seek advice from a licensed financial adviser.


