


Today we look at using the average true range stop loss placement.
The ATR indicator tells us the “Average True Range” of a stock price movement is based on the moves of the previous candles.
Many investors, be they stock investors or options investors, use the ATR indicator to help with their stop loss placement. Let’s discuss why and how to do this:
Contents
- What Is Average True Range
- Average True Range Stop Loss
- Failed Breakout Example
- Shorting Breakout Failures
- Using Bear Call Spread
- Breakout Re-Test
- Trailing Stops
- Conclusion
What Is Average True Range
The typical period in which the ATR indicator looks back is 14 periods. Although this setting can be customized.
If we look at a daily candlestick chart, the ATR calculation is based on the last 14 day’s price movement.
If we look at a weekly chart, the ATR calculation is based on the last 14 candles, therefore each candle is one trading week.
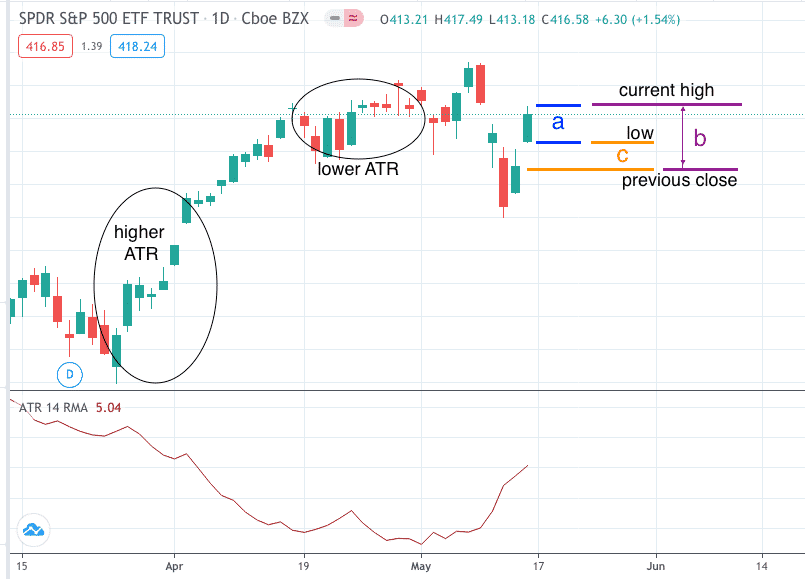
The exact definition of ATR is that it is the simple moving average of the “true range” of a stock. As a result of this the true range is the greatest of these three:
a) current high minus current low
b) absolute value of current high minus previous close
c) absolute value of current low minus previous close
You don’t really need to know how to calculate this, as any charting packing does this calculation automatically.
Average True Range Stop Loss
Conceptually, ATR is low when price moves are small, such as in consolidation with small overlapping candles and short doji candles.
ATR is high when volatility is elevated and we see long tall candles (red or green).
The Average True Range is high when a stock makes big moves either up or down.
The ATR does not indicate a direction, it only measures the magnitude of moves.
By using Average True Range for stop loss placement, we consider the volatility of the particular stock at a particular time.
The ATR value is different depending on the timeframe of the chart. In the above, we look at the daily chart of the S&P 500 ETF (SPY) where the ATR is currently at 5.
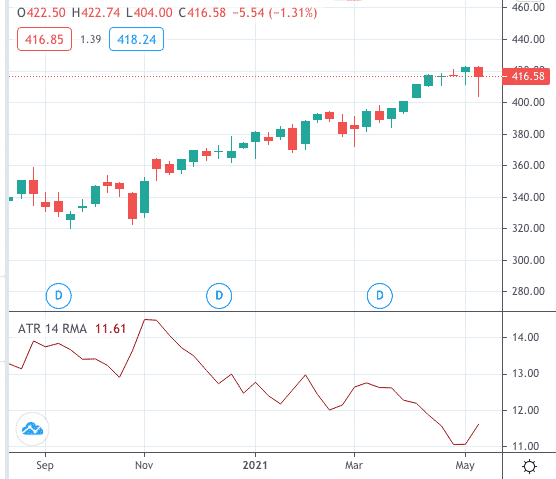
Below we look at SPY using a weekly chart where each candle is one trading week.
The ATR indicator at the bottom shows a value of 11.6.
Different stocks have different volatility and prices.
Tesla Example
Tesla (TSLA) for example prices around $600 with typical ATR values of 35.
Walgreens (WBA) prices at around $55 per share with a typical ATR value of 1.5.
The placement of a stop loss on TSLA is different than that of WBA.
Therefore we want to place a stop loss far enough away to not get stopped out by normal fluctuations in stock prices.
The ATR determines the range of these normal fluctuations based on the price of the stock, the volatility of the stock at the time, and also the timeframe in which you are trading.
A typical choice of stop placement is one ATR below the low of the entry candle, or the candle before it, depending on you enter it near the end of the market day or whether you enter it at the start of the market day.
Failed Breakout Example
On January 19th, 2021, suppose an investor notices the price of American Express (AXP) breaking out of the resistance level of $126.
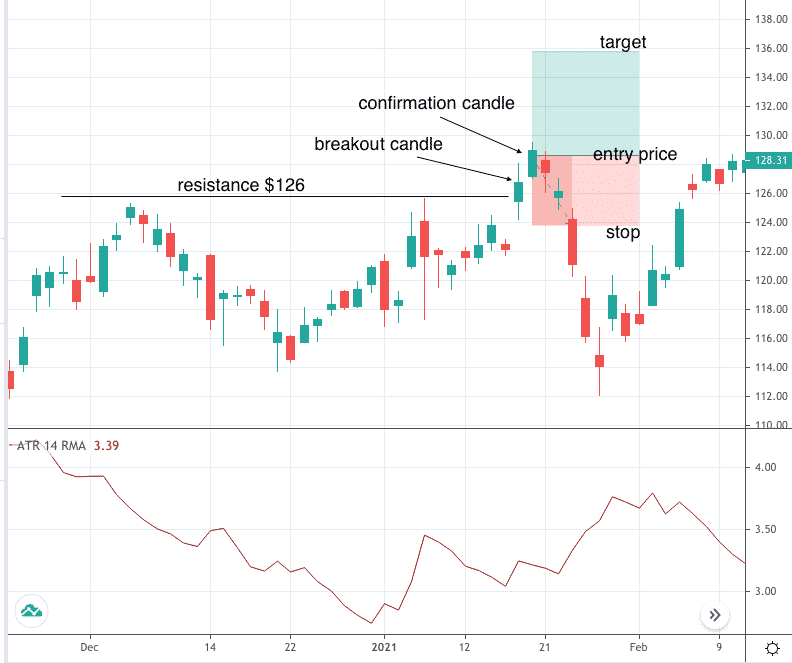
The investor decides to buy if the price goes above the high of this break-out candle on the next day. A buy stop limit order is placed to buy AXP if it breaks above $128.6.
Sometime during the next day on the 20th, the price did trade up through $128.6 and the stock purchase order is filled.
The investor sees this after the market closes and now decides where to place the stop loss.
Consequently the investor places the stop loss at one ATR below the low of the entry candle.
Date: Jan 20, 2021
Price Purchased: $128.60
Low Of The Entry Candle: $127.10
ATR: 3.2
Stop Loss: $123.9 (127.10 – 3.20)
Max Risk Per Share: $128.60 – $123.90 = $4.7
Profit Target At 1.5 x Risk: $128.60 + 1.5 x $4.7 = $135.7
This turns out to be a failed breakout and the investor gets stopped out on January 25th when the price of AXP goes below $123.90.
Shorting Breakout Failures
Another investor (or the same investor) chooses to short breakout failures.
The investor sees that on January 25th, the price opens below the low of the previous candle.
The price falls back inside the trading range of AXP after the failed breakout.
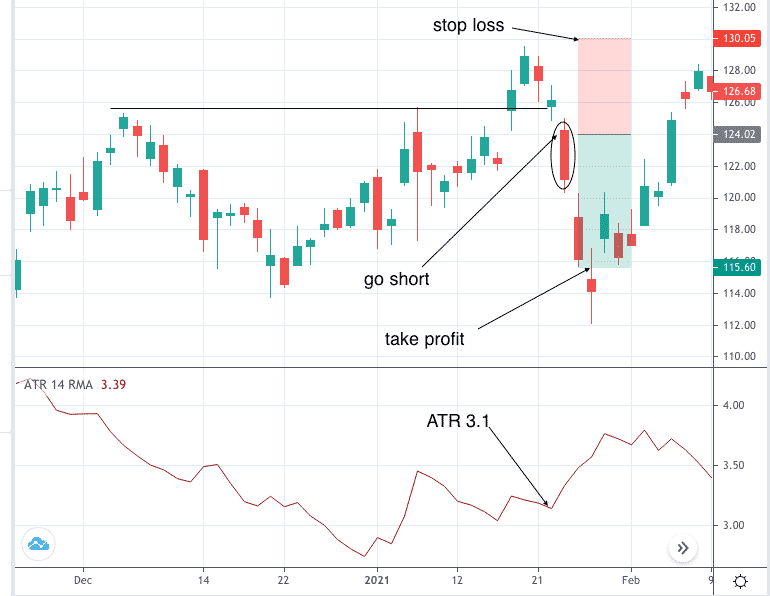
The investor shorts the stock at $124.00.
Since this is at the market open, the investor reads the ATR of the previous day to see that it is $3.10. The investor also applies the stop loss based on the high of the previous day’s candle (which is $127). Since $127.0 + 3.10 is $130.10, the investor puts in an order to buy to cover if the price exceeds $130.10.
This limits the max loss to $6 per share.
Different investors have different reward-to-risk target set.
Some prefer to have a large reward-to-risk ratio such as 2 to 1.
Others may prefer higher probability trades with a smaller reward-to-risk ratio of 1.25.
In this case, suppose the investor sets a reward-to-risk target of 1.4. That would mean the investor takes profit if the price drops to $115.60.
Calculated by $124 – 1.4 x $6 = $115.60.
The price made it down to $115.60 on January 27th, and the investor profited $8.4 per share.
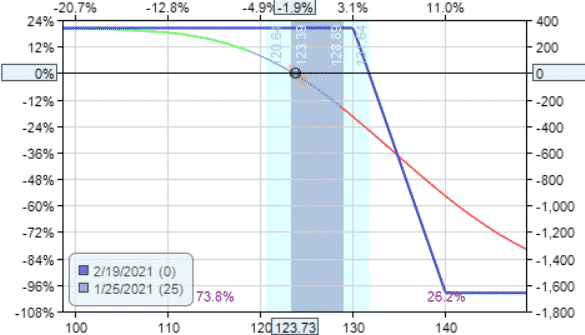
Using Bear Call Spread
An options investor might want to use options to short the same breakout failure.
It is a reasonable bet that the price will not likely go above $130, which is slightly higher than the high that the price achieved prior to the failed breakout.
The investor places a bear call spread with the short strike at $130.
Date: Jan 25, 2021
Price: AXP at $123.73
Sell two Feb 19 AXP $130 call @ $2.25
Buy two Feb 19 AXP $140 call @ $0.56
Credit: $338
The options investor can still apply his normal rules such as taking profits at 50% of the premium and stop-loss at one time the premium, or whatever his rules are.
However, in addition, the investor manages the trade based on price action.
If the price exceeds $130, the investor can exit the trade early instead of waiting to reach the options stop loss.
If the price going past $130, it already means that the investor’s original thesis for the trade is wrong.
Similarly, if the price makes a big move early in the trade where the price reaches the projected target at $115.60, the investor can just take the profit.
In this case, the 50% of the premium received is reached prior to hitting the price target. In any case, whichever came first, take the profit.
Breakout Re-Test
Because breakouts will sometimes fail, some investors prefer to go long on breakouts after a re-test of support and seeing that the support holds.
While this increases the success of trading the breakout, there are fewer opportunities in which this occurs.
This pattern occurred on Chevron (CVX) on March 1st, when the price opened above the hammer that re-tested the support.
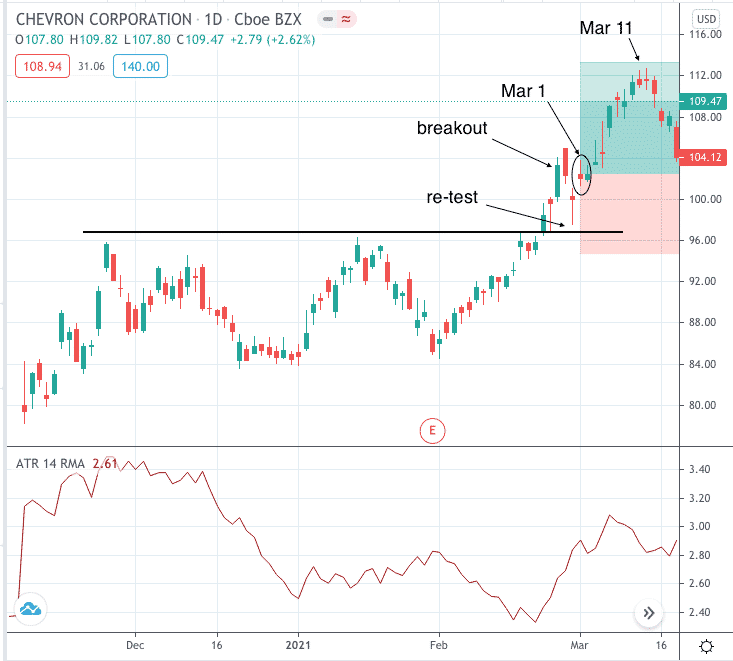
Date: March 1st, 2021
Price: CVX opened at $102.46
ATR Of Previous Candle: 2.84
Low Of Previous Candle: $97.61
Stop Loss: $97.61 – $2.84 = $94.77
Risk per share: $7.69
Target 1.4 x risk: $102.46 + 1.4 x $7.69 = $113.23
The option investor goes long with a call debit spread with the long strike at approximately where the stop loss is and the short strike at approximately at the target price.
Trade Details:
Buy one Apr 1st CVX $95 call @ $9.10
Sell one Apr 1st CVX $115 call @ $0.80
Debit and Max Risk: $830
Max Reward: $2000 – $830 = $1170
Reward to Risk ratio: 1.4
Note that the reward to risk ratio turns out to be about the same as the stock investor — provided that the investor holds till expiration.
To not risk assignment, the investor decides to take profit at $585, which is 50% of the max reward.
The investor decides to exit the trade if the loss exceeds $415, which is when 50% of the initial investment is lost.
Because we cut the profit by 50% and cut losses by the same 50%, it does not alter the reward to risk ratio: $585/$415 = 1.4
On March 11, the profit target of $585 was achieved.
In this example, we see that we can use options to mimic the same reward to risk ratios as the stock investor while using much less capital.
Trailing Stops
The ATR is also used to trail stop loss by moving the stop up as the stock goes up.
Suppose an investor buys the Goldman Sachs (GS) on February 2nd, 2021 after a pullback in an uptrend.
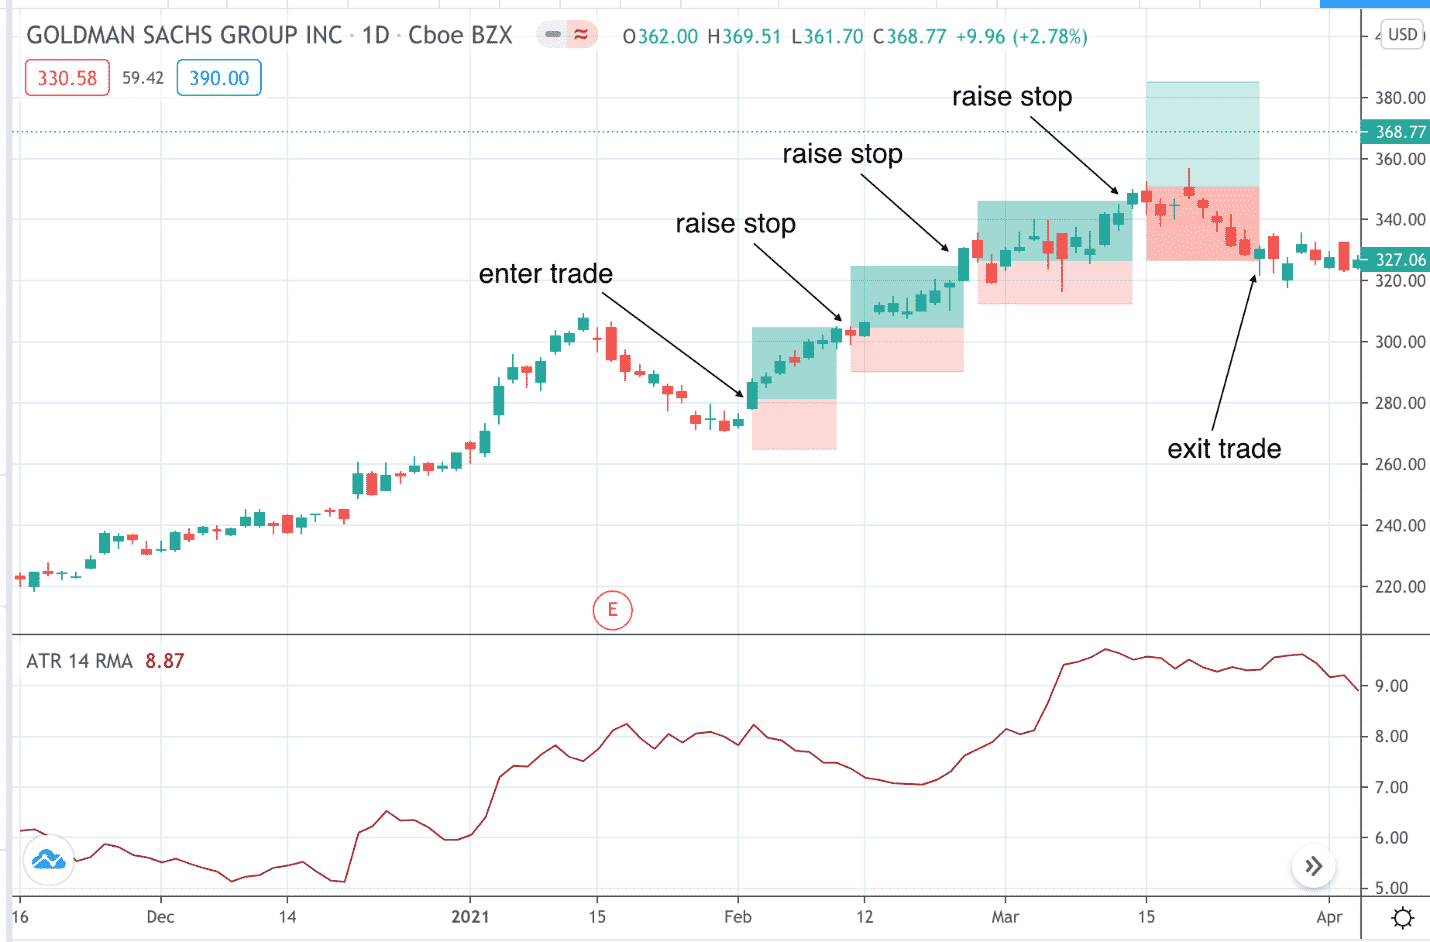
The stop is placed one ATR below the low of the previous candle.
If investors see profits of 1.4 times the current risk in the trade, the investor will raise the stop loss.
While some investors may at this point widen the stop loss to say 2 ATRs in order to ride a longer-term trend, let’s keep things simple and keep the one ATR stop loss.
The stock keeps going up, and the stops are raised as shown until the investor got stopped out on March 25.
Conclusion
Using Average True Range stop loss placement is a more objective way of setting stop losses than setting them visually by eyeing the chart.
It considers the volatility movement of the stock.
In the last example, we see that the stops are sometimes wider or narrower even though we always use one ATR stop.
This is because the ATR is changing as the price is changing. During the trade, the ATR ranged from a low of 7.1 to a high of 9.7.
There is a lot of discretion available to the investor. Some will want larger or smaller ATR stops.
Some will want smaller or larger targets, and so on.
There is no one right answer as it depends on many factors such as the nature of the market at the time as well as the trading style of the individual investor.
Trade safe!
Disclaimer: The information above is for educational purposes only and should not be treated as investment advice. The strategy presented would not be suitable for investors who are not familiar with exchange traded options. Any readers interested in this strategy should do their own research and seek advice from a licensed financial adviser.


