


Contents
If you trade butterflies, the Reverse Harvey Butterfly Adjustment is a must-have adjustment in your toolbox.
If you don’t trade butterflies, then just come and hear the story of how this name came about.
It is not me who came up with that name.
Historically, this adjustment was applied to the category of theta positive butterfly income strategies that included but is not limited to Dan Harvey’s RoadTrip trade, John Locke’s M3 trading system, Brian Larson’s Rhino, Dan Sheridan’s Mango iron butterfly, Jim Riggio’s Kevlar trade, and others.
Some of these butterfly traders were on friendly terms back when this trading style was in vogue.
Dan Harvey was making butterfly adjustments by buying back the center short strikes of the butterfly and selling the strikes further out.
(Don’t worry about the adjustment details now.
This is just the background story as told by Mark Sebastian in his webinar on adjusting butterflies.
Mark didn’t like the idea of buying expensive options and then selling cheap ones.
Why not do the reverse?
That is to sell back the outer legs of the butterfly and buy legs closer in instead.
Both Dan and Mark agreed that the effect was the same.
Mark started calling the adjustment the “Reverse Harvey,” and somehow, the name stuck with communities of butterfly traders.
In another webinar, Dan Havey was quick to mention that he was not the one who came up with that name as he is not so vain as to name an adjustment with his name.
Now let’s look at what this Reverse Harvey adjustment is all about.
Lifting the Right Wing
We previously presented one simple butterfly income strategy that does not involve many adjustments to keep the strategy simple.
Should the trader decide to do so, a Reverse Harvey adjustment can be beneficial in certain situations.
Taking an example from the previous backtest, let’s look at this SPX butterfly:
Date: Aug 3, 2021
Price: SPX @ $4394
Buy one August 31 SPX $4345 call
Sell two August 31 SPX $4395 call
Buy one August 31 SPX $4435 call
Debit: $1170
starting position:
source: OptionNet Explorer
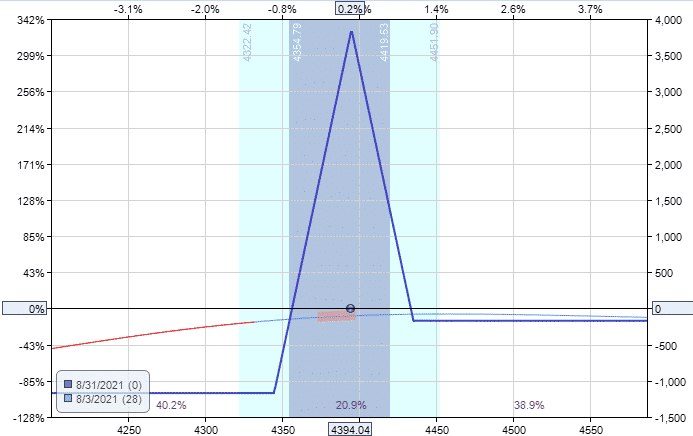
On August 13, the price has moved quite a ways up above the tent.
Currently, the max risk on the upside is $170, and the max risk on the downside is $1170.
If the price continues to go up, the T+0 line is sloped down, so we may end up losing money.
The Reverse Harvey adjustment will lift the right side of the expiration graph up and shift some of the upside risks to the downside.
We have about a negative 2 delta, and the price is not likely to fall outside the tent on the downside anytime soon.
Hence it appears safe to perform the Reverse Harvey adjustment, which we do.
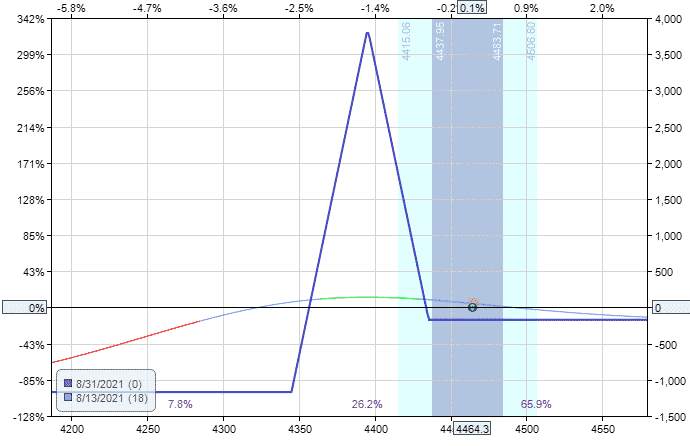
Date: August 13, 2021
Sell to close one August 31 SPX $4435 call
Buy to close one August 31 SPX $4430 call
Debit: $380
After the adjustment, our upside risk has decreased to $50, and our T+0 line had flattened to a delta of -0.37.
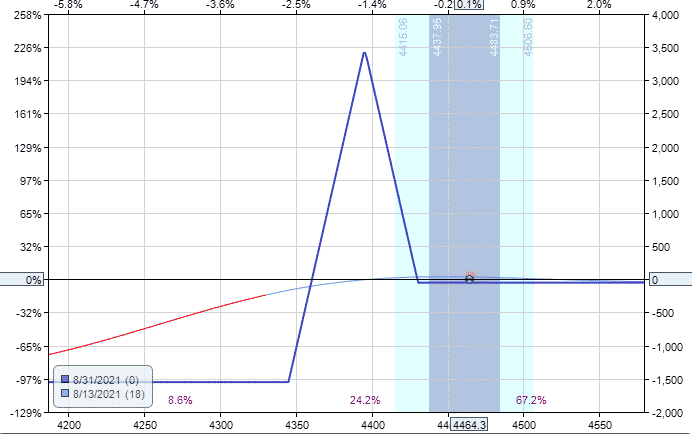
However, our downside risk has increased to $1550, increasing our margin to $1550.
In the next example, we will show how Reverse Harvey can fix this on both sides of the butterfly.
Locking in profits
One can use the Reverse Harvey adjustment to lock in some profits and continue with the trade longer to squeeze out more profits.
Take, for example, this SPX backtest trade:
Date: June 4, 2021 (two hours after market open)
Price: SPX @ $4223
Buy one July 6 SPX $4170 put
Sell two July 6 SPX $4220 put
Buy one July 6 SPX $4260 put
Debit: $220
Starting position:
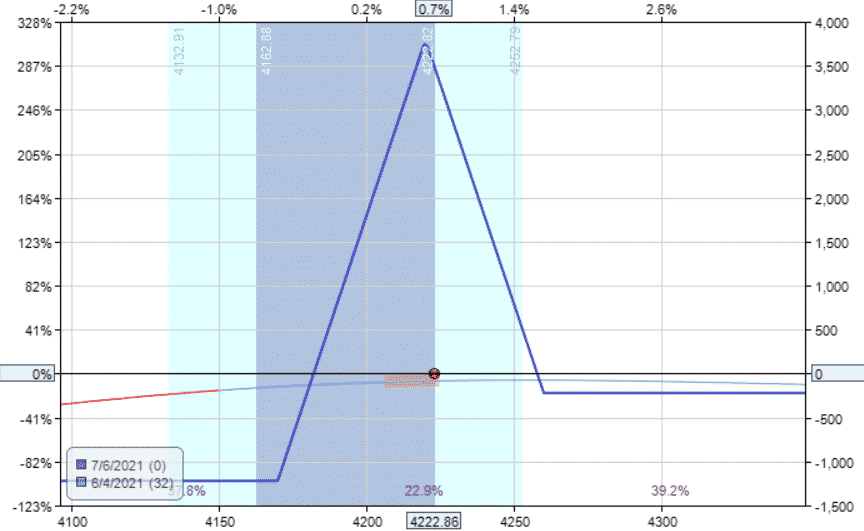
On June 17 (with 19 days till expiration), the butterfly had a profit of $190 (over 15% return) and looked like this,
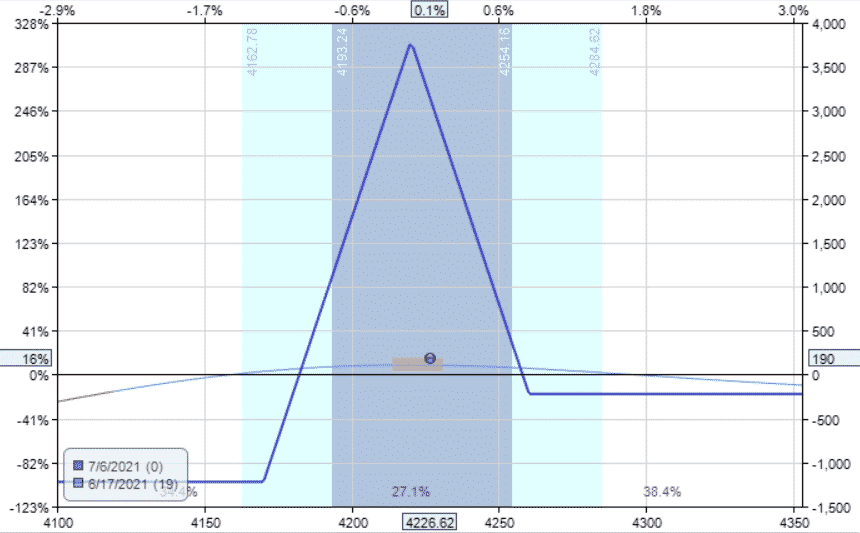
Note max loss on the left leg.
It is $1219.
With the Reverse Harvey adjustment, let’s lock in profits by rolling the top long put option down 10 points.
Sell one July 6 SPX $4260 put
Buy one July 6 SPX $4250 put
Credit: $510
We just took $510 out of the trade and stuck that money into our pockets.
The expiration graph on the right side has shifted above zero.
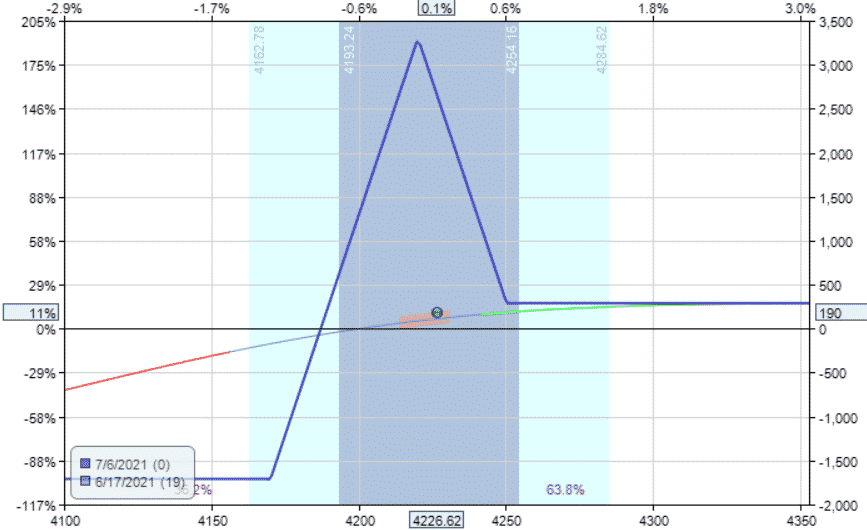
That means we have no risk on the upside.
But the T+0 line is no longer flat.
It has too much positive delta.
And our max loss on the downside had increased to $1710, causing our margin to be increased to that same amount.
Reducing Margin
To reduce the margin and the downside risk, we do a similar Reverse Harvey on the other side of the butterfly by rolling the bottom long put option up 10 points.
Sell one July 6 SPX $4170 put
Buy one July 6 SPX $4180 put
Debit: $215
This roll is a debit. In net, we have taken $295 out of the trade and placed it in the bank.
Mister Market cannot take the money away from us when the money is in the bank.
The net effect is a much narrower butterfly.
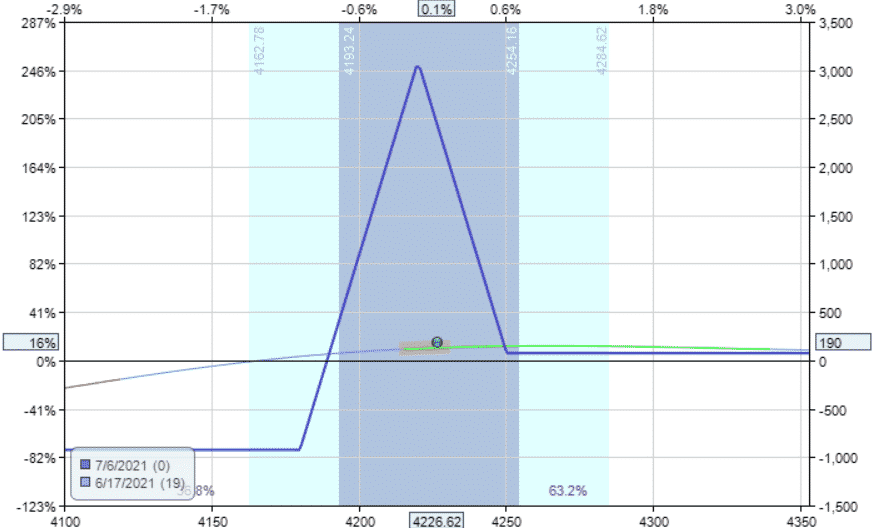
The T+0 is acceptable at a delta of 1.06.
Our max loss on the downside has decreased to $925.
And we have no risk on the upside.
Compare the risk graph from before and after.
I would say that the adjustment puts us in a better position than before.
Reducing Risk
Consider this RUT butterfly:
Date: Sept 4, 2020 (2 hours after the open)
Price: RUT @ $1516
Buy one September 4 RUT $1555 put
Sell two September 4 RUT $1515 puts
Buy one September 4 RUT $1465 put
Debit: $135
One week later, on September 11, it had profits of $180 (over 15%) with 21 days till expiration.
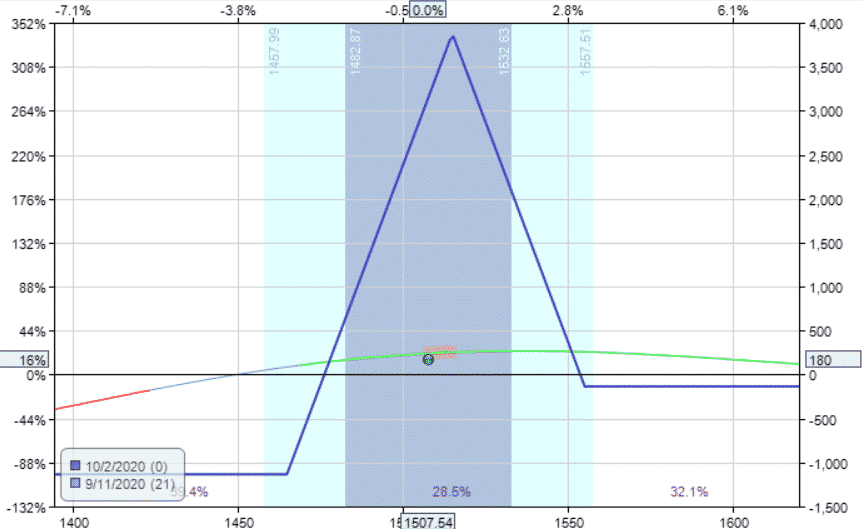
The T+0 line is starting to slope with a positive delta of 2.04.
In our original strategy, we would have taken profits at 15% and exited the trade because we don’t want large market moves to wipe out our exit profits.
However, if the trader decides to go outside the playbook, they can use a Reverse Harvey adjustment to reduce the downside risk, allowing them to continue the trade more safely.
We roll the lower put option up by 10 points.
Sell to close one October 2 RUT $1465 put
Buy to open one October 2 RUT $1475 put
Debit: $325
This trade reduces the risk on the downside to $460 and turns the broken-wing butterfly into a balanced butterfly.
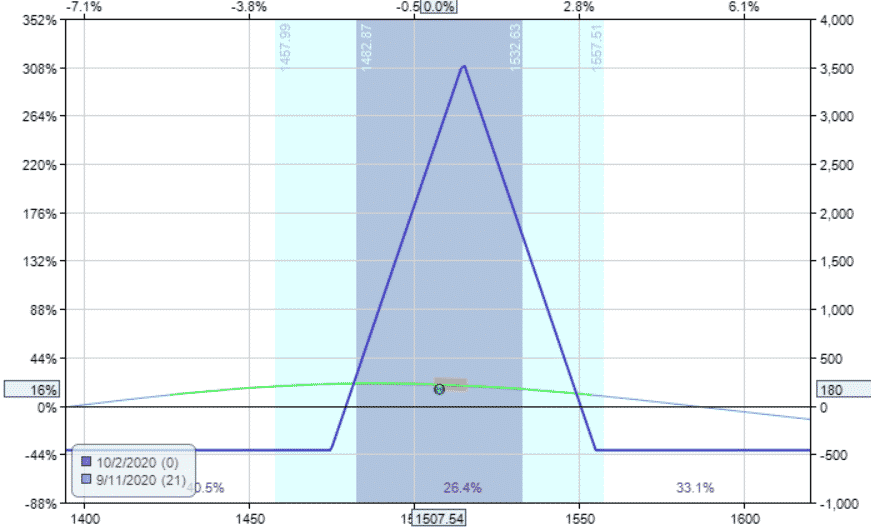
The delta has also reduced in magnitude to -1.15, giving a flatter T+0 line.
This adjustment made it safer for the trader to continue should they decide to do so.
Reducing Loss
Rolling the leg in, similar to the concept of reducing risk, can also reduce loss if the position is threatened.
For example, suppose we initiated this bearish broken-wing butterfly expecting the price of IBM to go down from here.
Date: Nov 24, 2021
Price: IBM @ $116.47
Buy one December 23 IBM 108 put
Sell two December 23 IBM 111 put
Buy one December 23 IBM 117 put
Debit: $157
Starting position:

Delta: -20.93
Theta: 0.19
Vega: 0.69
Gamma: 0.59
On December 3, we can see that price is not going down as expected. In fact, it is going up.
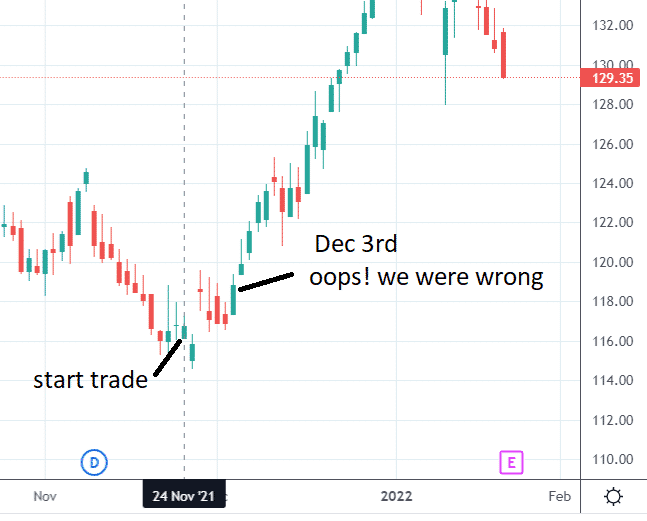
Our position now looks like this.
Delta: -15.43
Theta: -0.55
Vega: 1.92
Gamma: 1.15
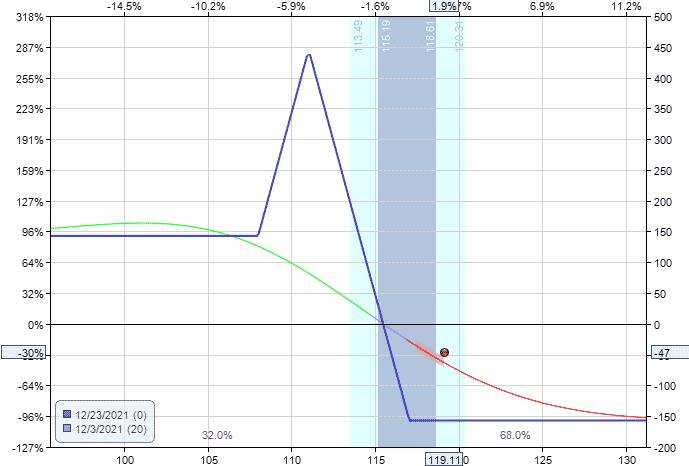
We perform a Reverse Harvey to roll the upper long put down 10 points.
Date: December 3
Sell to close one December 23 IBM $117 put
Buy to open one December 23 IBM $115 put
Credit: $57
We received $57 into our bank account for making this adjustment.
This results in a reduction of the max risk from $157 down to $100.
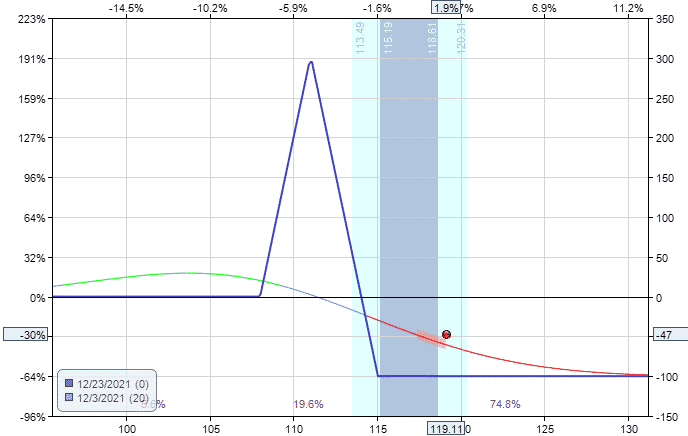
The Greeks improved — primarily the reduction in the magnitude of the delta.
Delta: -6.68
Theta: -0.23
Vega: 0.86
Gamma: 0.52
Even if the price continues to go up against us, the most we can lose is $100.
However, the butterfly is still in place (albeit with a lower profit potential) if the price decides to reverse and move in our favor.
The price did not reverse in our favor, and we did lose the $100 at expiration on December 23.
If we had not performed the adjustment, we would have lost our entire $157 at expiration instead.
Summary
This is a complex adjustment, and you may want to review it a second time to catch some of the details.
A few things to keep in mind when you do this again.
The adjustment works on call butterflies, put butterflies, and iron flies.
We adjust butterflies by shifting risk from one side of the butterfly to another.
We reduce risk/loss by narrowing the width of the wings.
A butterfly is a composition of a debit spread and a credit spread.
If the debit spread is in trouble, reduce the width of the debit spread.
If the credit spread is in trouble, reduce the width of the credit spread.
If you want, you can reduce the width of both the debit and credit spreads.
This reduces the risk on both sides.
If your adjustment results in a net credit, it signifies you’ve taken money out of the trade and locked in profits (or have reduced loss).
As with all adjustments, sometimes they can help, and sometimes they can make matters worst.
How they turn out is determined by what the trader does in the trade after the adjustment and the market’s luck.
Backtesting these adjustments will give the trader more experience to know how often they actually work and how often it is better to just exit the trade instead of adjusting it.
At least now you have a few more tools in your toolbox should you decide to use them.
Trade safe!
Disclaimer: The information above is for educational purposes only and should not be treated as investment advice. The strategy presented would not be suitable for investors who are not familiar with exchange traded options. Any readers interested in this strategy should do their own research and seek advice from a licensed financial adviser.


