


The three line strike candlestick pattern is a bit unusual because it is a four-candle pattern.
Here is an example.
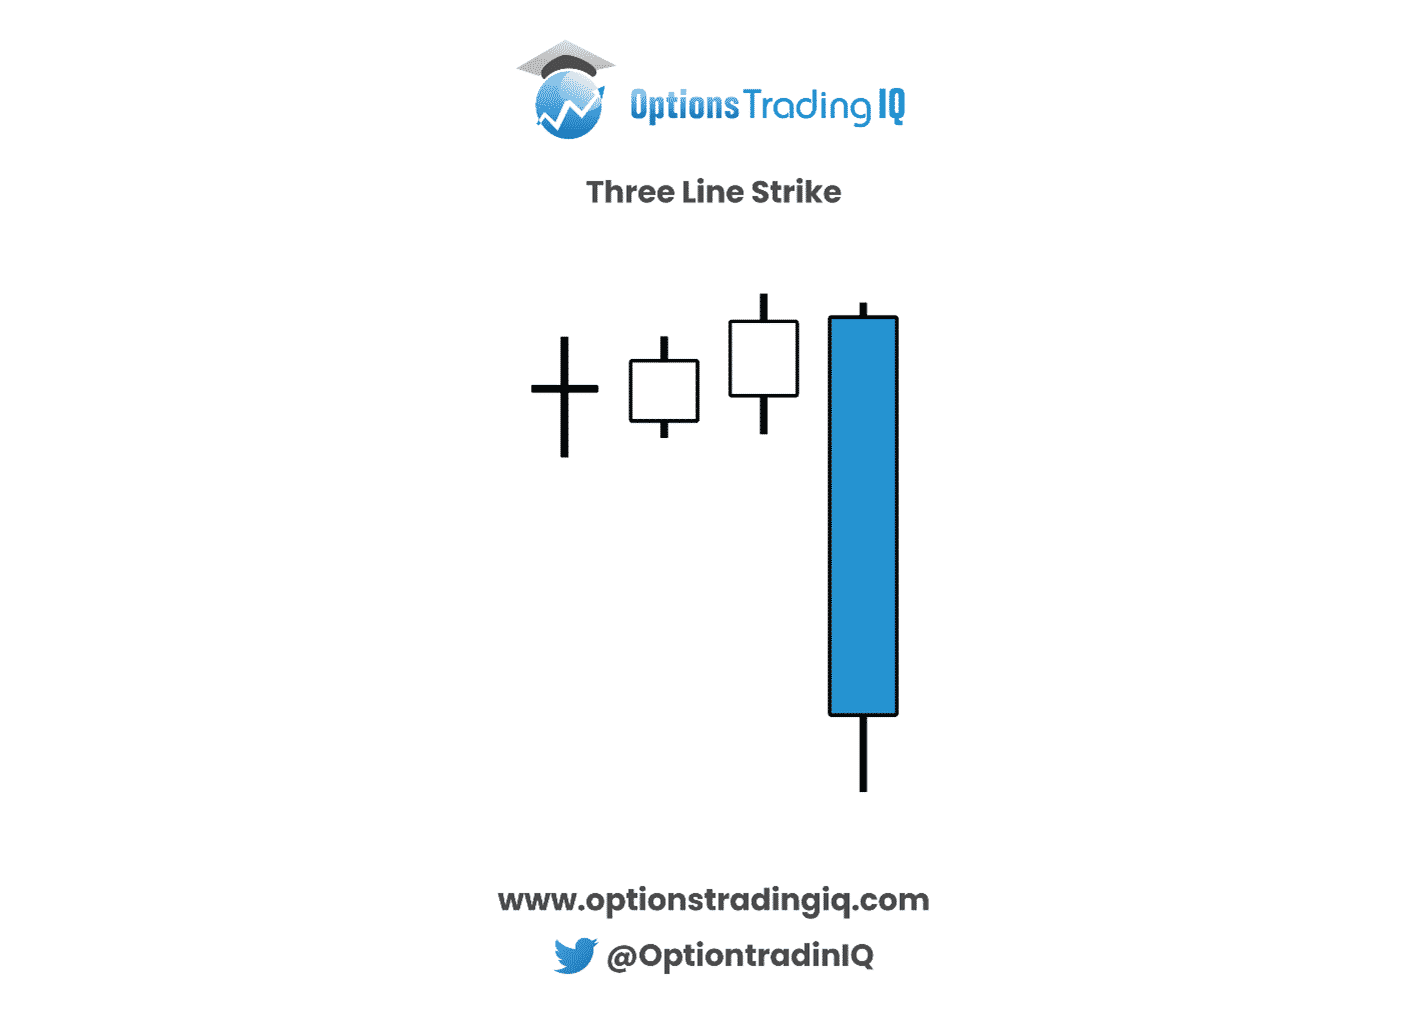
The defining characteristics of this pattern are:
- three green candles followed by one red candle
- the closing prices of the three green candles must be increasing.
- the body of the red candle must engulf the bodies of all three green candles
The body of the candle is defined as the part of the candle between the open and closing price.
Engulfing means the bearish candle has an opening price equal to or above the closing price of the third green candle.
And it has a closing price equal to or below the opening price of the first green candle.
Contents
- Introduction
- Pop Quiz
- Varying Interpretations
- Bearish Three Line Strike Pattern
- Low Frequency Of Occurrence
- Conclusion
Introduction
Now that we know what a three line strike pattern is, the question is whether this is a bullish pattern or a bearish pattern?
We claim that this is a bearish pattern because contained within it (the last two candles) is a bearish engulfing pattern.
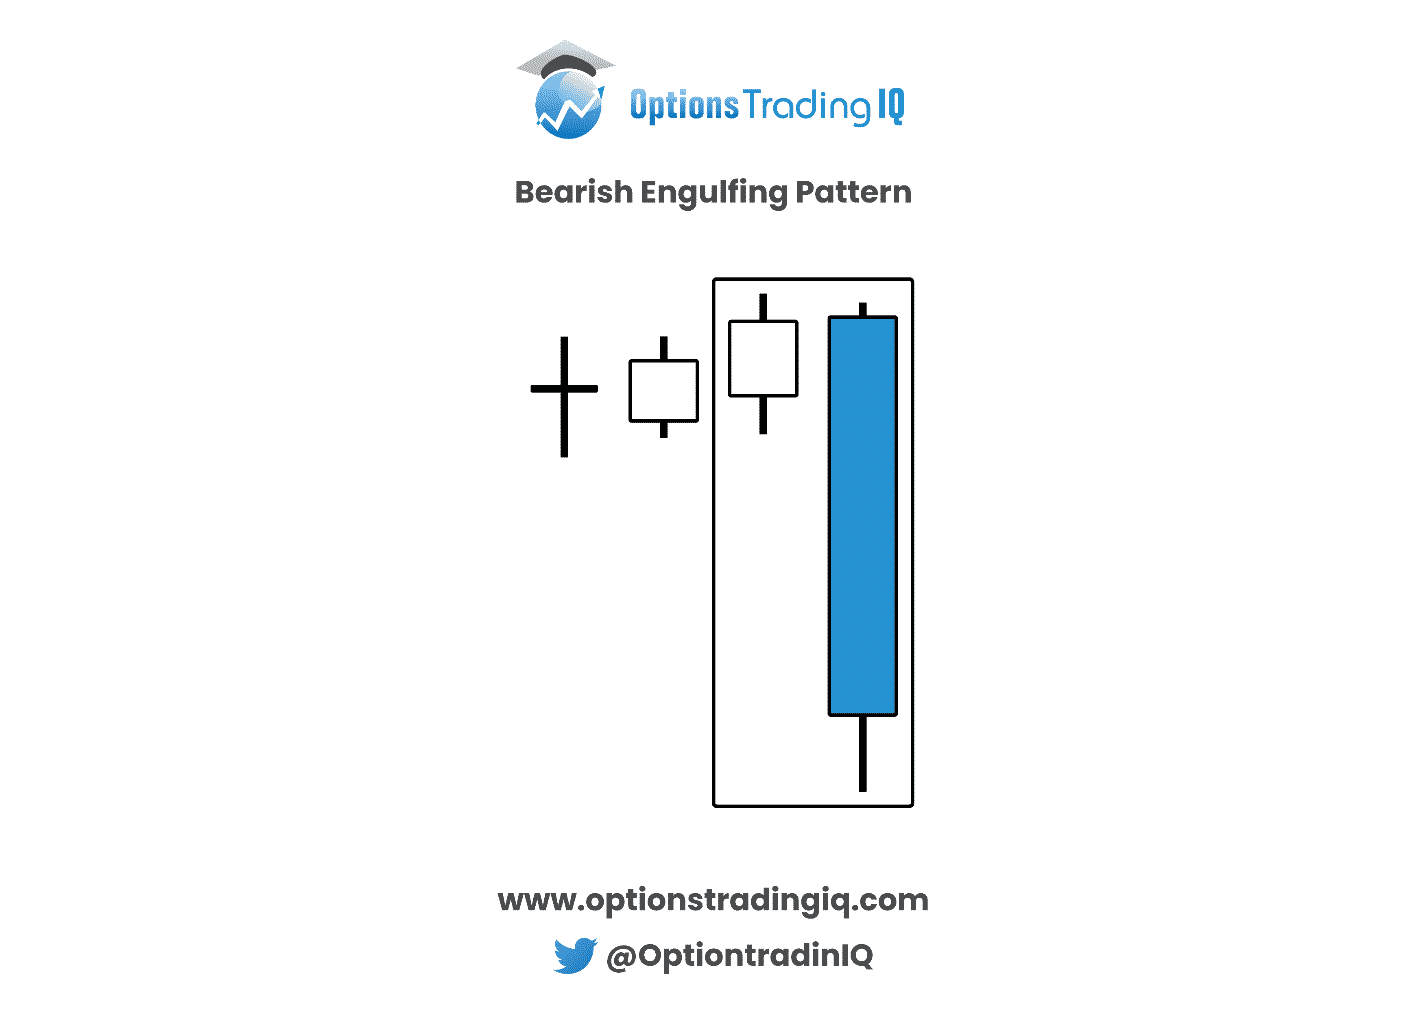
This also means that the three line strike pattern is more difficult to find than the bearish engulfing pattern (which is only a two-candle pattern).
If you perform “candlestick math” to combine the three green candles into one candle, you get…
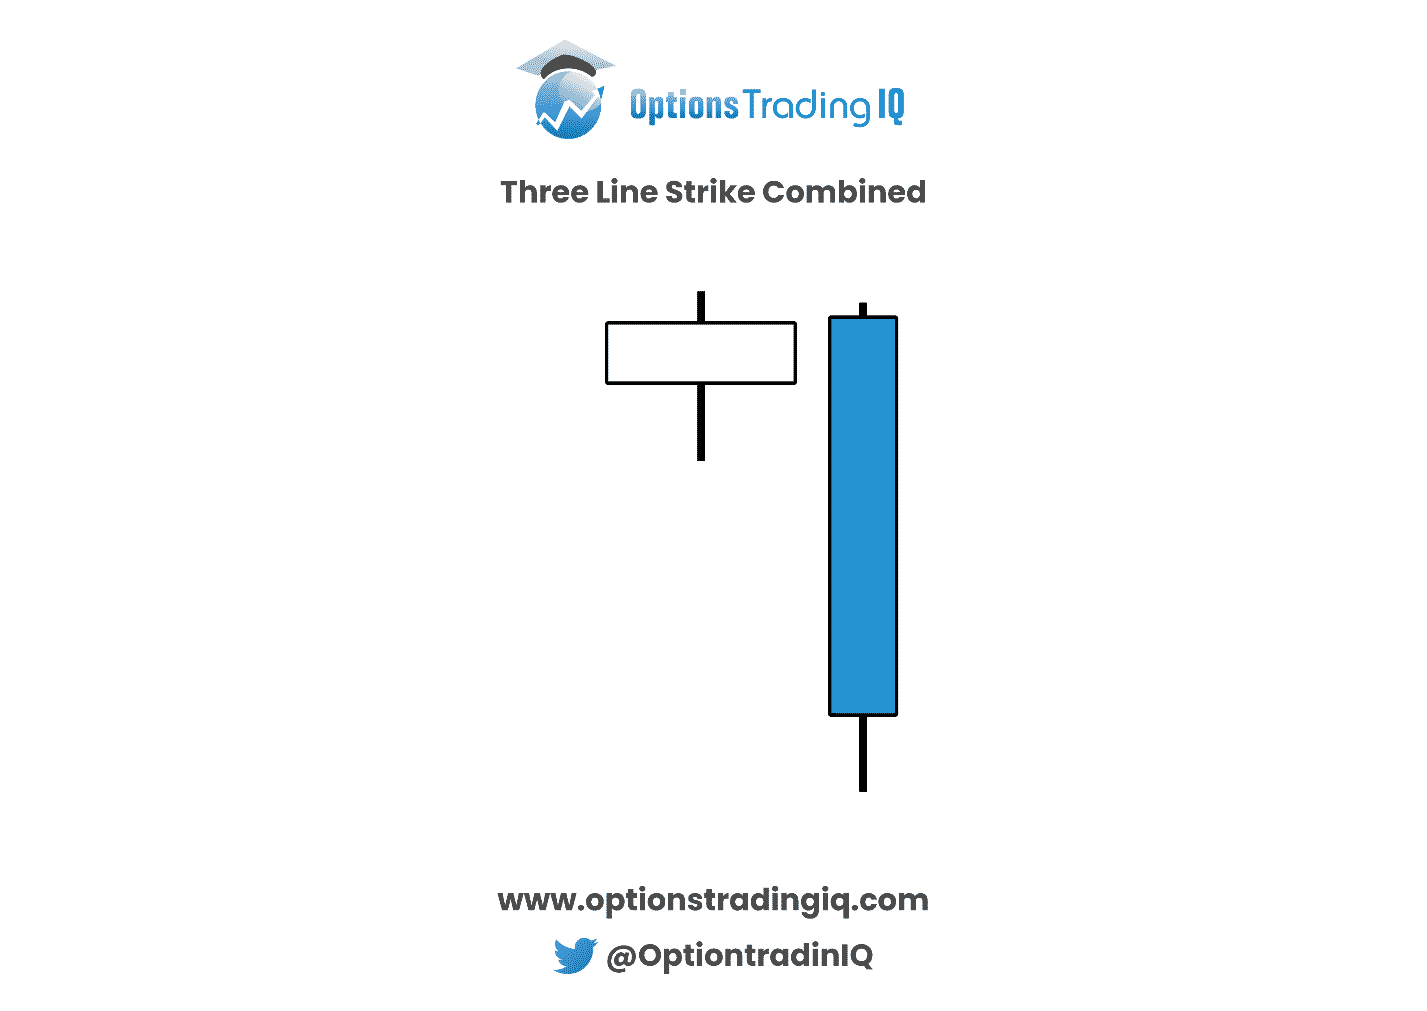
The resulting candle is derived by taking the opening price of the first candle and the closing price of the third candle.
The wicks are the highest and lowest point of all three candles.
Merging the three candles into one candle, you see that we have a bearish engulfing pattern.
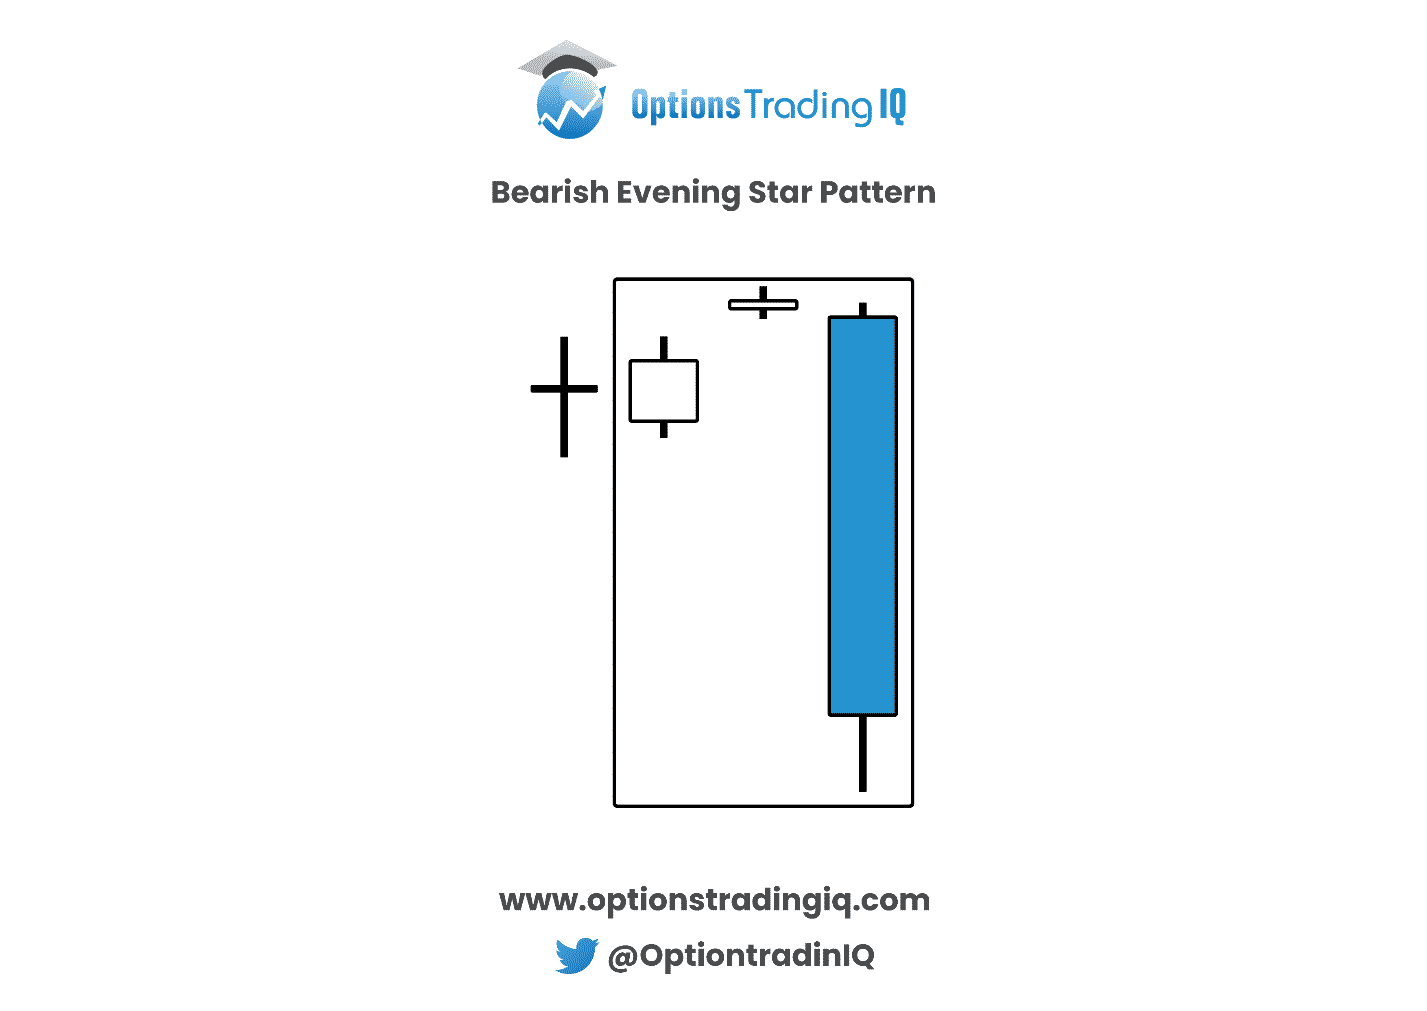
Furthermore, if you imagine that the second-to-last candle as being higher and shorter, then we have the evening star pattern which we know to be bearish…
On September 3rd, 2020, we see the three line strike pattern in Home Depot (HD).
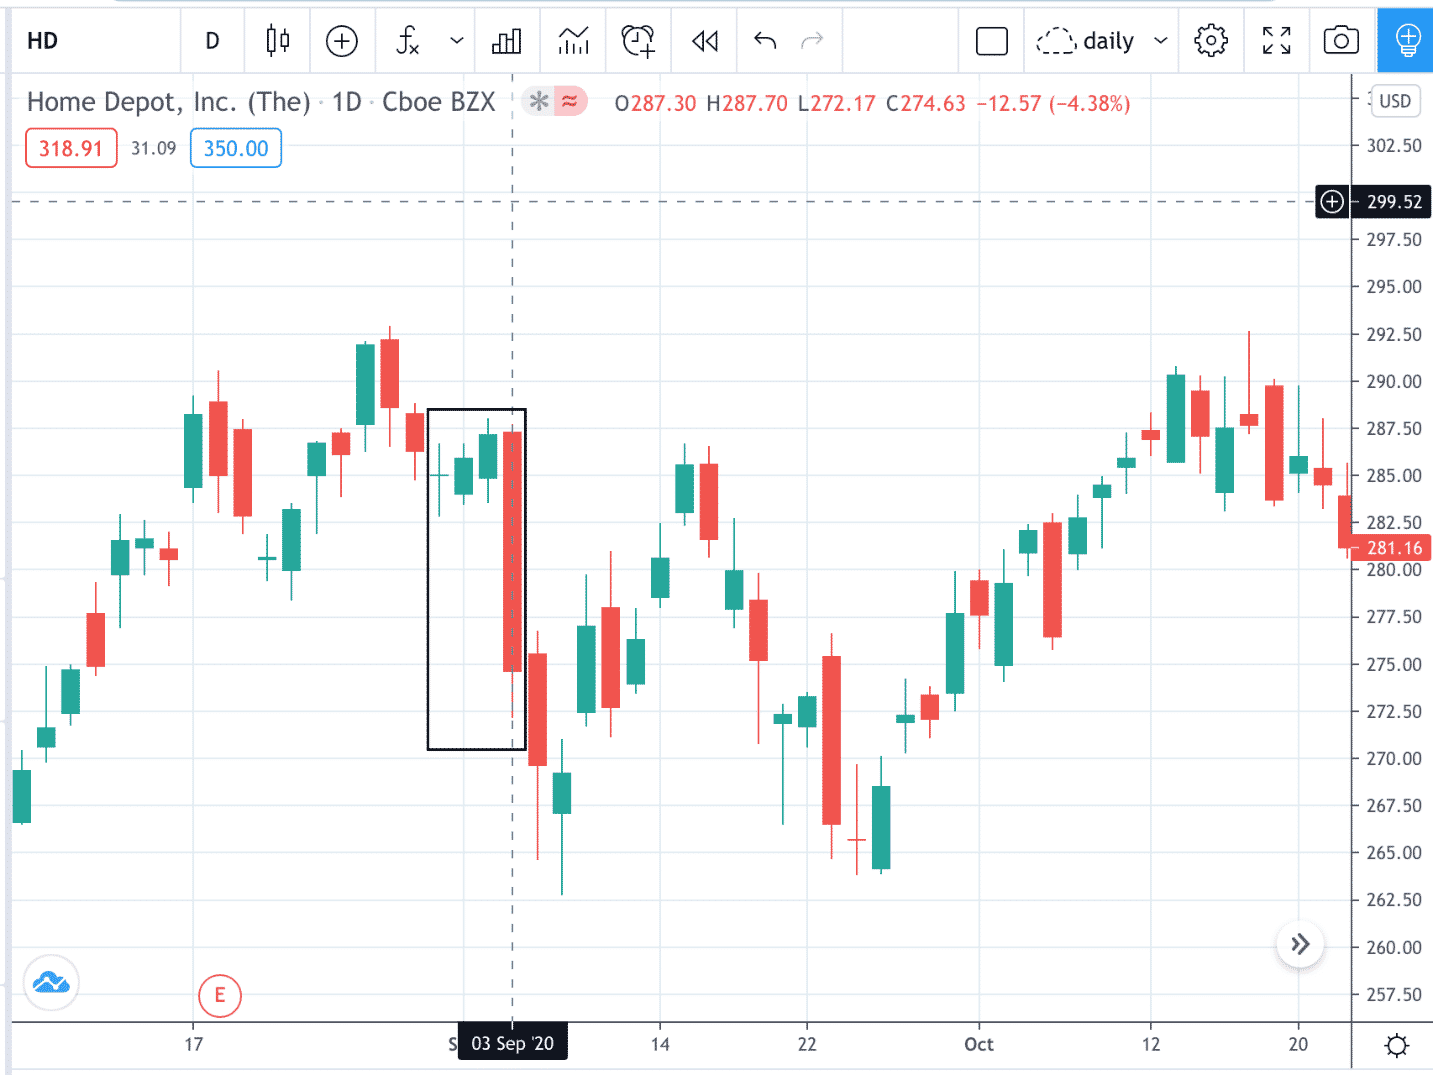
And immediately following the pattern, we see prices drop in the next two candles.
Candlestick patterns are short-term patterns.
The price movement that they suggest is only applicable within the next few candles.
Pop Quiz
Is this pattern seen on Boeing (BA) on July 30, 2018, a three line strike pattern?
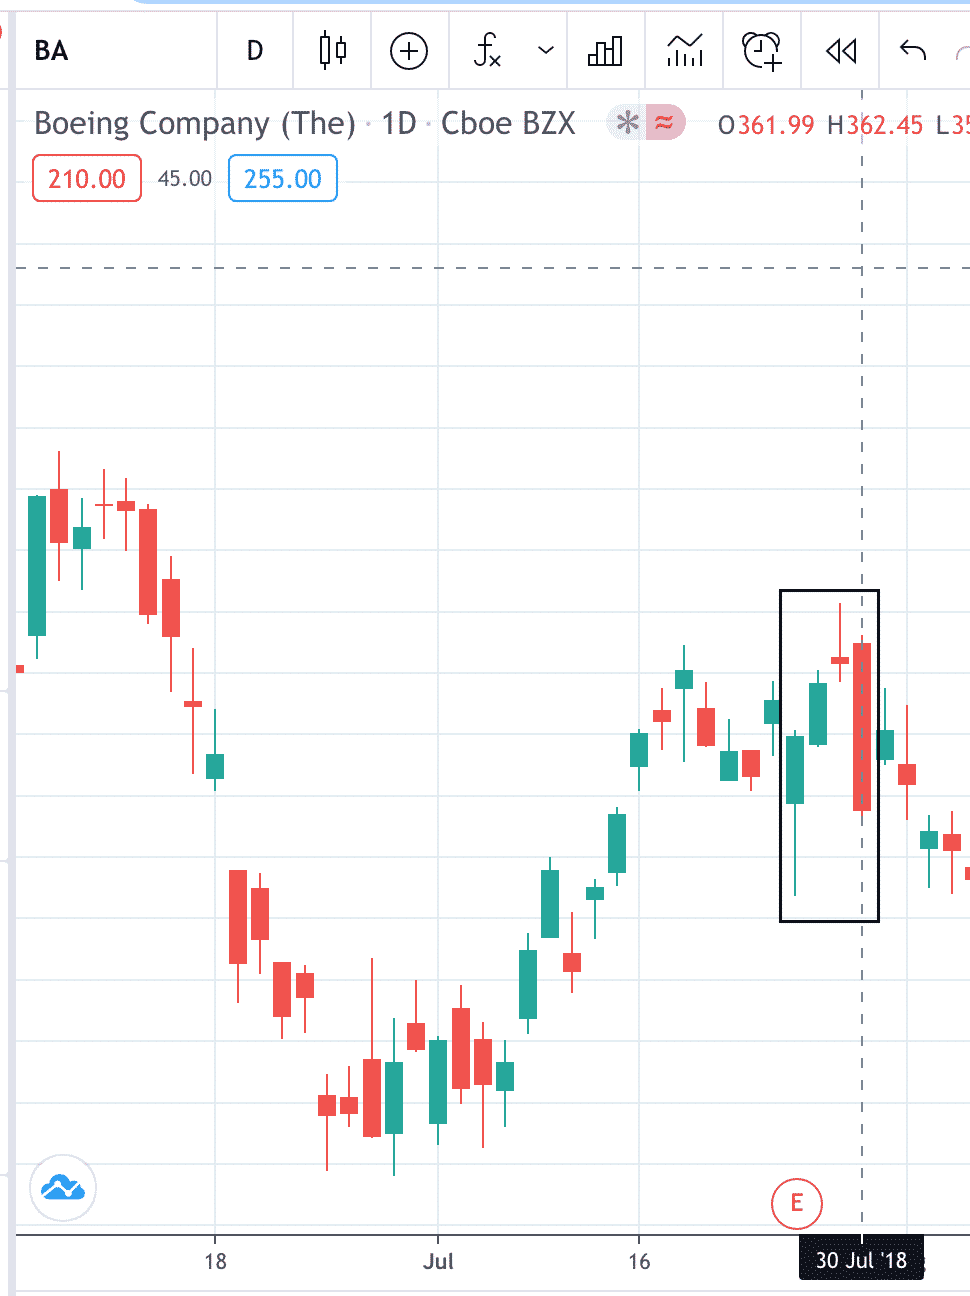
The answer is no. But it is close.
The third candle is not green.
If it had been green, then it would have satisfied all our criteria.
Varying Interpretations
There are varying interpretations of the three line strike pattern.
Some will use the low price of the three green candles.
While others will use the closing price.
We concur that the closing price is the more important price.
Other interpretations may have additional requirements of the opening price, or the low price be subsequently higher in the three green candles.
We are not so strict as to require this since this pattern is quite rare already.
If you make requirements so strict that the pattern occurrence is so rare, then it would be of little practical value since the opportunity to capitalize on the pattern is low.
You might occasionally come across contrary literature that the above pattern is labeled as “bullish” rather than a bearish pattern that we have described.
While the historical text might have described the pattern as bullish in theory (and the label stuck), modern active traders have found in practice that it behaves more bearish.
For our experience, we found that to be the case as well.
The bearish reversal interpretation is consistent with the fact that most candlestick patterns are reversal patterns.
What is more convincing is the tested results by Thomas Bulkowski where he found that the pattern did a bearish reversal more often than not.
He writes on ThePatternSite.com:
“Theory says that this candle is bullish, but since the last candle line takes price below the open of the first candle, I really don’t see how that is bullish.
I found that the pattern acts as a bearish reversal 65% of the time.”
Bearish Three Line Strike Pattern
Here is a bearish three line strike pattern seen on Merck (MRK) with 15-minute candles.
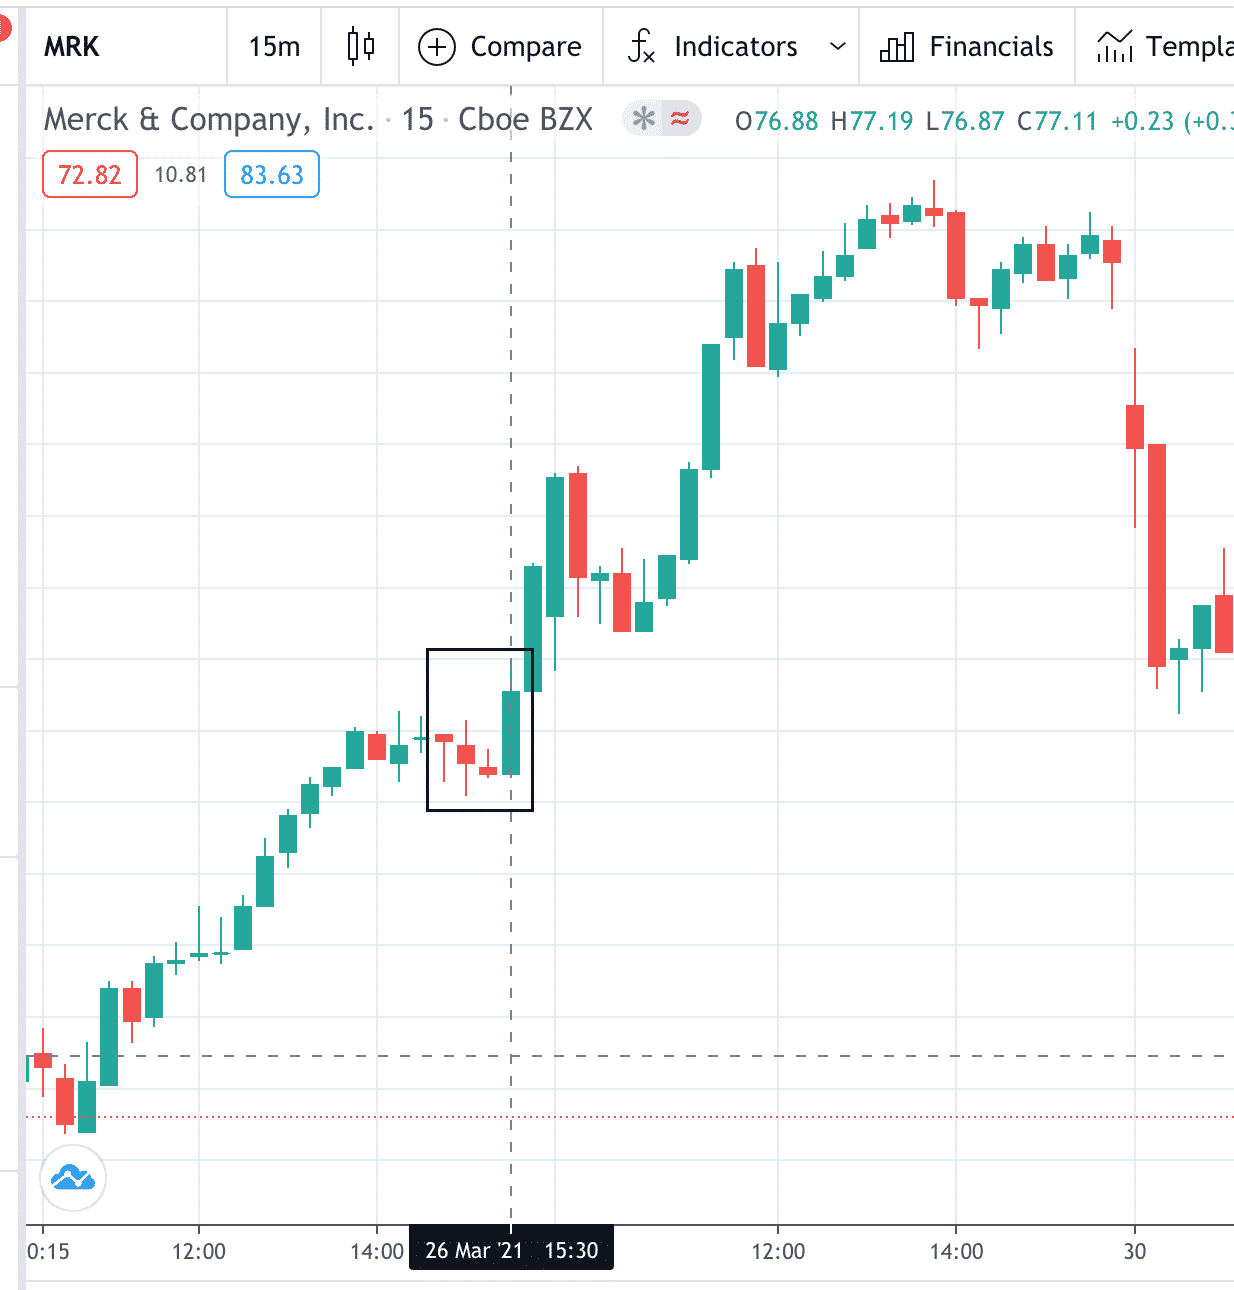
While candlestick patterns apply in all timeframes, the three line strike pattern is easier to find in intraday timeframes due to the greater variability in candle heights of adjacent candles.
Here we see three red candles with decreasing closing prices following by a green candle that engulfs all three candles.
Because these are intraday candles where one candle begins right after one candle ends, it is often the case that the green candle opens at the exact price as the close of the prior red candle — as in the case of our example here.
This will still qualify.
Engulfing patterns means that the open of the green candle is lower or equal to the close of the prior red candle, and the close of the green candle is equal or higher than the open of the first red candle.
Again, this pattern may be labeled as “bearish” in theory.
However, in practice, this pattern behaves more as a bullish pattern.
An example of this point is the above chart.
On page 761 of Bulkowski’s book “Encyclopedia of Candlestick Charts”, he writes that “the bearish three line strike candle isn’t bearish at all.”
He found that this pattern exhibited a “bullish reversal” 84% of the time during a bullish market. What about in bearish market?
The pattern turned out to be a “bullish reversal” 77% of the time then.
He does note that he could not find more than 30 samples of this pattern in a bear market.
So, it may not be statistically significant due to the small sample size.
Low Frequency Of Occurrence
This brings up another point.
The pattern is quite rare and hence is difficult to capitalize on.
Therefore, traders will tend to use the bullish engulfing and bearish engulfing two-candle pattern more in common practice.
Conclusion
The three line strike pattern is a bit confusing due to its misnomer.
The thing to remember is that it acts as an engulfing pattern.
The fact that the fourth candle engulfs the body of its three prior candle means that in the short-term at least, the price will tend to move in the direction of the engulfing candle.
Trade safe!
Disclaimer: The information above is for educational purposes only and should not be treated as investment advice. The strategy presented would not be suitable for investors who are not familiar with exchange traded options. Any readers interested in this strategy should do their own research and seek advice from a licensed financial adviser.

Amazon Associate Disclosure
Options Trading IQ is a participant in the Amazon Services LLC Associates Program, an affiliate advertising program designed to provide a means for sites to earn advertising fees by advertising and linking to amazon.com


