


Today we are looking at the best moving average for 1 minute chart.
So, which moving average is best? Read on to find out.
Contents
- What Are Moving Averages?
- Types Of Moving Averages:
- Simple Moving Average:
- Exponential Moving Average (EMA):
- How To Use Moving Averages
- Using Moving Averages As Buy And Sell Signals:
- Moving Average Crossover Trading;
- Identifying Support & Resistance Levels:
- Best Moving Average for 1 Minute Timeframe.
- Some Points To Remember While Trading Using Moving Averages:
- FAQ
- Conclusion:
What Are Moving Averages?
Before looking at the uses and implications of moving averages, let’s understand what are moving averages:
A moving average (MA) is a technical indicator that denotes the average price of the underlying asset for a certain period.
In layman terms, A moving average is a visual portrayal of the average price of an asset in a line format on any candlestick chart.
MA is plotted by a line on the chart that portrays the average price of the underlying to determine the trend.
Moving averages can be based on any time frame as selected by the user.
Types Of Moving Averages:
There are 2 types of moving averages that are commonly used, they are:
Simple Moving Average (SMA or MA)
Exponential Moving Average (EMA)
Simple Moving Average:
The simple moving average (SMA) is a technical indicator that is frequently used by traders and investors.
The SMA is calculated by obtaining the average price. It is calculated by the following formula-
P1+P2+P3+P4/n= 4.
Here “P” denotes the price of the underlying asset.
“N” denotes the total number of periods.
In simple words, the SMA provides the average price of the underlying asset, for a particular period.
This can be 7 days, 20 days, or 200 days for example.
Exponential Moving Average (EMA):
The exponential moving average is like the SMA but with a twist.
While calculating the EMA, the recent price is given a higher weighting and older prices are given lower weighting.
Unlike the SMA which gives equal weightage on all prices.
Let’s understand the difference between the “SMA” from the “EMA” from the chart given below.
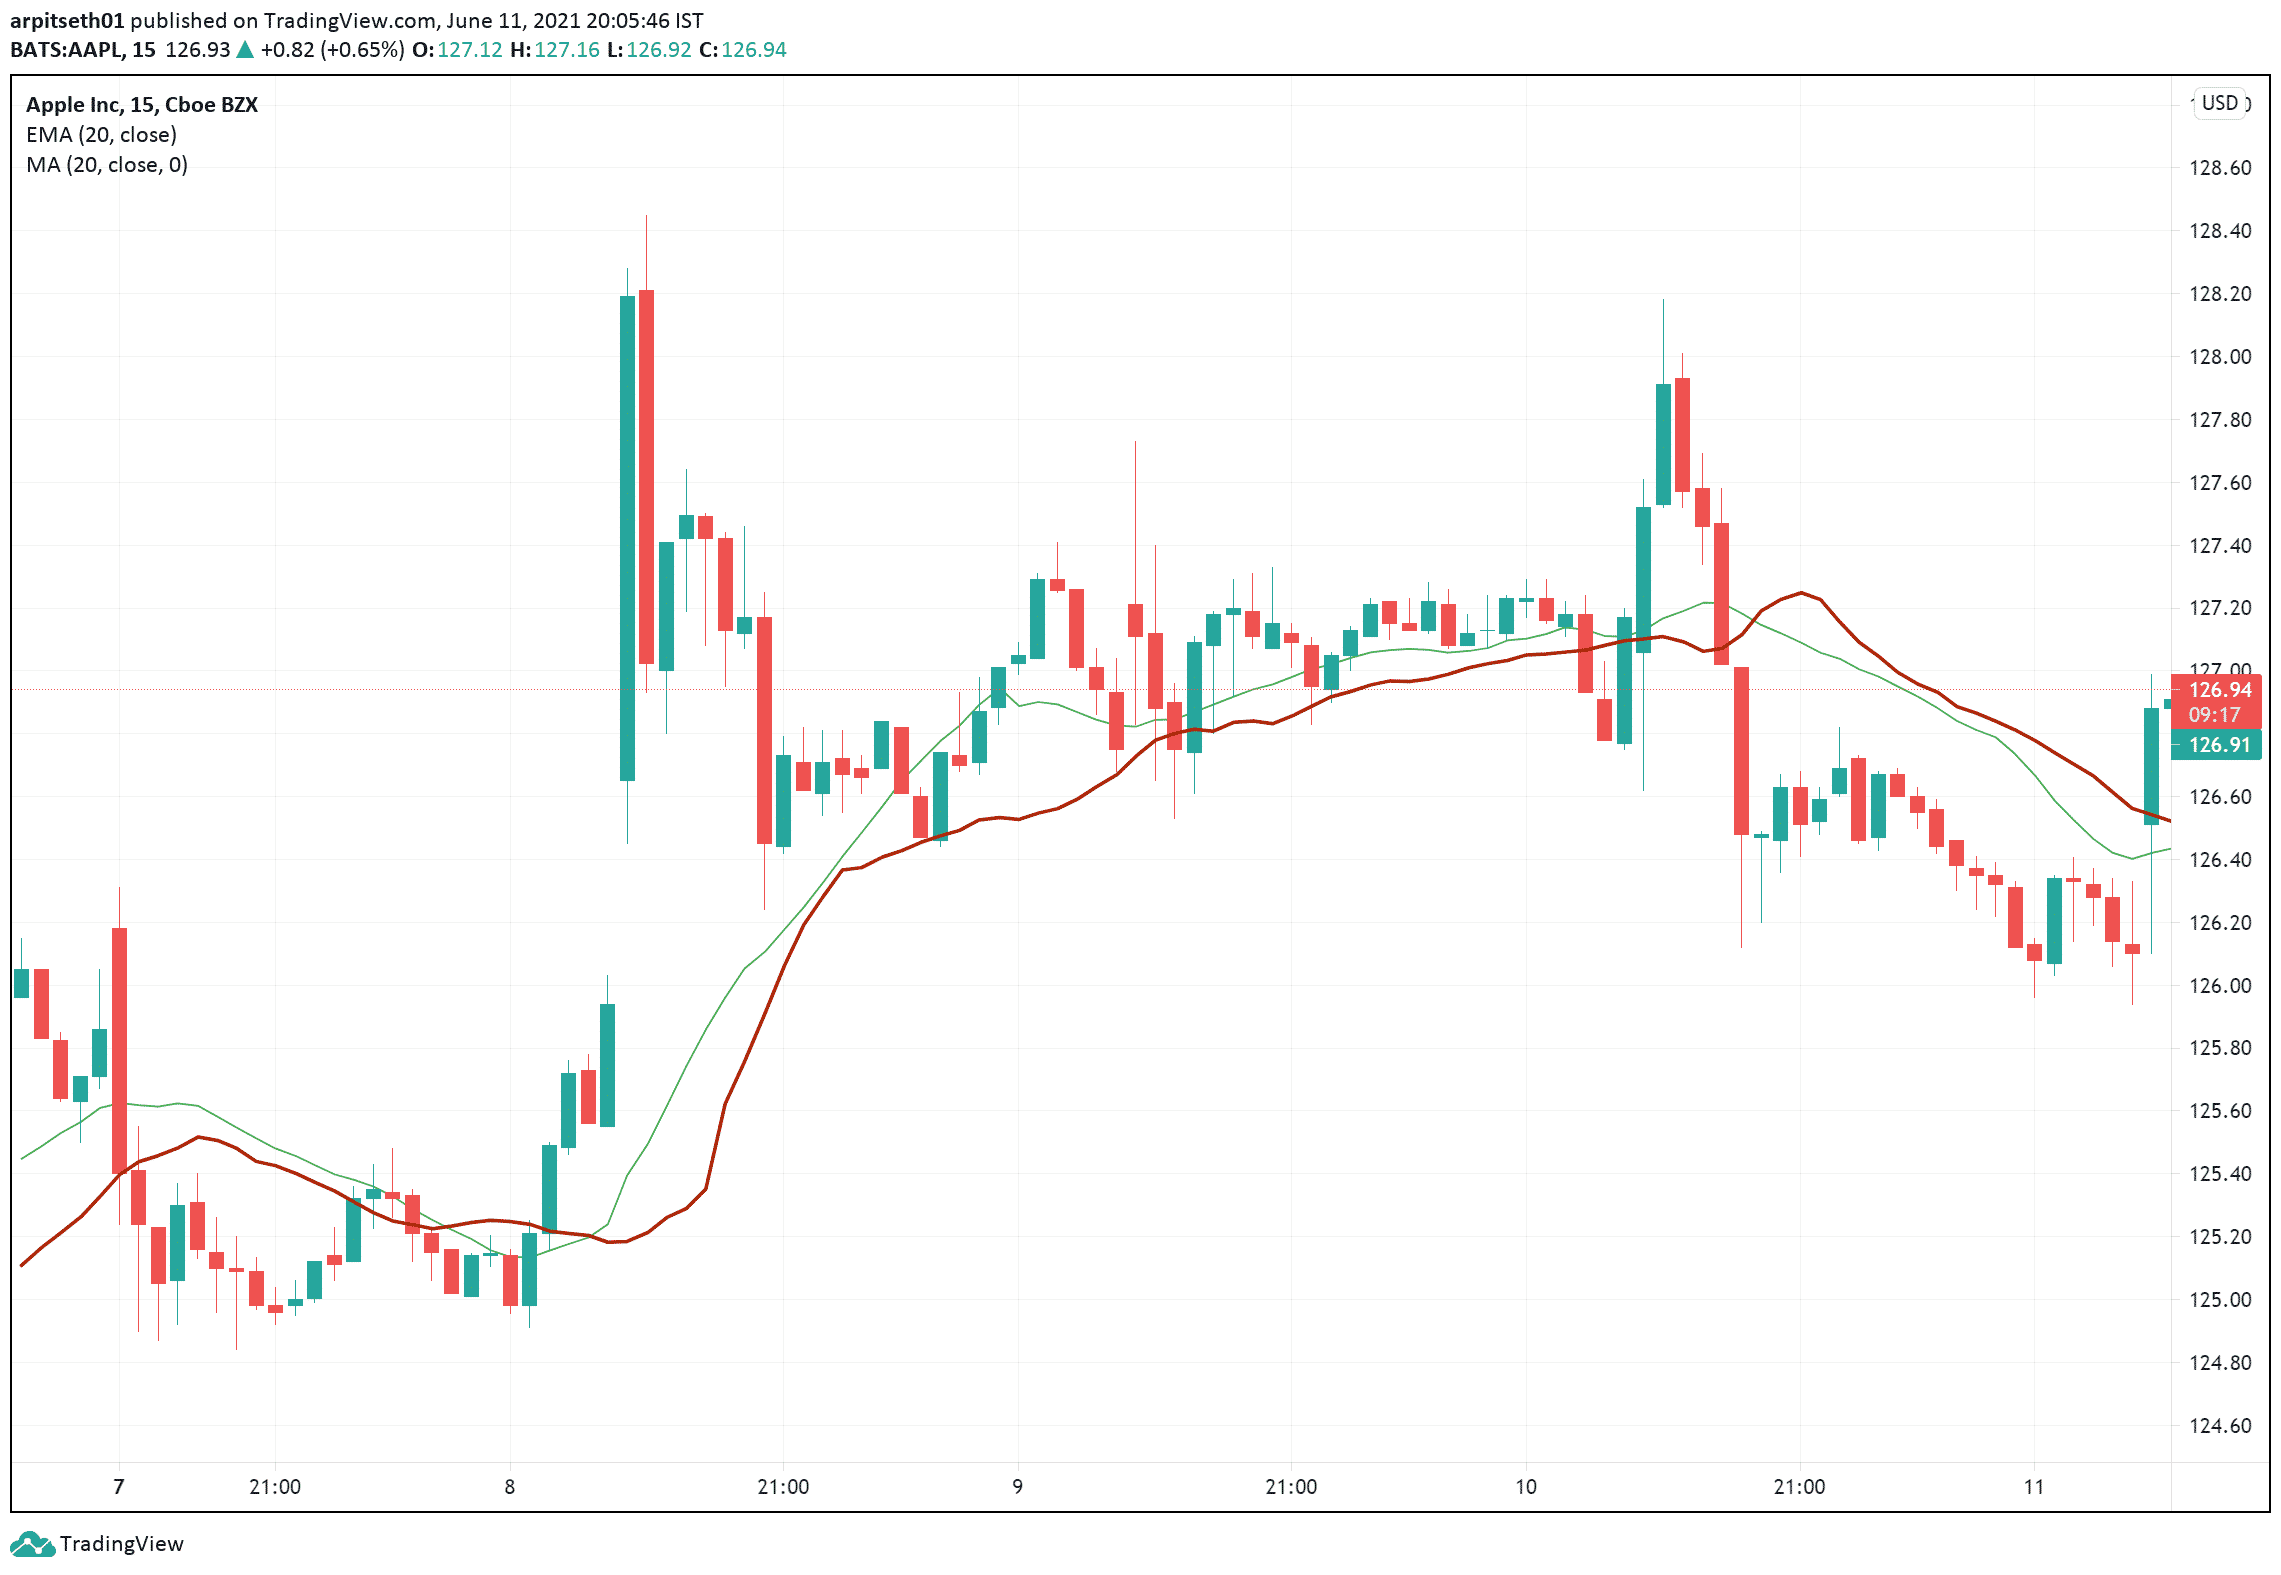
Here is the 15-min chart of Apple and I have plotted the 20 EMA (In Red) and the 20 SMA (In Green).
As you can see, the EMA (Red) line is more responsive to the price and the change is quicker compared to the simple MA line.
The EMA also forms a better resistance & support zone when compared to the SMA which lies at the middle, as it is the average depiction of the price.
Due to these reasons, some traders prefer to use the EMA over the SMA as it is more responsive and provides a moderately better outlook of the trend.
How To Use Moving Averages
Moving averages have 3 main applications, they are as follows:
To get buy and sell signals
Moving average crossover trading
Interpreting support & resistance levels.
Using Moving Averages As Buy and Sell Signals:
Although moving averages are considered as a “Lagging Indicator”, they can still be used to confirm the entry and exit points for a trade.
Let’s look at an example of 14-day simple moving average on the chart of Microsoft.
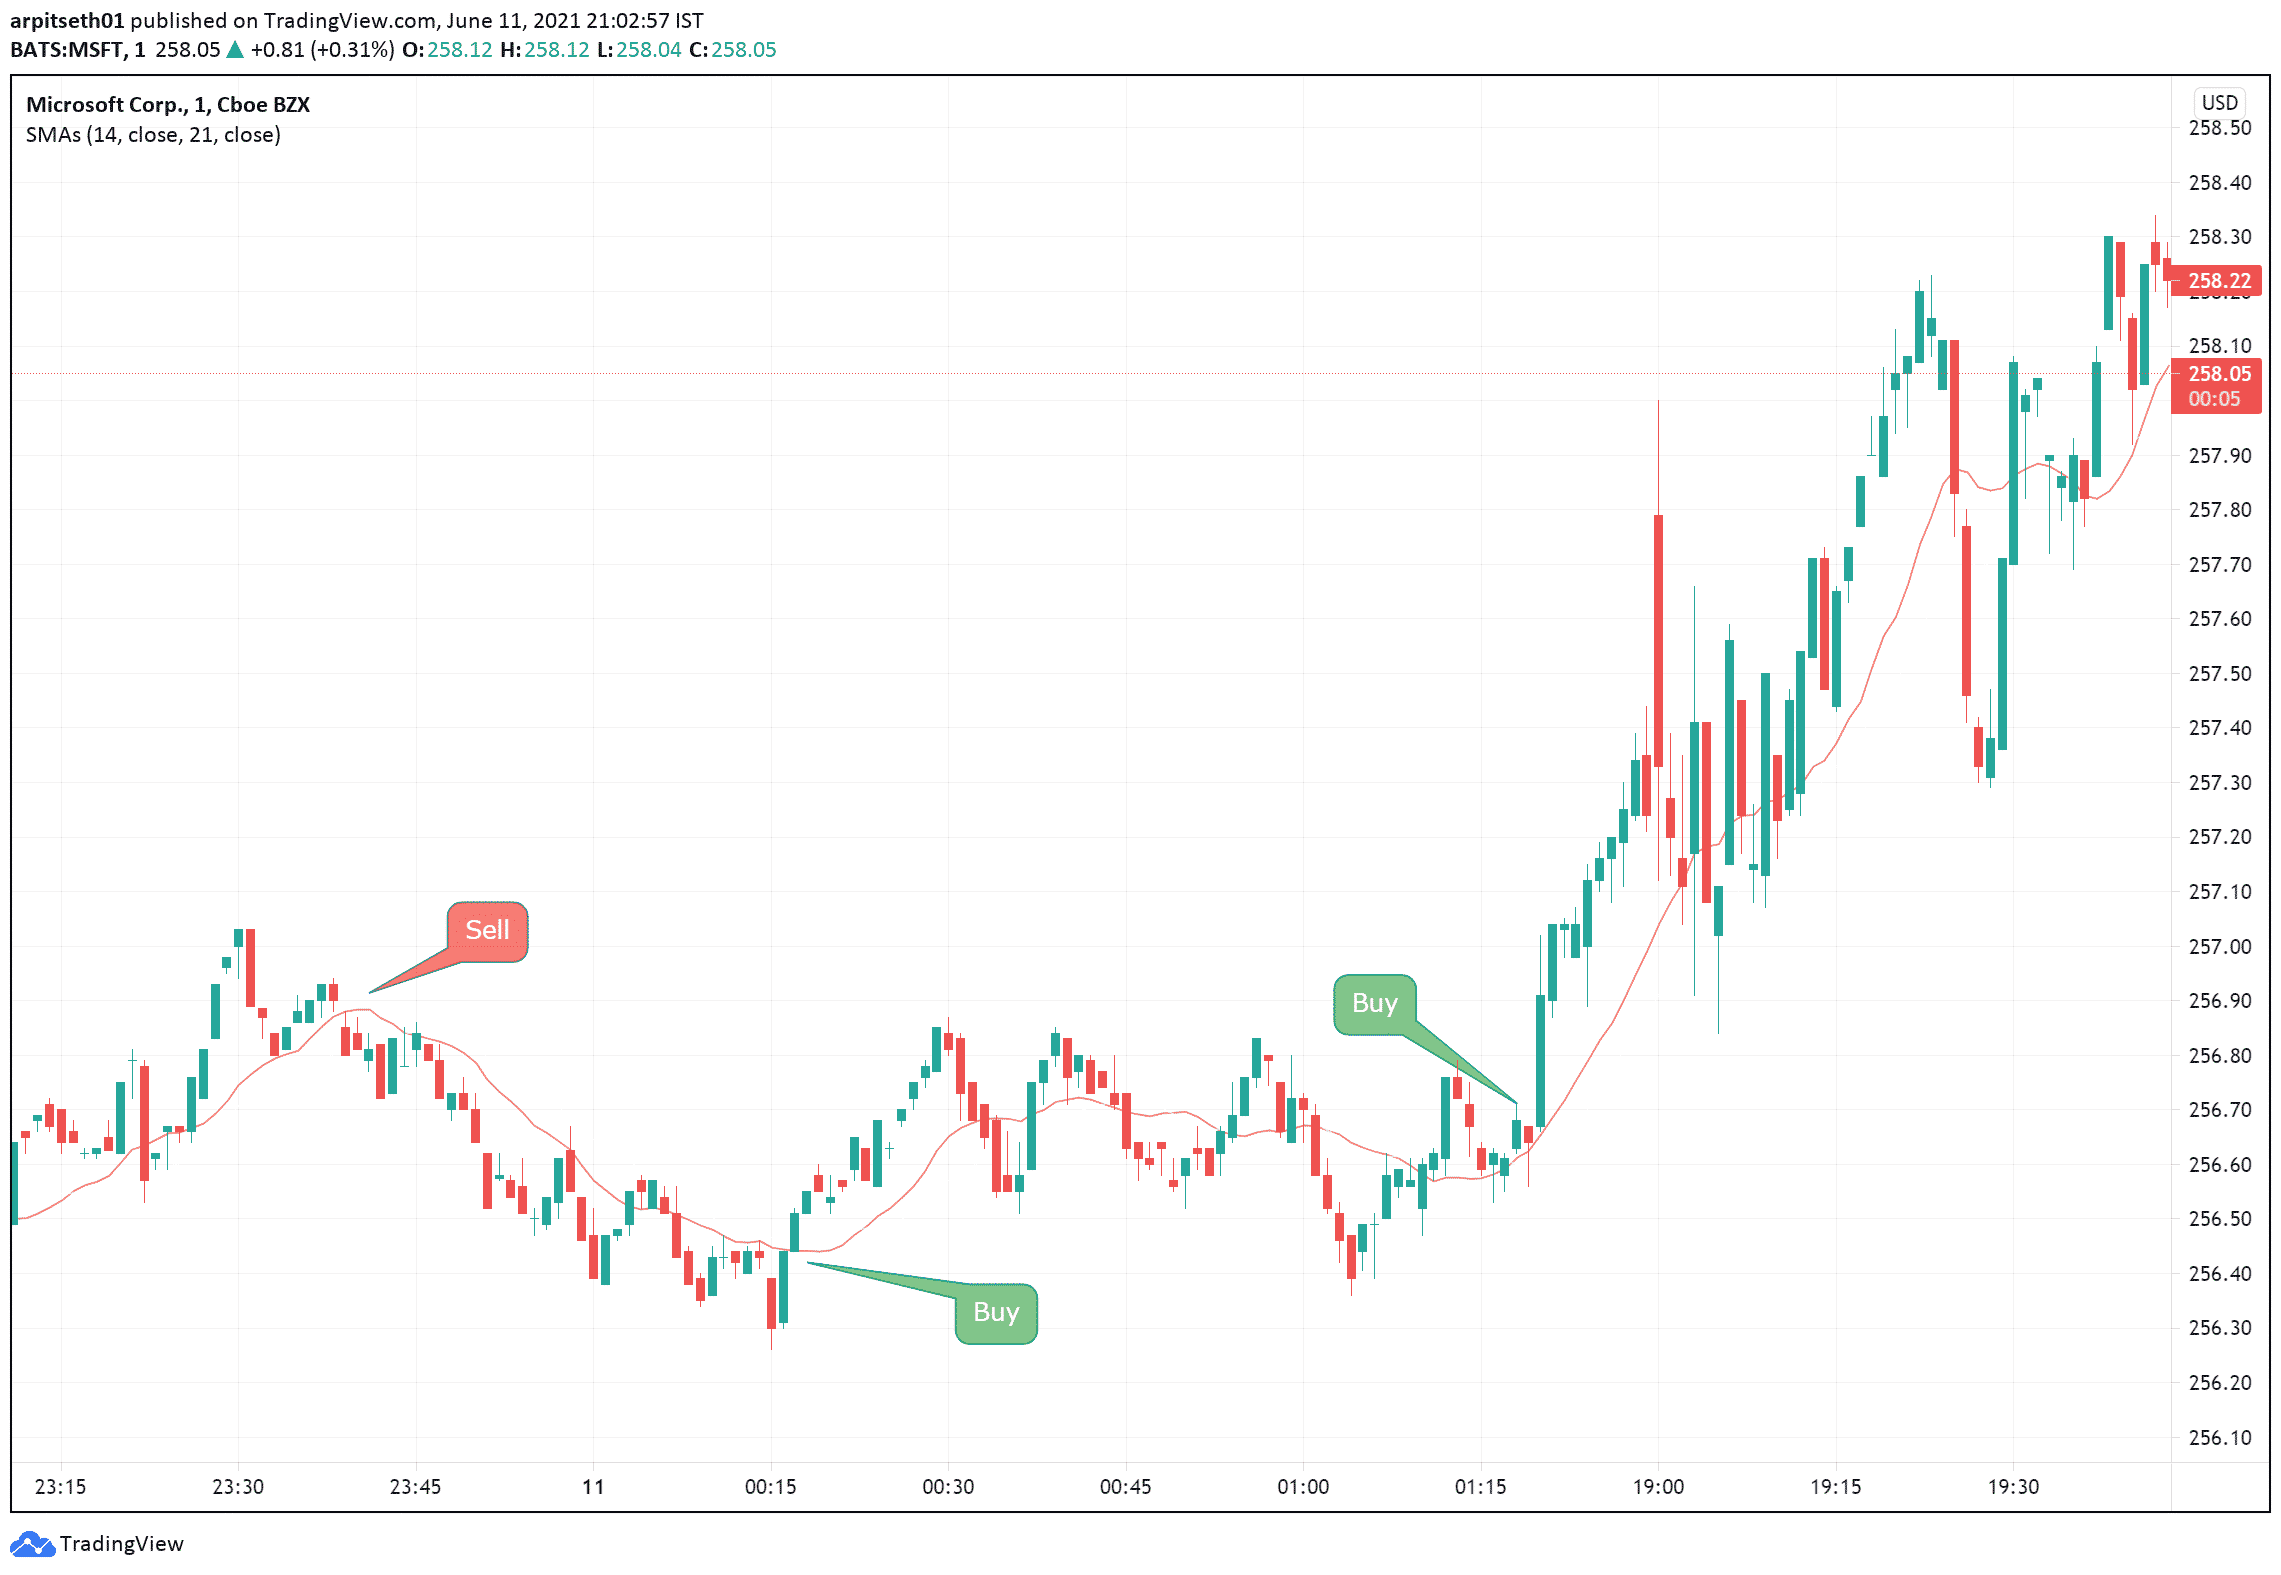
In the above 1 min chart of Microsoft Corporation, the 14 SMA is plotted in red.
The MA is looked at as a baseline and traders define the trend by looking at the price in respect to the MA.
If the price trades below the MA, then it is denoted as a downtrend.
Similarly, If the price trades above the MA, it is considered as an uptrend.
In this way, moving averages can be used as an indicator to go long or short.
Traders should combine a moving average strategy with other technical indicators to find the best entry points.
Many buy and sell signals can be traded when using the SMA in the above scenario which turned out to be profitable.
Moving Average Crossover Trading;
In this type of trade, 2 moving averages are potted simultaneously on the chart to get a clear confirmation before executing a trade.
For example, a 14 SMA and a 21 SMA can be used together to obtain a clear picture of a trend.
This prevents traders from entering a trade in a sideways market.
Mentioned below is the chart of Tesla, plotted with 14 & 21 SMA to explain how moving average Divergences/Crossover work.
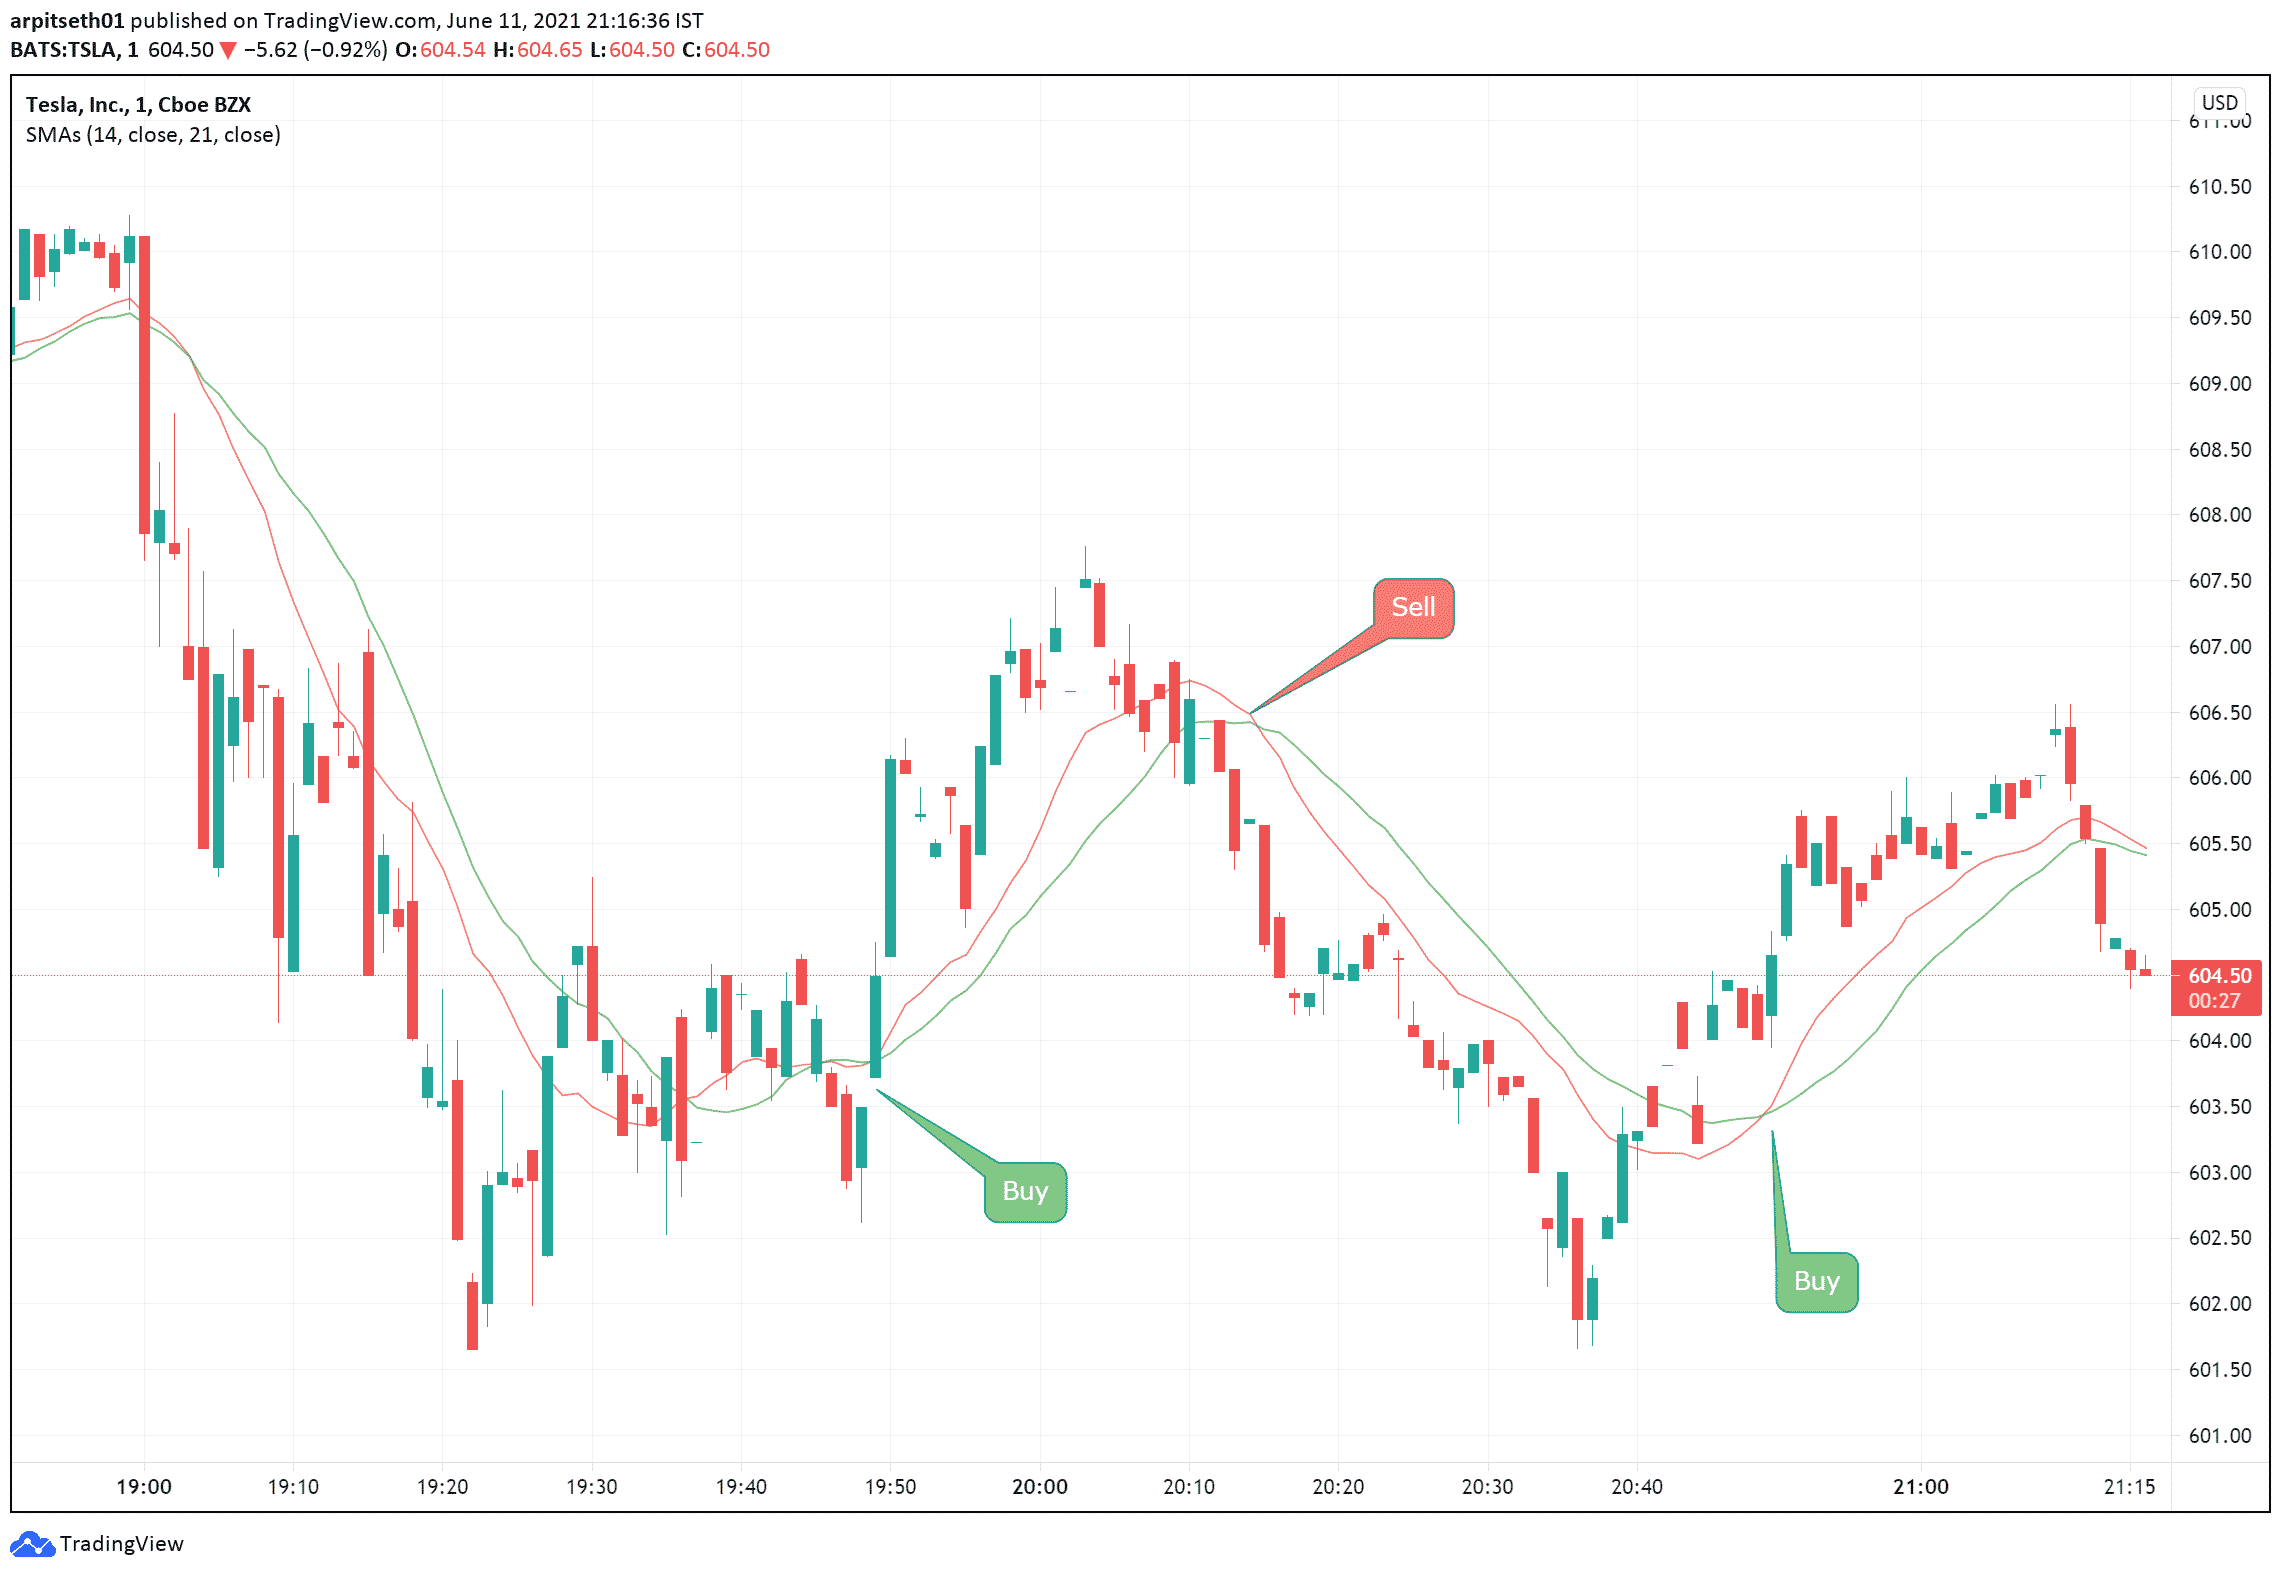
As seen above in the chart of Tesla, the 14 SMA is plotted in red, and the 21 SMA is plotted in green.
Whenever the 14 MA crosses the 21 MA and lies significantly higher, it is a clear buy indication.
On the other hand, when the 21 SMA crosses the 14 SMA on the lower side, it can be a direct selling indication.
As seen on the chart, whenever a crossover happens, a trend reversal is witnessed immediately.
Identifying Support & Resistance Levels:
Moving averages are also treated as support or resistance zones until they are broken.
Usually, a higher denomination of MA is used to identify supports & resistances.
For example, 50, 100 or 200-day moving averages are used to determine the long-term support of stocks.
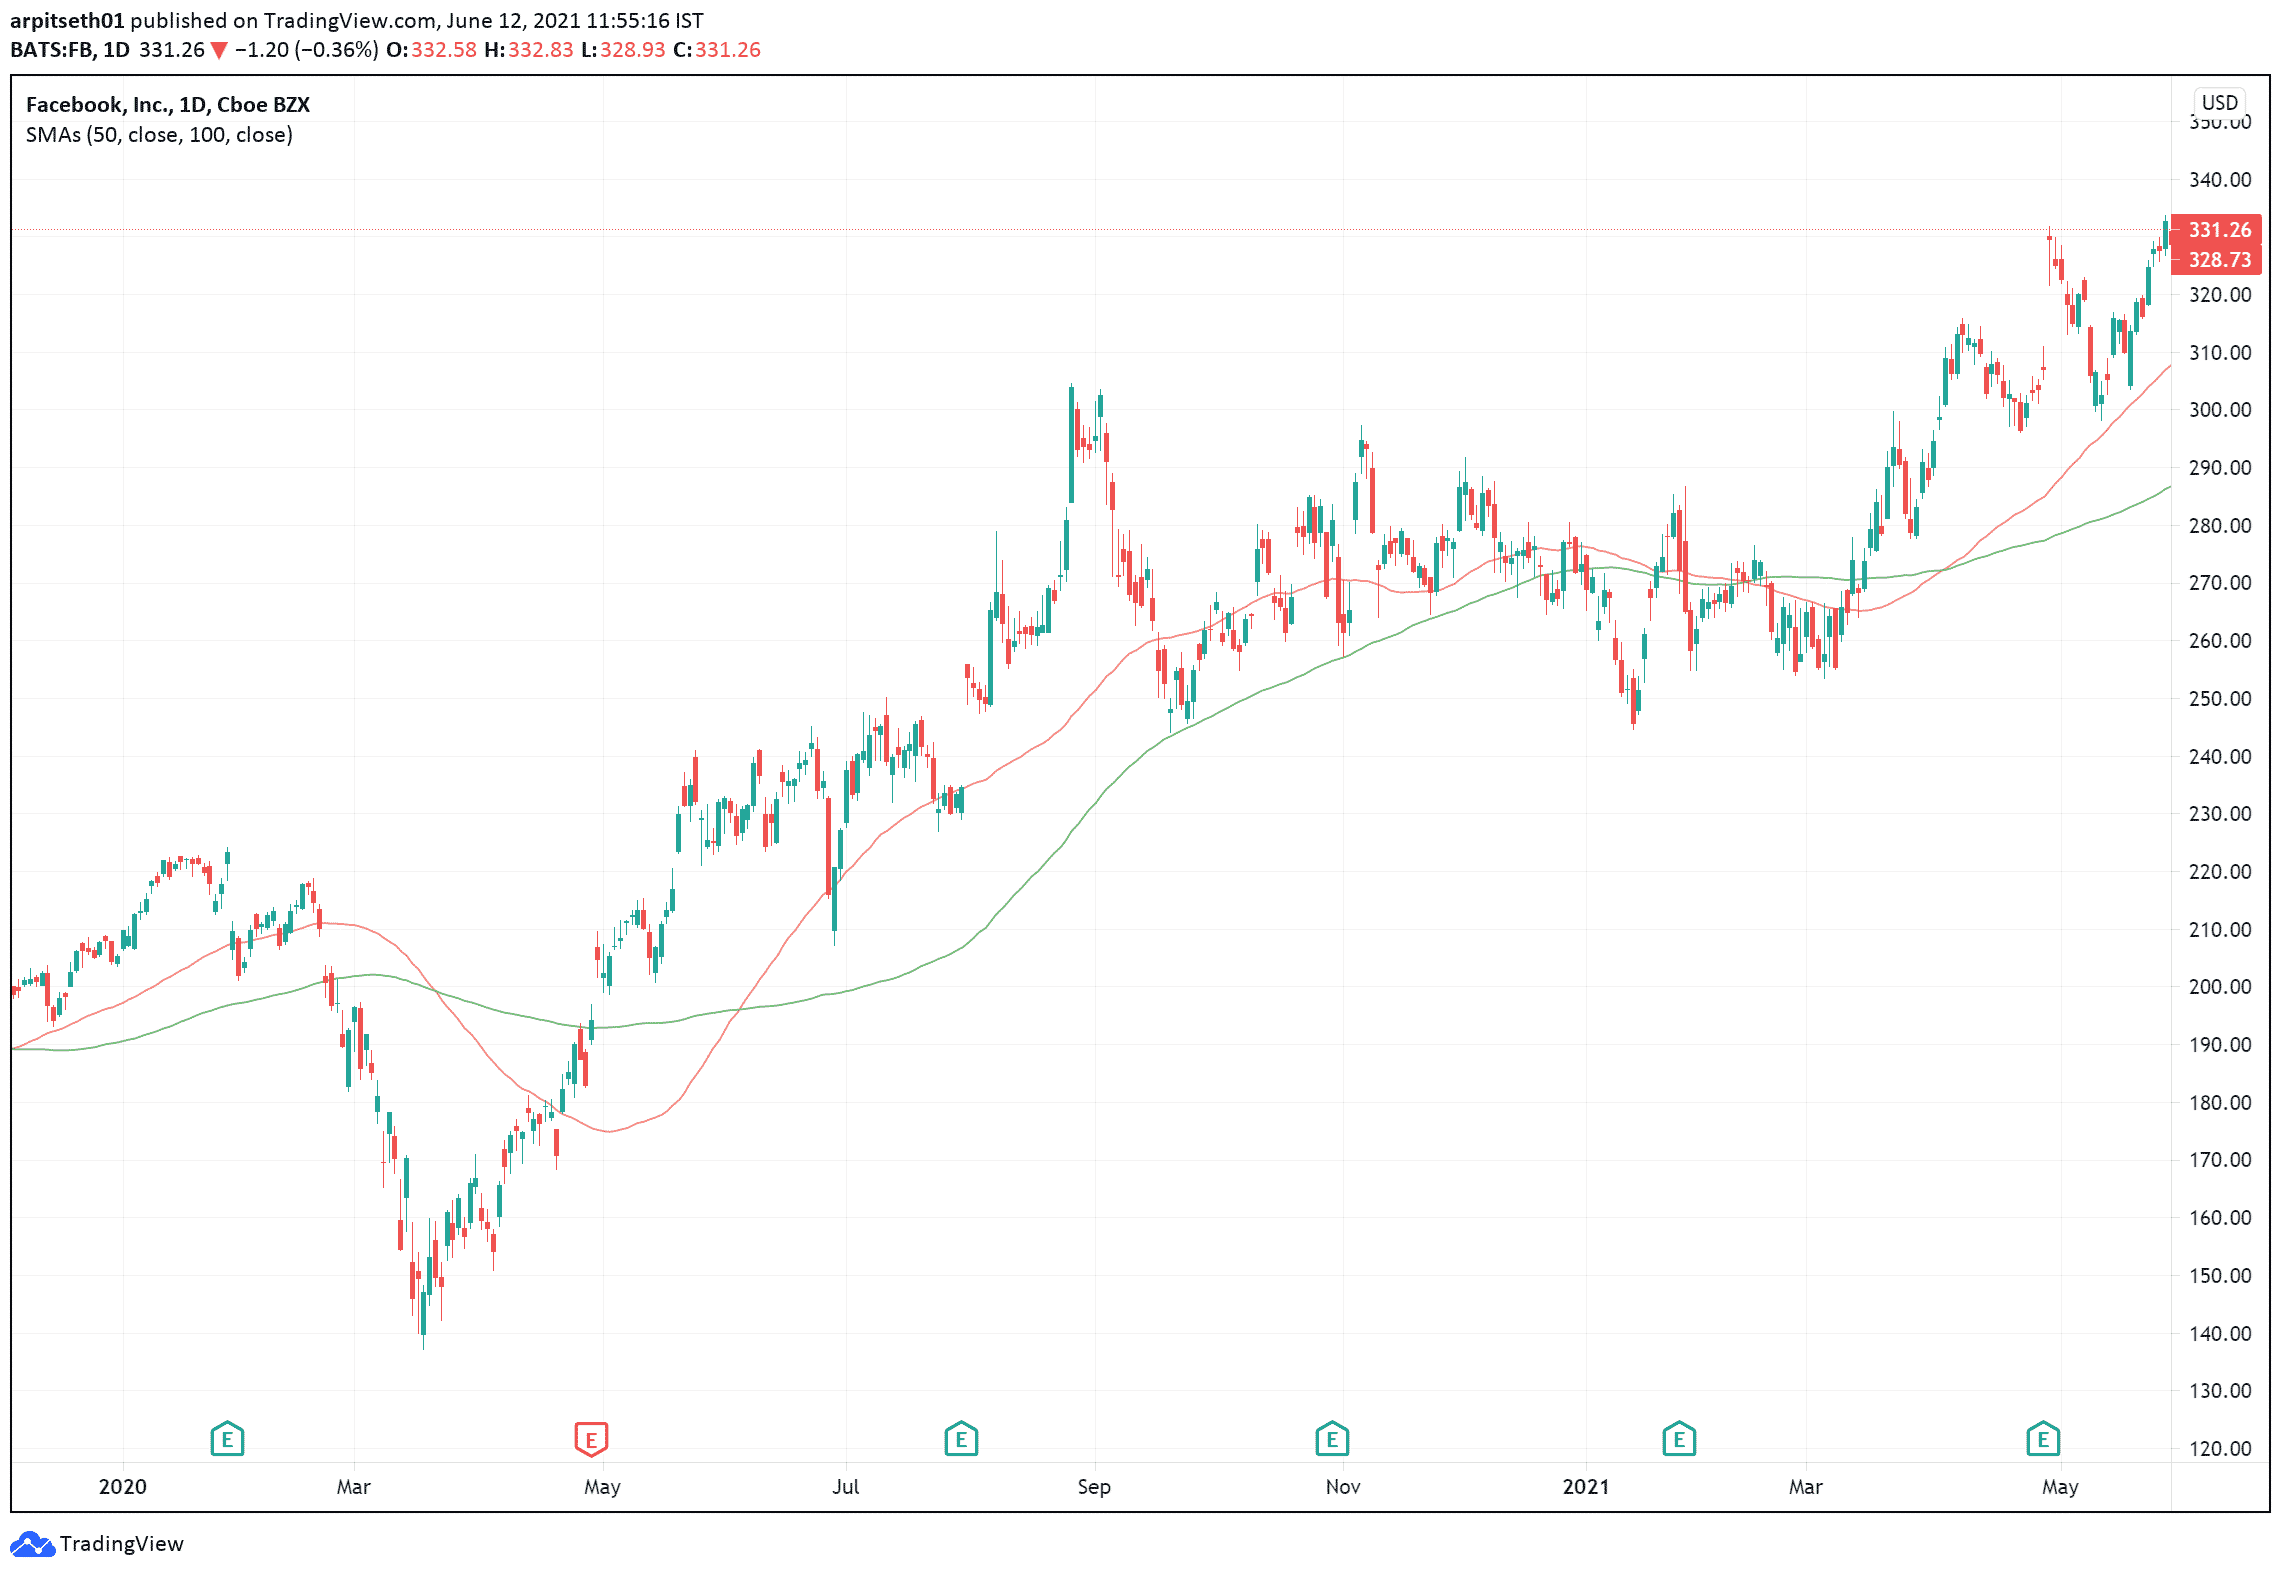
Here is the daily chart of Facebook (FB) with the 50 and 100 simple moving average (SMA) plotted in red and green.
The 50 SMA which is shown in red depicts the short-term trend of the stock and the 100 SMA in red shows the long-term trend of the stock.
Observe how the stock moved from a downtrend to an uptrend in May 2020, as it crossed the 100 SMA.
Best Moving Average for 1 Minute Timeframe.
There are no rules as such about which moving average to choose when trading on a particular time frame.
Although the shorter moving averages like the 7 SMA or the 14 SMA will be more useful as they are more sensitive to price changes.
This makes them ideal to use on a smaller time frame (1,3,5 minutes chart).
As the 7 & 14 EMA are more sensitive, the lagging effect will be reduced to a certain extent.
The best moving average to use is the 7 or 14 exponential moving average (EMA) as it is more responsive to price fluctuations when compared to a simple or smooth moving average.
Whenever the price crosses the moving average on the upper side, it simply means that the buyers are willing to pay more than the average price for that stock.
This is also another indication to go long.
The downside of using an EMA is that it will provide more buying and selling signals, even in a sideways stock when compared to a simple moving average.
To double-check the trade, you can use 2 Moving averages simultaneously, For example, a 14 EMA/SMA and a 21 SMA/EMA.
Bullish and Bearish Divergence
A Bullish divergence (14 MA crossing the 21 MA on the upper side), can be considered as a confirmation of an uptrend and a long trade can be initiated.
Likewise, when a Bearish divergence occurs (21 MA crossing the 14 MA on a lower side) is seen as an opportunity where a short trade can be initiated.
Let’s look at a practical example of trading with 14 EMA and 21 EMA on “Apple”.
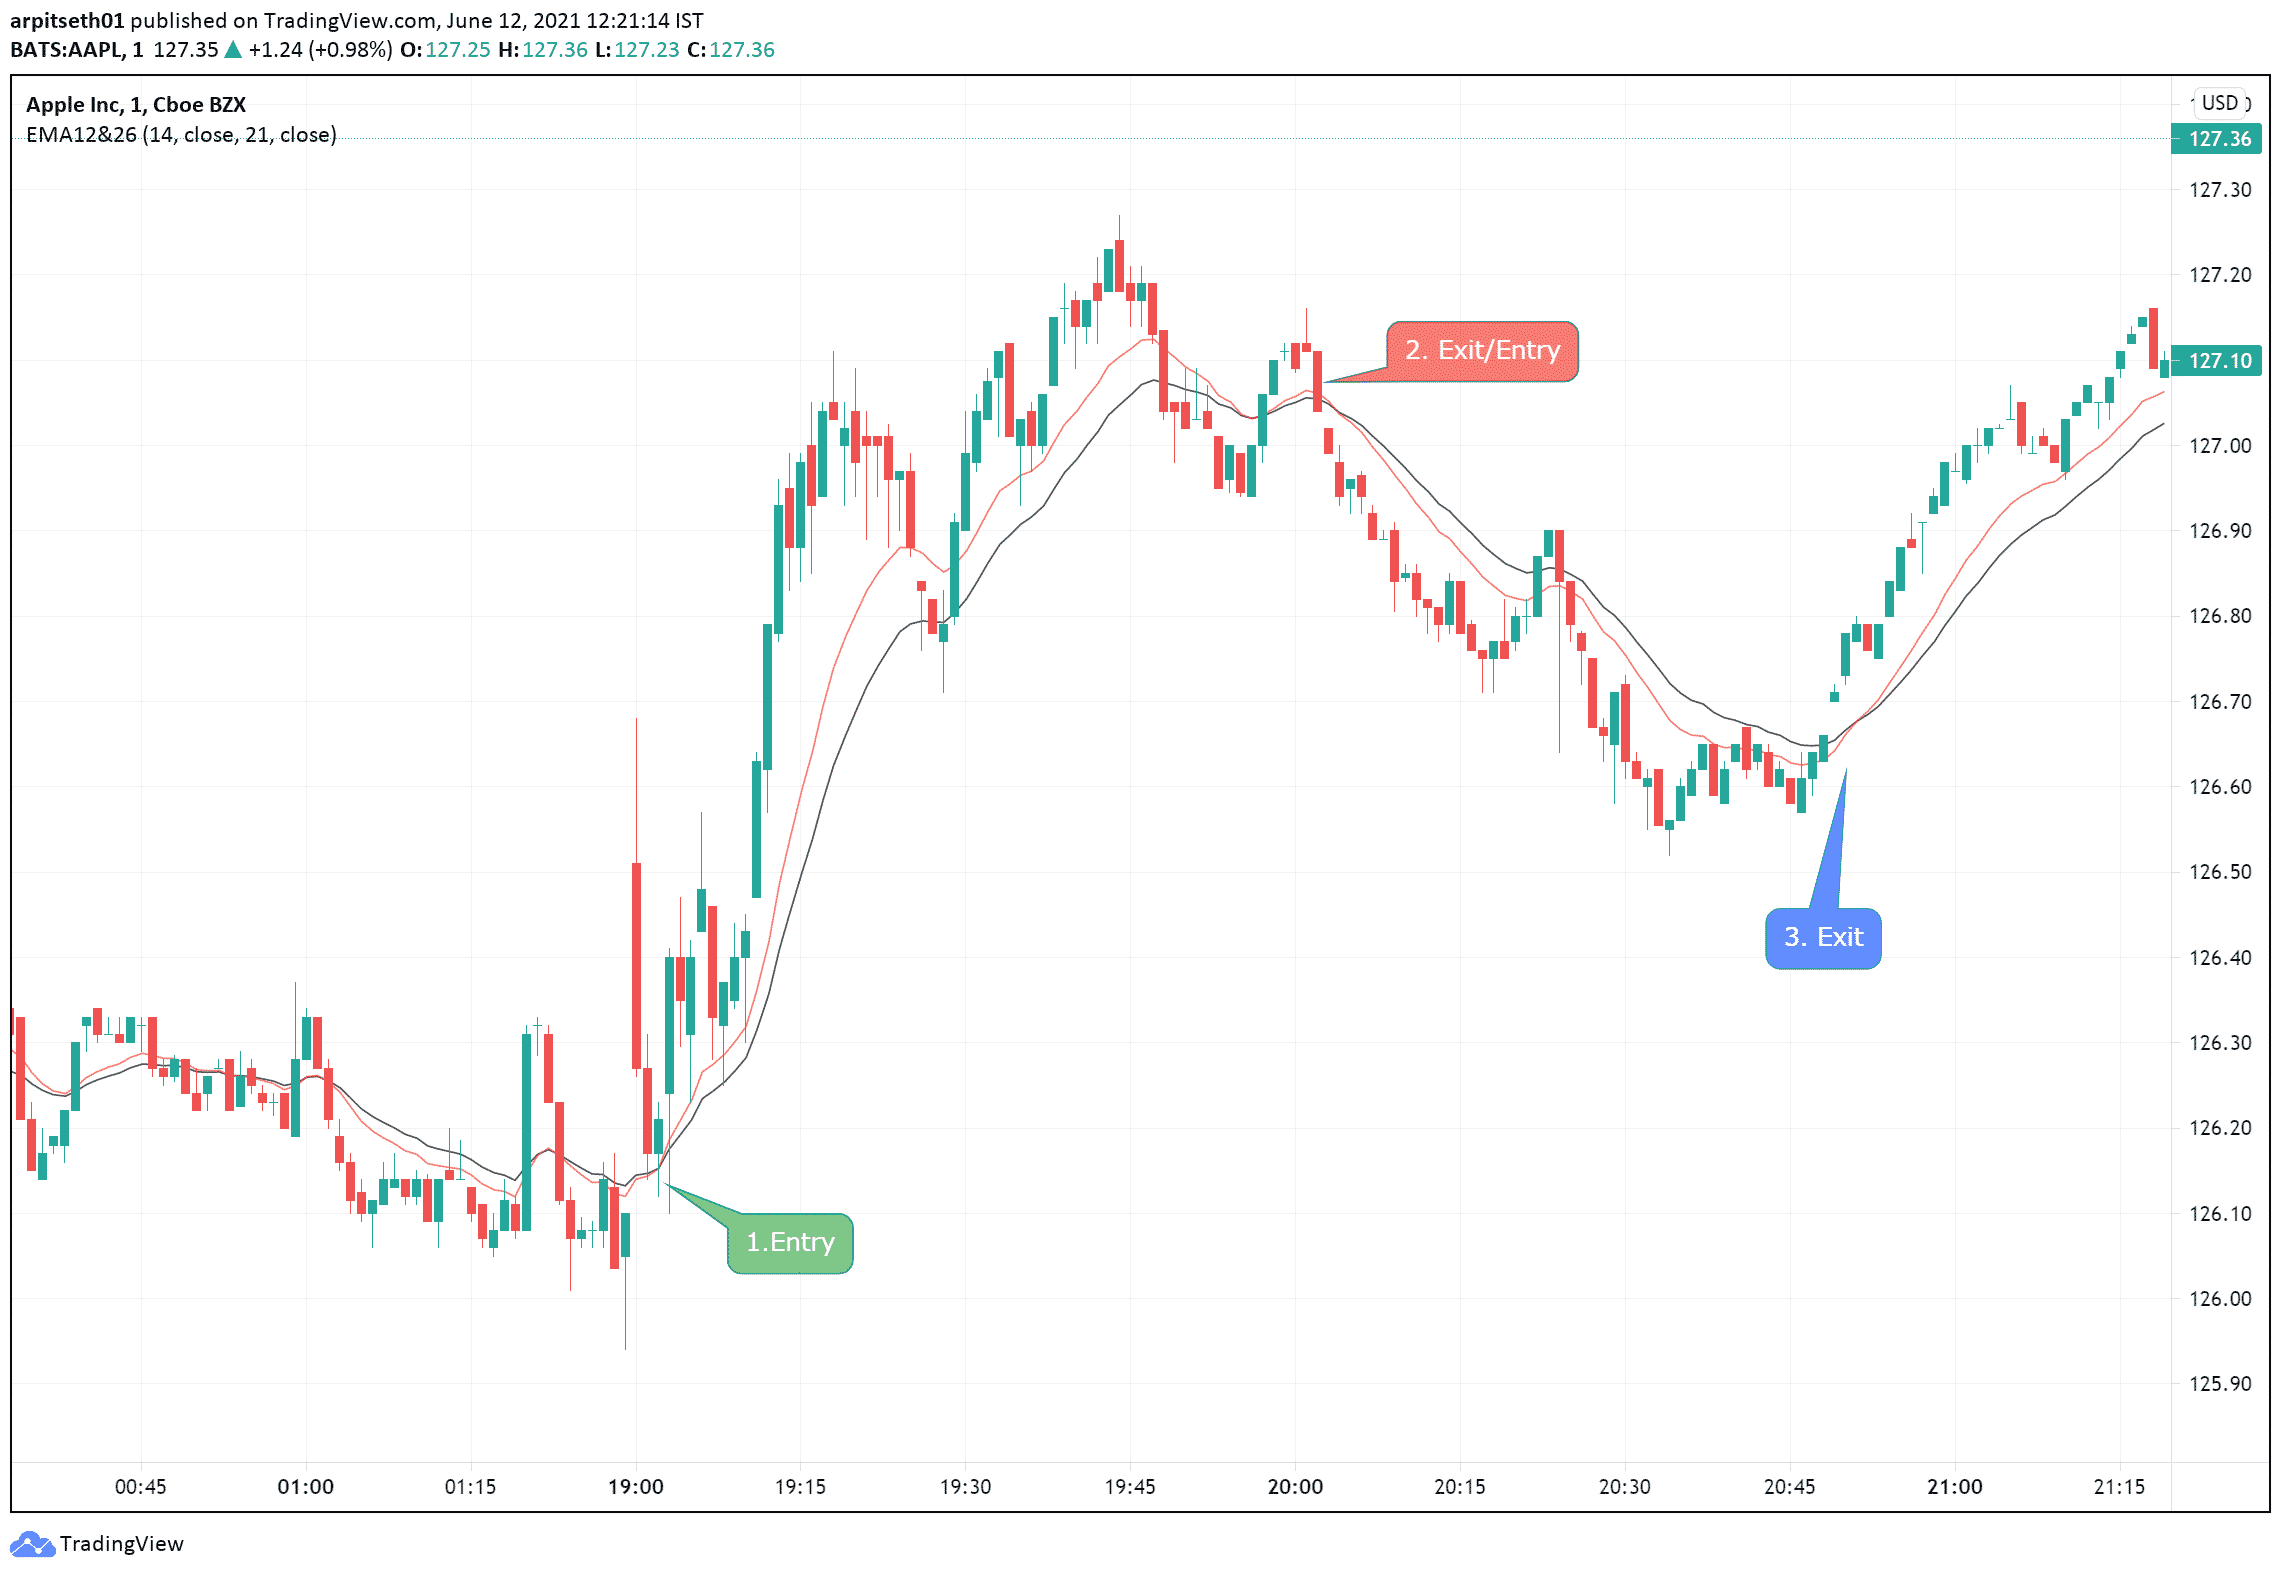
In the following chart, the 21 EMA is plotted in black and the 14 EMA is plotted in red.
Before the actual entry, the moving averages were close to one another which does not define an entry point.
But at 19:05, when the 14 EMA crossed the 21 EMA, it confirmed a bullish cross, and that was an entry to go long.
Similarly, when the 21 EMA crosses the 14 EMA at 20:00 it indicates a bearish cross, which is a short signal.
After the bearish divergence at Point 2, the position should have been squared off at point 3.
When the bullish cross occurs at 20:50 and the price starts to trade above both moving averages.
Using two moving averages provides another added advantage.
At 19:30 the price went below both the MA, but a cross did not occur in the moving averages, which is an indication to remain in the trade.
Due to this you could make better returns by exiting a trade only after a cross of the moving averages.
Some points to remember while trading using Moving Averages:
– Using standalone Moving averages can generate buying and selling signals even in a sideways market.
– You should trade every long or short signal that the indicator shows as some of them could turn out to be highly profitable trades. This could cover the cost of some low profit or loss-making trades.
– While using moving averages in the smaller time frame, you must use a smaller denomination of averages, ranging from 7 to 35. Anything above this can have a significant lag effect while indicating a trade.
– Try to look at the stock/index on a higher time frame while plotting a higher MA (50 to 200) to determine the trend when initial a positional or swing trade.
– Exponential moving averages (EMA) work better in lower time frames as it is more responsive to price fluctuations.
FAQ
What Is A Moving Average?
A moving average is a technical analysis indicator used to smooth out price action and identify trends.
It is calculated by taking the average price of a security over a specific period of time, with the period being determined by the trader’s preference.
What Is The Best Moving Average For A 1-Minute Chart?
The best moving average for a 1-minute chart depends on the trader’s strategy and personal preference.
Some popular options include the 20-period exponential moving average (EMA), the 50-period simple moving average (SMA), and the 100-period SMA.
Traders should experiment with different moving averages and timeframes to find what works best for them.
How Do I Use A Moving Average On A 1-Minute Chart?
Traders can use a moving average on a 1-minute chart to identify trends and potential entry and exit points.
For example, if the price of a security is above its moving average, it could indicate an uptrend, while if it is below the moving average, it could indicate a downtrend.
Traders may also look for crossovers between different moving averages as a signal to buy or sell.
Can A Moving Average Be Used Alone To Make Trading Decisions?
No, a moving average should not be used alone to make trading decisions.
It is just one tool in a trader’s toolbox and should be used in conjunction with other technical indicators and analysis techniques.
Traders should also consider fundamental factors, such as earnings reports and news events, when making trading decisions.
What Is The Difference Between A Simple Moving Average And An Exponential Moving Average?
A simple moving average (SMA) calculates the average price of a security over a specific period of time and is weighted equally.
An exponential moving average (EMA), on the other hand, gives more weight to recent prices, making it more responsive to changes in price action.
EMAs are generally more popular for short-term trading, while SMAs are better suited for longer-term analysis.
Conclusion:
Moving averages are a great technical analysis tool that is simple to understand and implement in a trading system. moving averages are very versatile and can be customized and used in any time frame and on any underlying assets.
It can also be adjusted and customized according to your needs and strategies.
The combination of moving averages with technical analysis is the best combination you can try.
This can impact your profitability by a huge margin in a positive way.
Trade safe!
Disclaimer: The information above is for educational purposes only and should not be treated as investment advice. The strategy presented would not be suitable for investors who are not familiar with exchange traded options. Any readers interested in this strategy should do their own research and seek advice from a licensed financial adviser.


