


Contents
LiveVol is a data and analytics platform for experienced traders.
It is for traders who already know everything there is to know about the risk graph, the T+0 line, the IV values on the options chain, the Greeks, etc.
They know all this, and yet they still need more data.
More data into the internals and the guts of the options market.
This is where LiveVol comes in.
The “Vol” means volatility, as in options volatility.
Signing Up
The nice thing is that LiveVol is web-based.
Nothing to download or install.
However, signing up even for the 14-day free trial is a somewhat lengthy process.
While it requires a credit card when signing up, it says it will not be charged if you cancel before the trial ends.
Then a lot of legalese to read and fill out.
Ultimately, you must apply your digital signature via their embedded Docusign documents.
And then, they will email you with access information to the software.
I guess since this product is from the CBOE, it needs to comply with all the legal requirements.
LiveVol is designed primarily for options traders.
However, equities day traders can still use its charting, VWAP, and order flow information to gauge directional moves.
Stock Stats
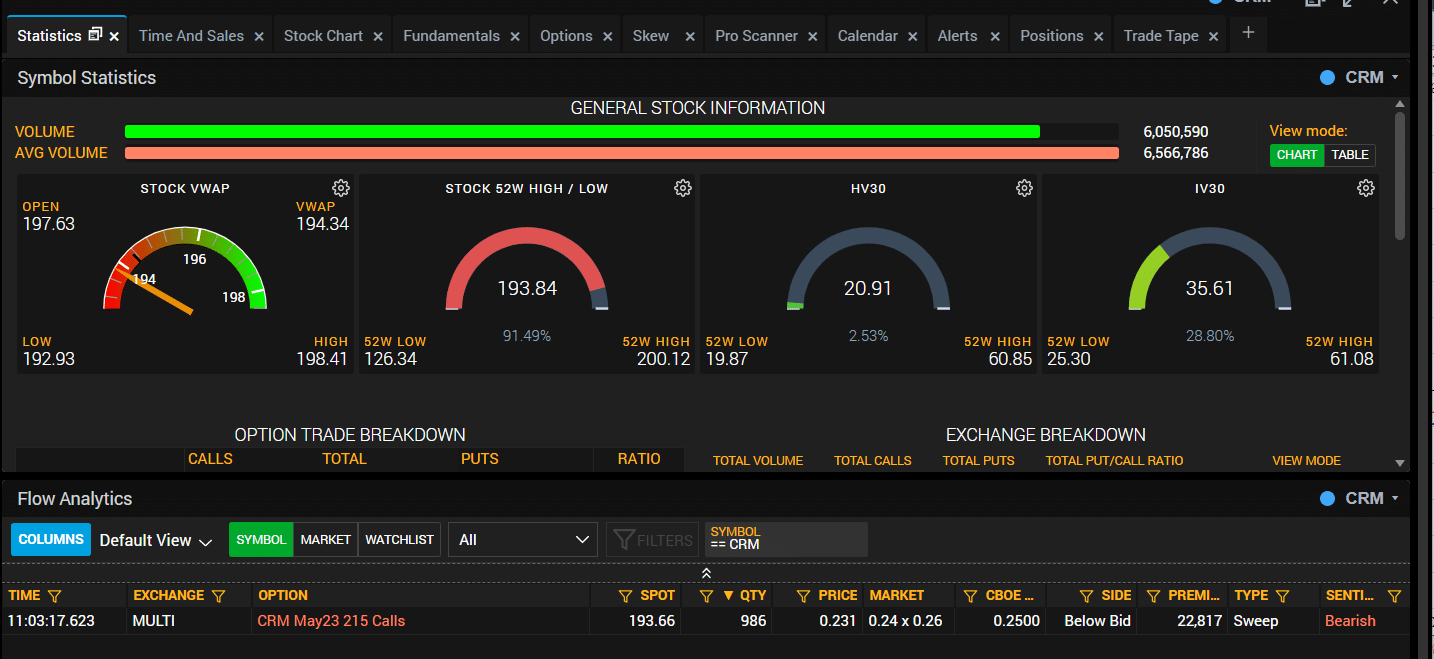
The VWAP display looks like a race-car speedometer.
It’s even color-coded.
Day traders will probably like that.
The Chart
It has all the usual chart types (Candlestick, Heikin Ashi, Reno, etc.) and all the usual indicators.
I’ve turned to the volume profile in the below screenshot.
This is something that not all trading platforms have.
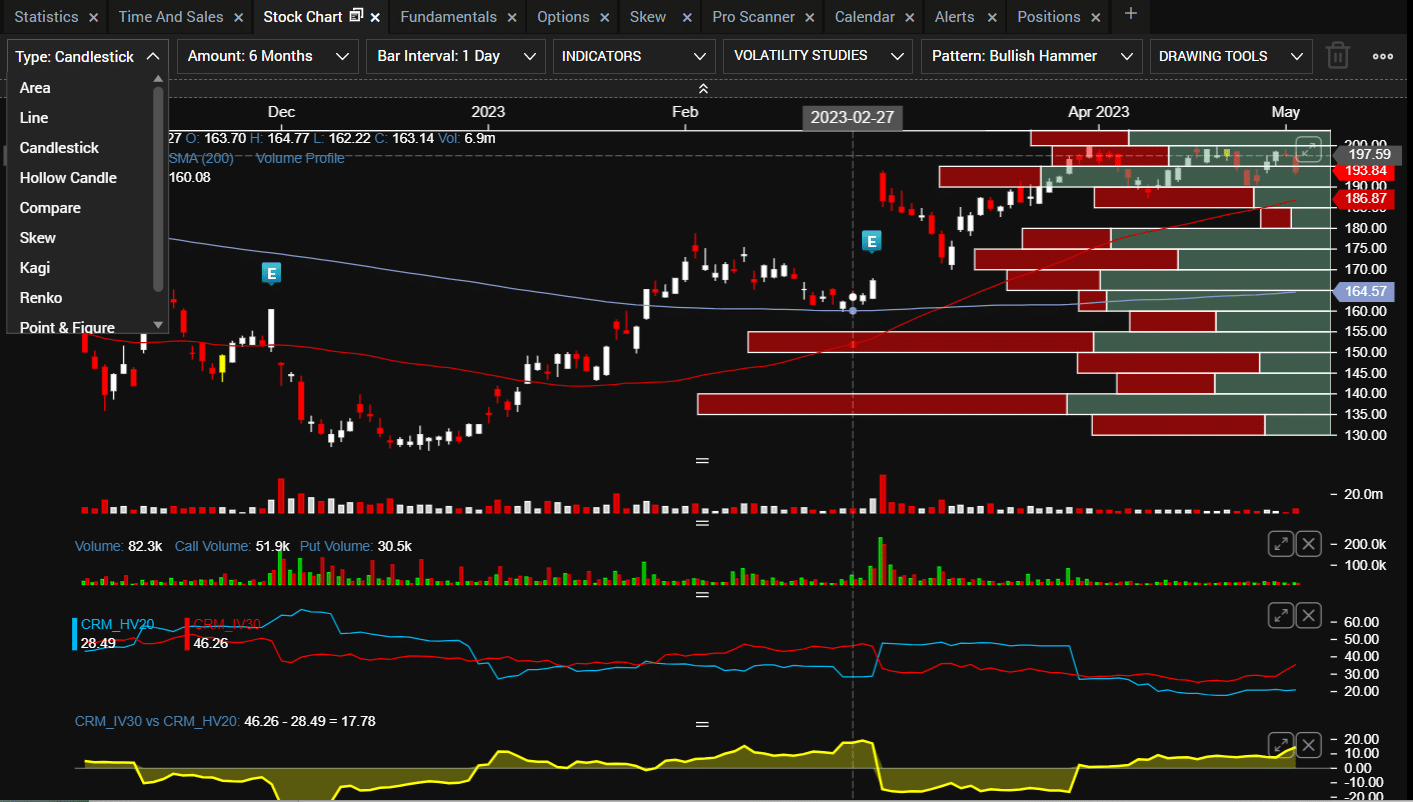
I have specified to LiveVol to highlight all the “bullish hammer” candles in the above chart.
Do you see the yellow candle (near the left side)?
That’s its definition of a bullish hammer, which may not be exactly your definition.
But anyway.
Not too many other charting platforms can find candlestick patterns like this for you.
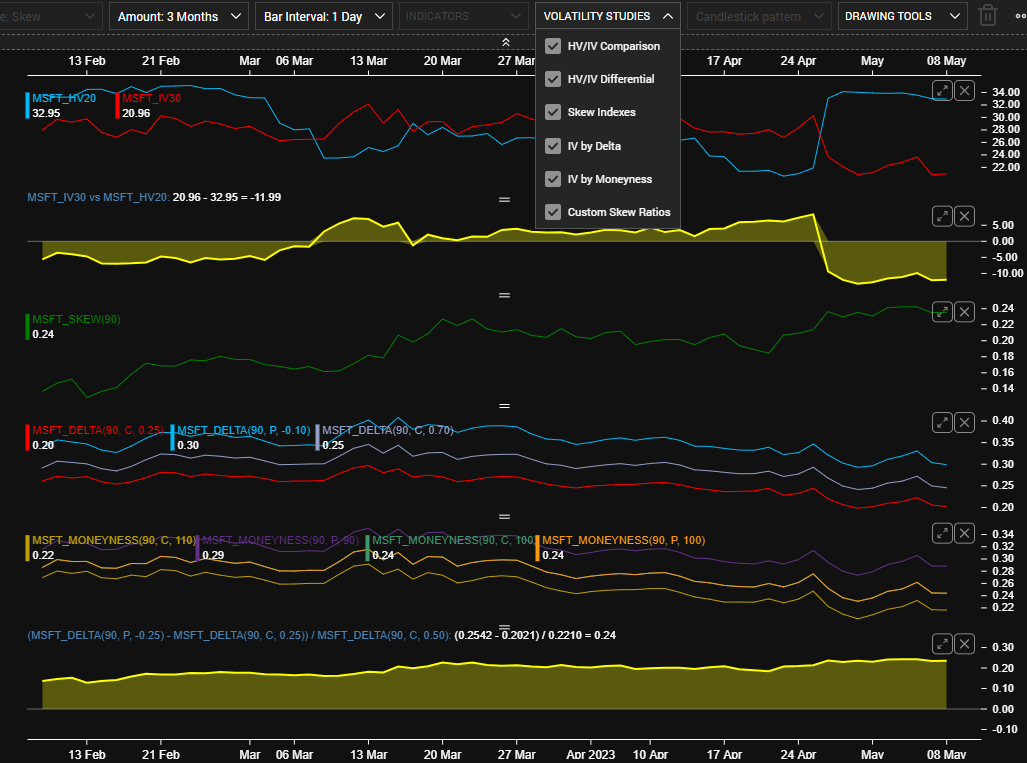
The blue “E” denotes an earnings event.
The lower panel with the red and blue lines shows IV30 (implied volatility) and HV20 (historical volatility), respectively.
See how the IV increases towards the earnings event and drops off afterward.
The panel below that with the yellow line shows the difference between IV and HV.
On February 27, 2023, it showed the spread wide just before the earnings event.
There is another volume bar chart below the normal volume panel.
It has red and green bars.
This is the put and call volumes.
The puts are red, and the calls are green.
Now you know on a particular day whether more puts or calls were traded and by how much.
It is a visual of the concept of put-call ratio.
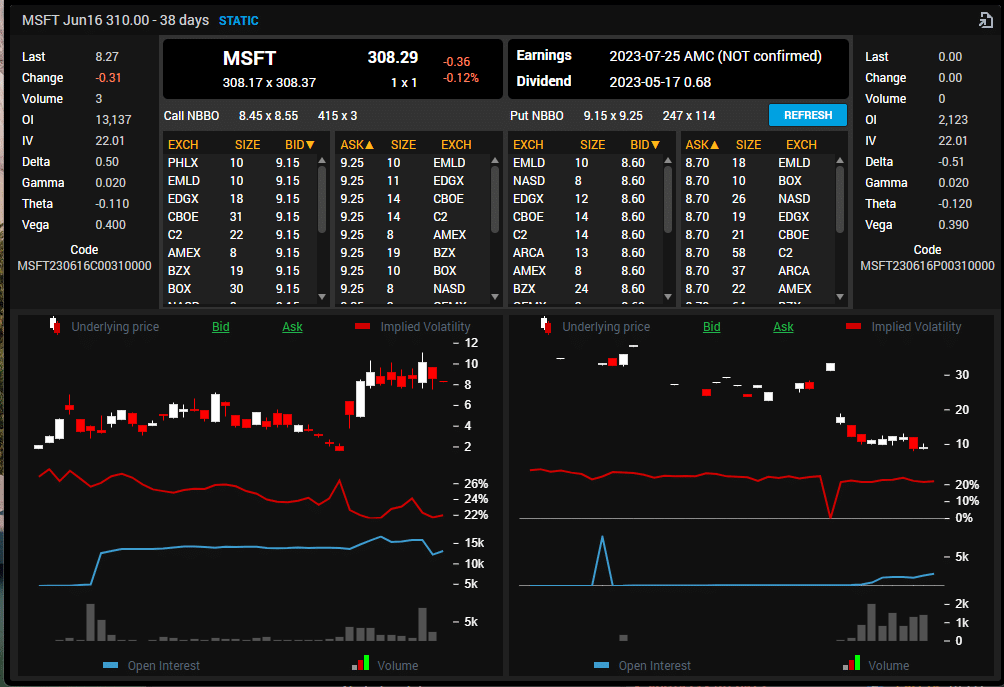
Option Chain
Below is a picture of the option chain.
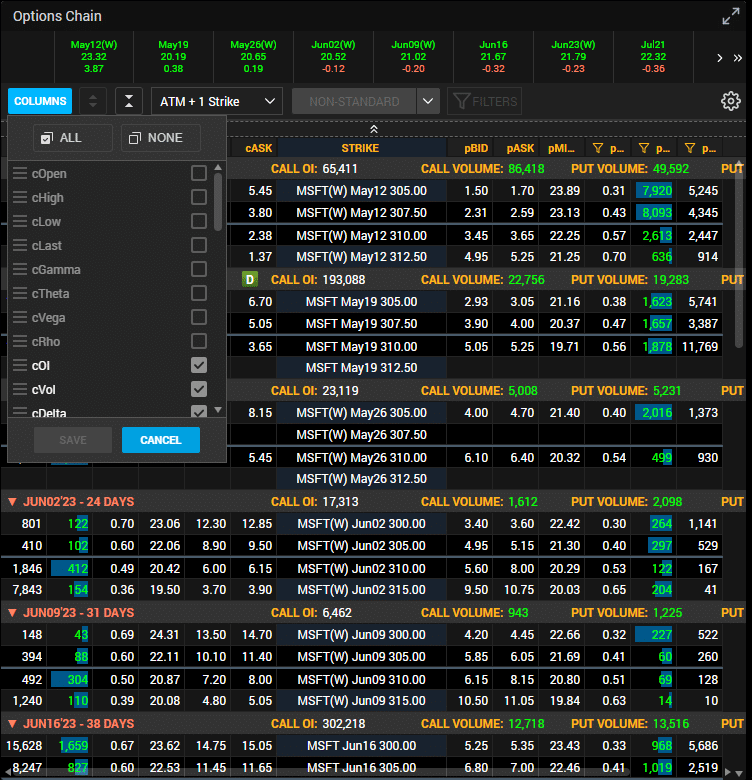
You can set the columns to display various data for the particular option, such as its delta and IV, and so on.
Clicking on an option, you can see more information on that option:
Market Tab
In the Market tab, you see the Trade Tape panel:
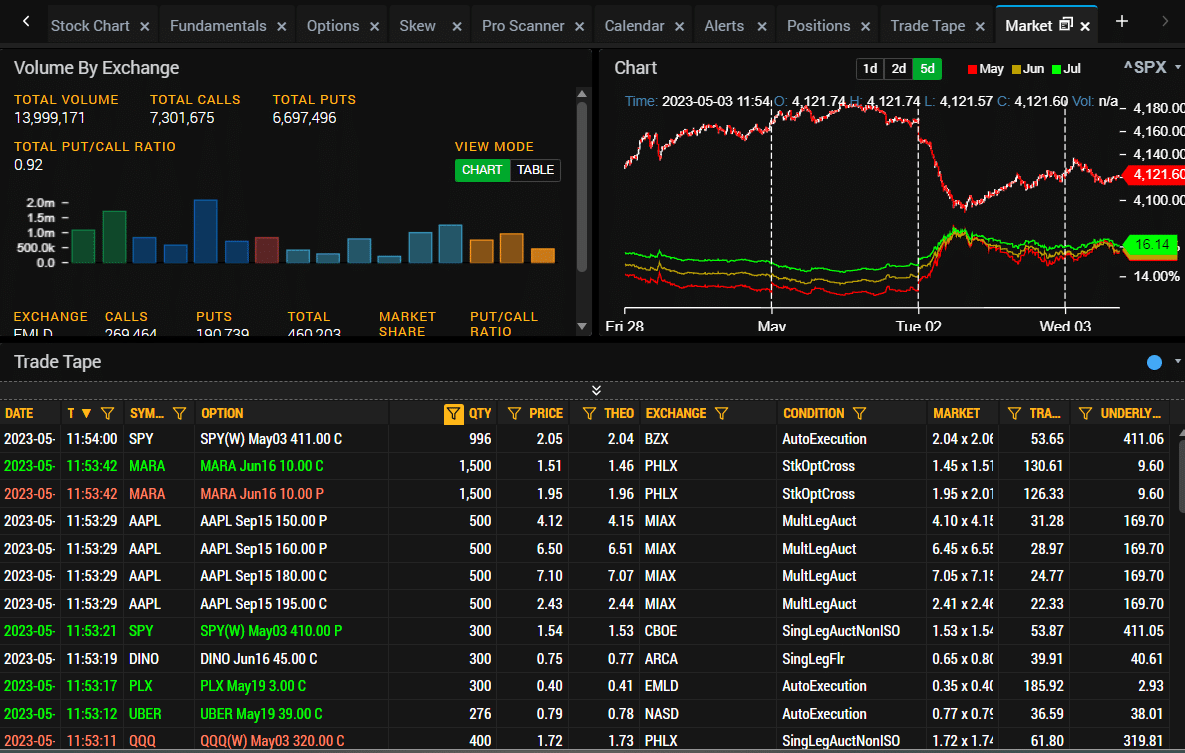
I have it sorted by newest order on top, so I get a running waterfall of trade going through the various exchanges.
Even if someone buys or sells one contract, you will see it here.
Realistically, I only want to see trades by the big players, so I have set the Qty filter to show only those with contract sizes greater than 250.
You can also configure Trade Tape to display the symbols you added to your watchlist.
LiveVol has a WatchList. Of course, it does – where you put in the symbol you are interested in.
In the above screenshot, we see a big order buying a call and selling a put in MARA expiring after the approaching earnings event – someone must be bullish with earnings approaching.
Time and Sales
Under “Time and Sales,” you can see the tick and trade data for a particular symbol on a particular day.
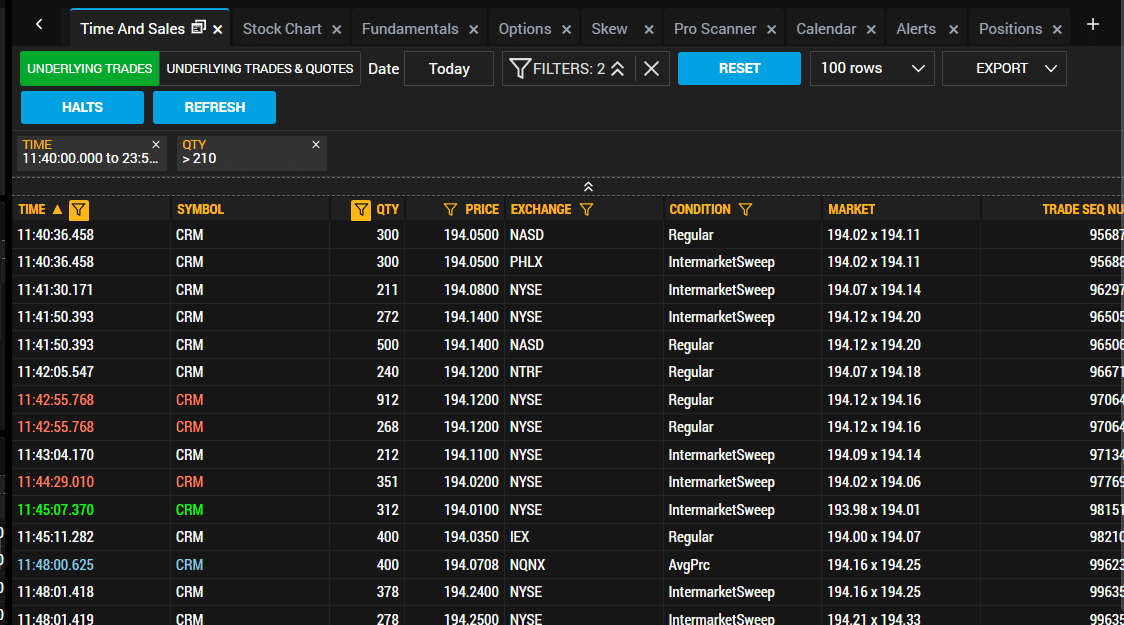
Why would I want to know that?
Well, some people use this information to copy their trade.
If someone is going to trade that big, they probably know what they are doing.
Or at least I hope so.
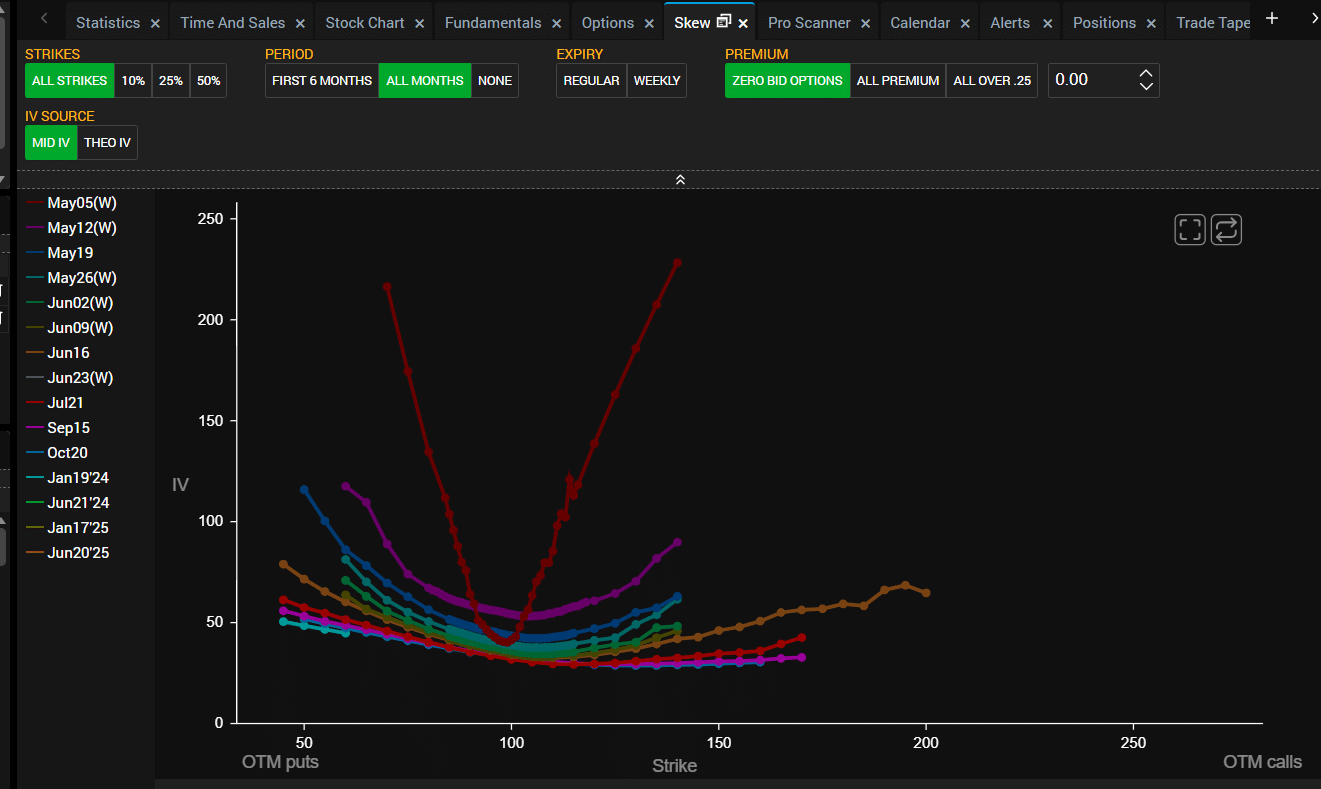
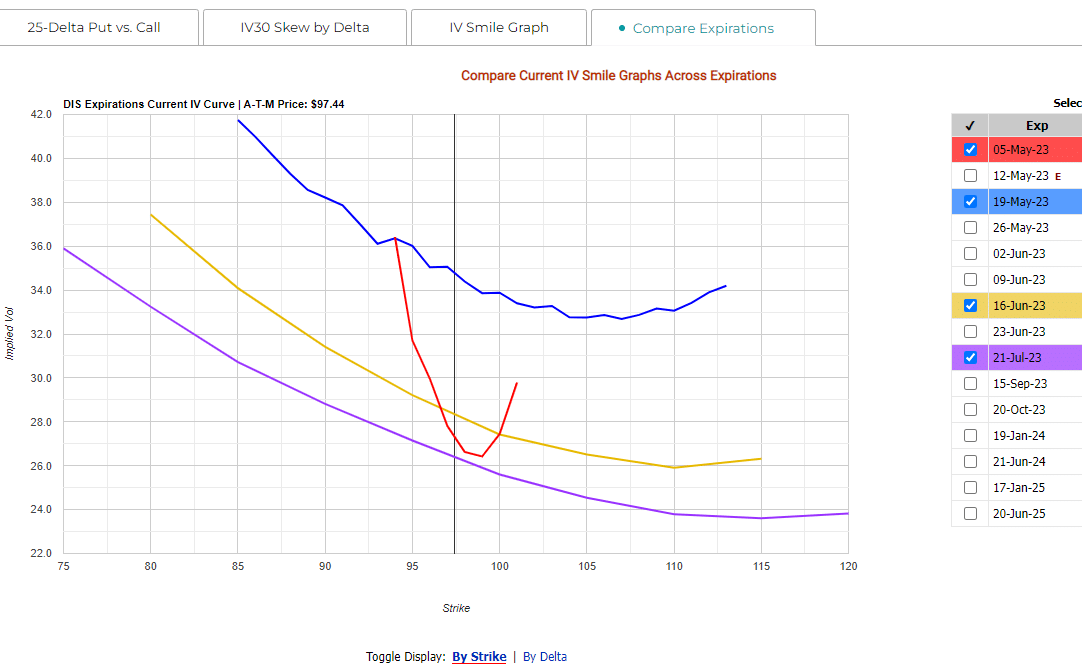
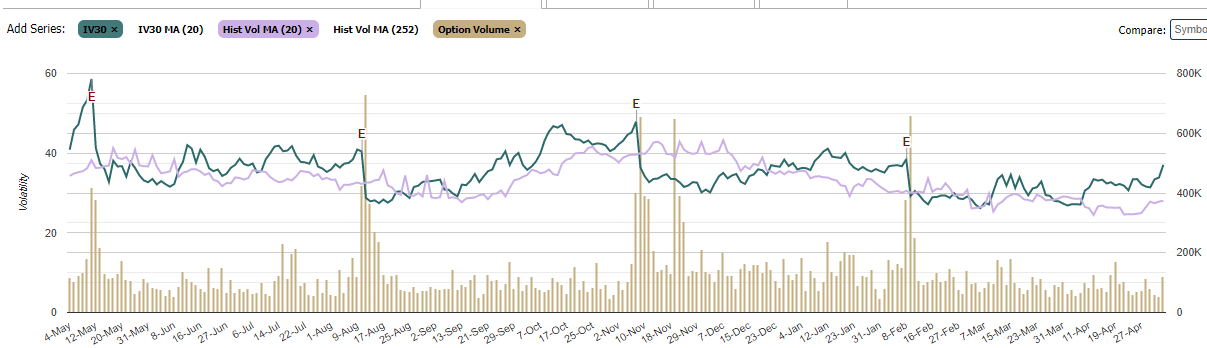
Volatility and Skew
You can see historical volatility:
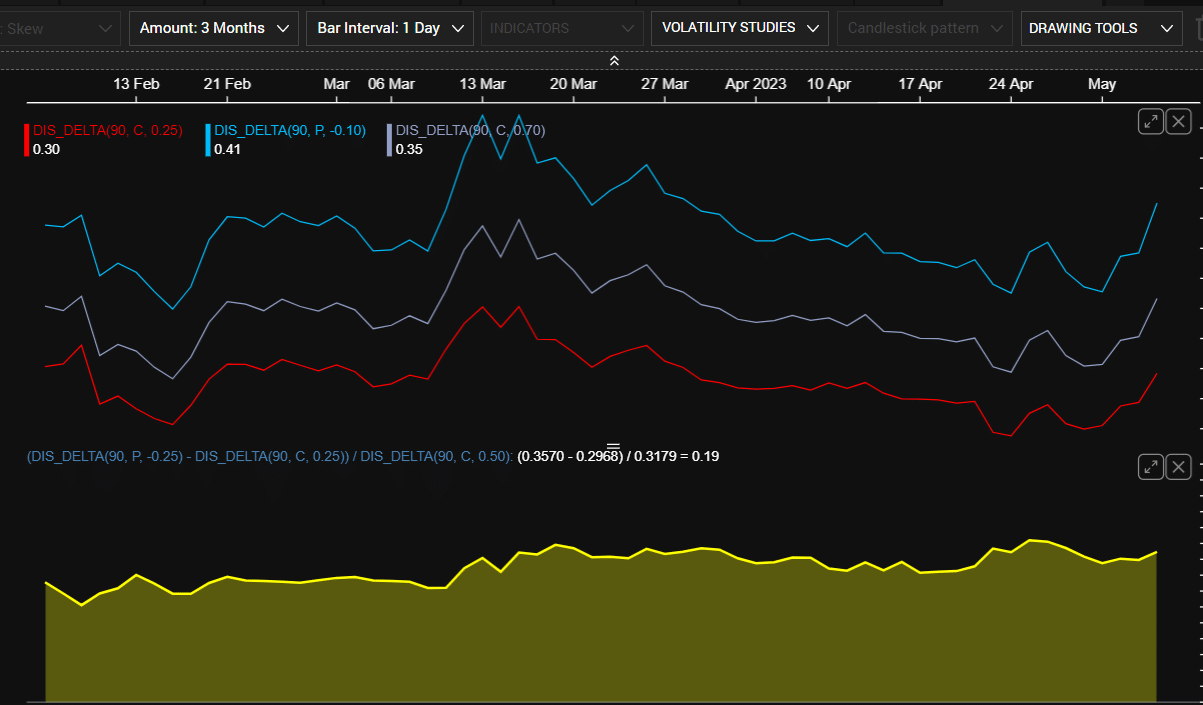
And skew curves for various expirations on Disney:
All Sorts of Volatility Studies
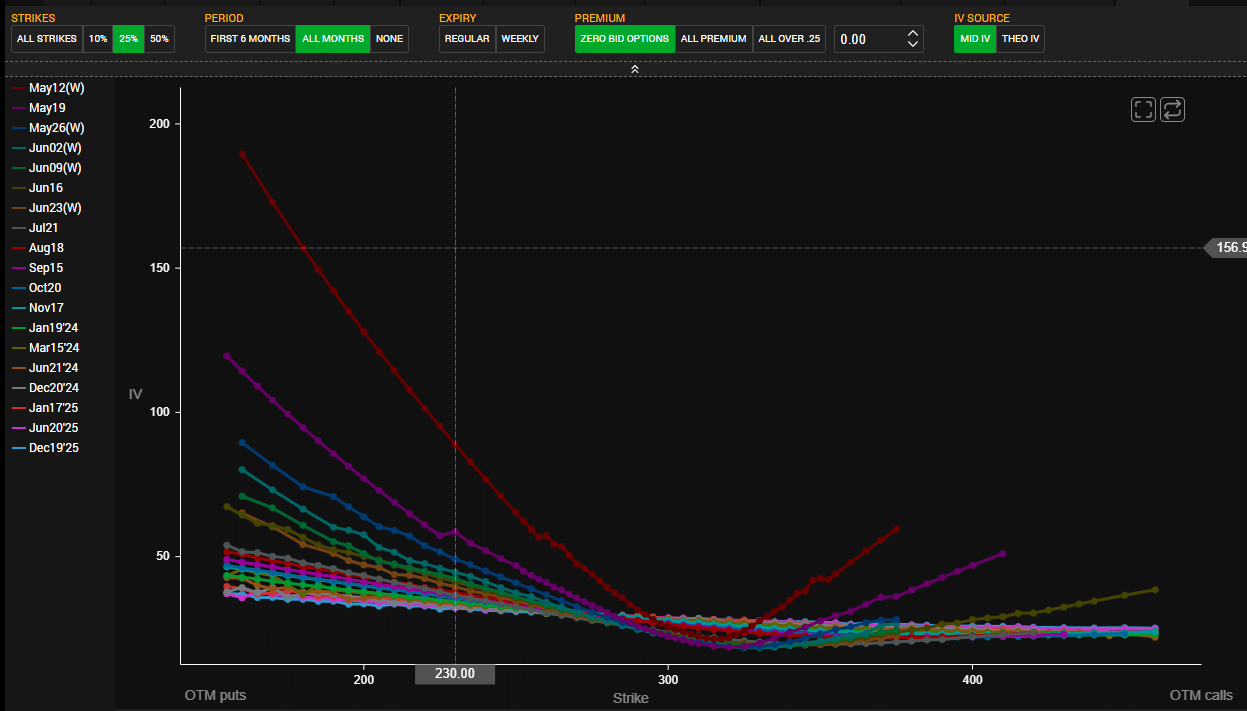
Take a look at the below skew curve for Microsoft.
Could the MSFT 230 put for the May 19th expiration be mispriced?
A blip in the curve shows that it is higher than the strike before and after.
Is this a good option to sell premiums?
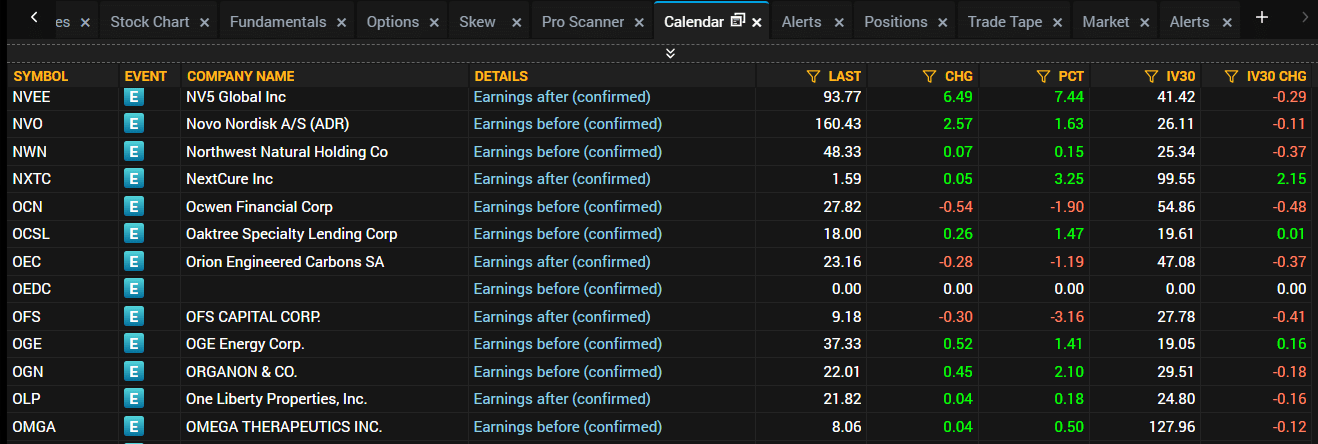
Calendar
Calendar of earnings and dividends events:
Earnings Analysis
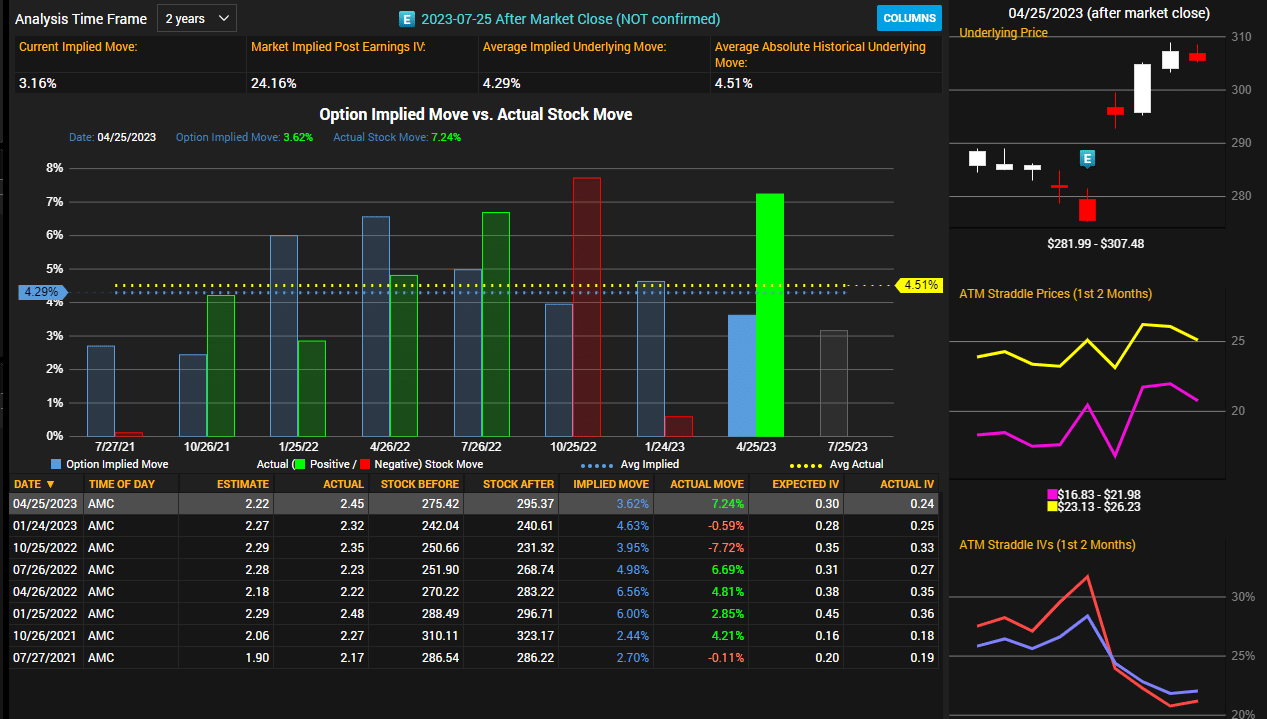
Blue shows how much the market expects the stock to move on earnings.
Green and red colors show how much it moved.
Green means it went up, red down.
On the right panel, it shows the at-the-money straddle price.
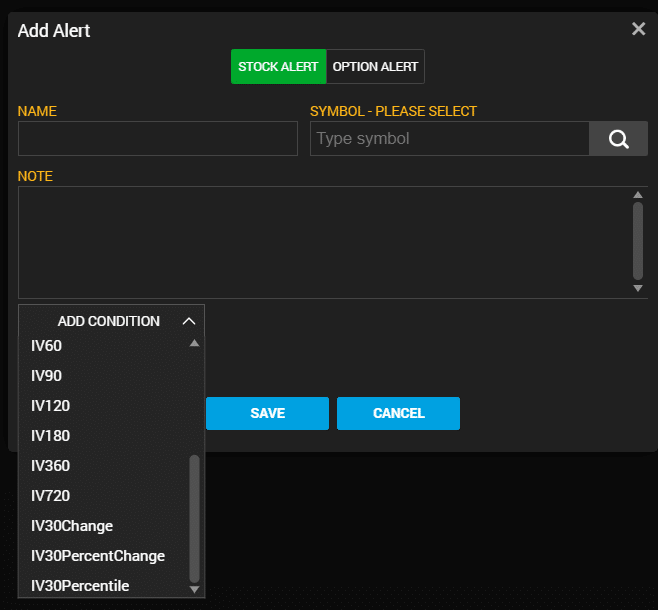
Alerts
You can get alerts for volatility triggers on stocks:
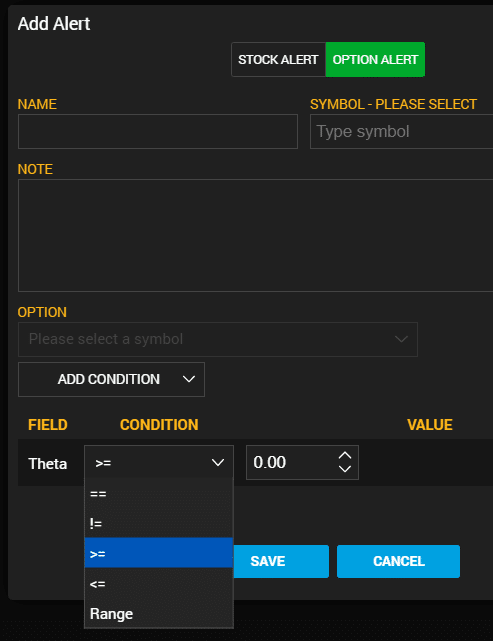
Greeks can also trigger the alerts limits on the options:
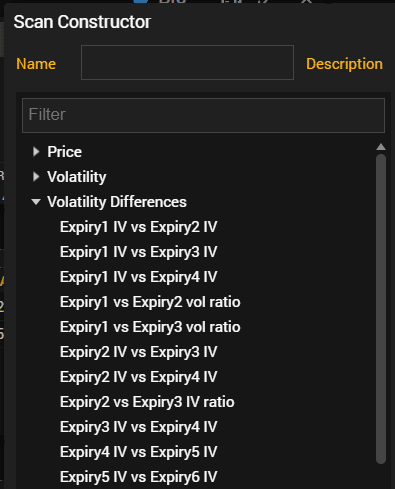
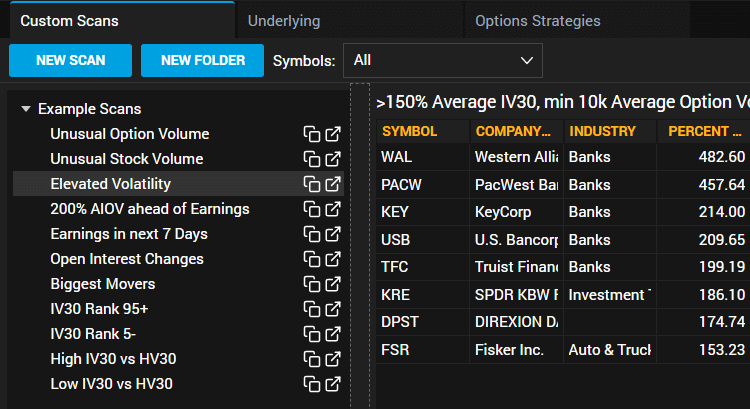
The Pro Scanner
The Pro Scanner lets you construct any imaginable combination of volatility criteria that you might want to look for:
Or just run one of its pre-made scans to look for unusual option volumes, big moves, volatility criteria, and so on
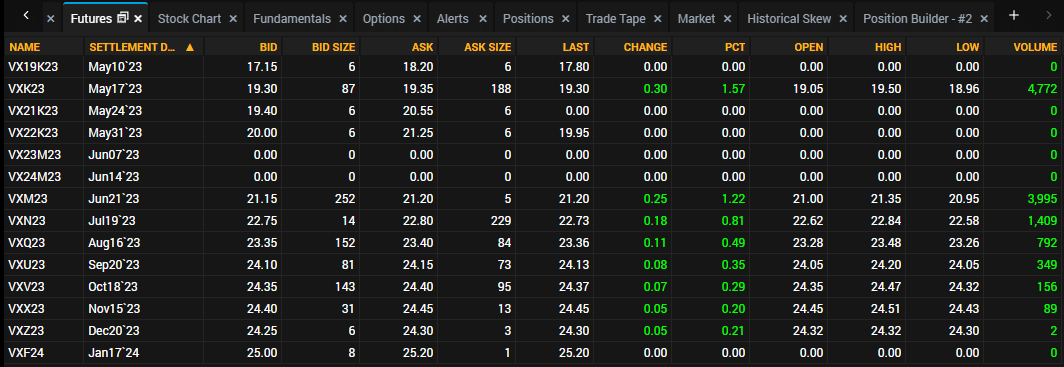
VIX Futures
It has VIX Futures data:
As well as its term structure:
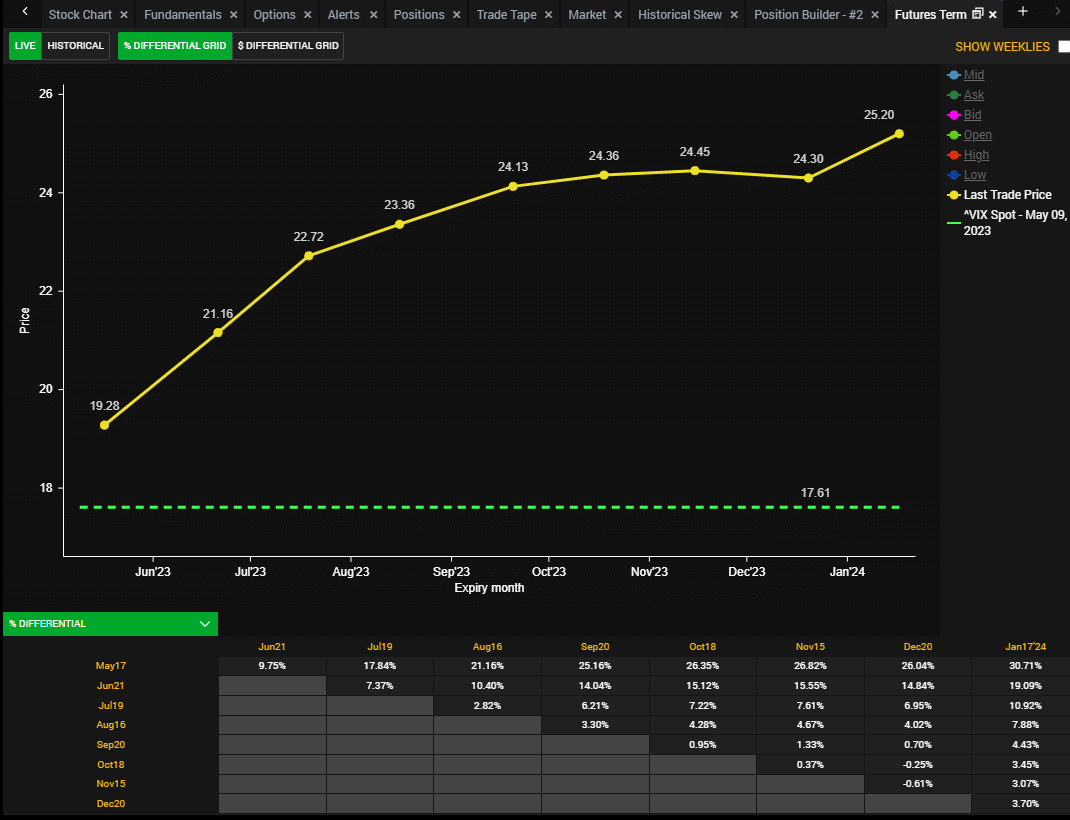
For traders needing only the essential of the VIX Futures terms structure, then vixcental.com is enough.
But LiveVol is for traders who need more.
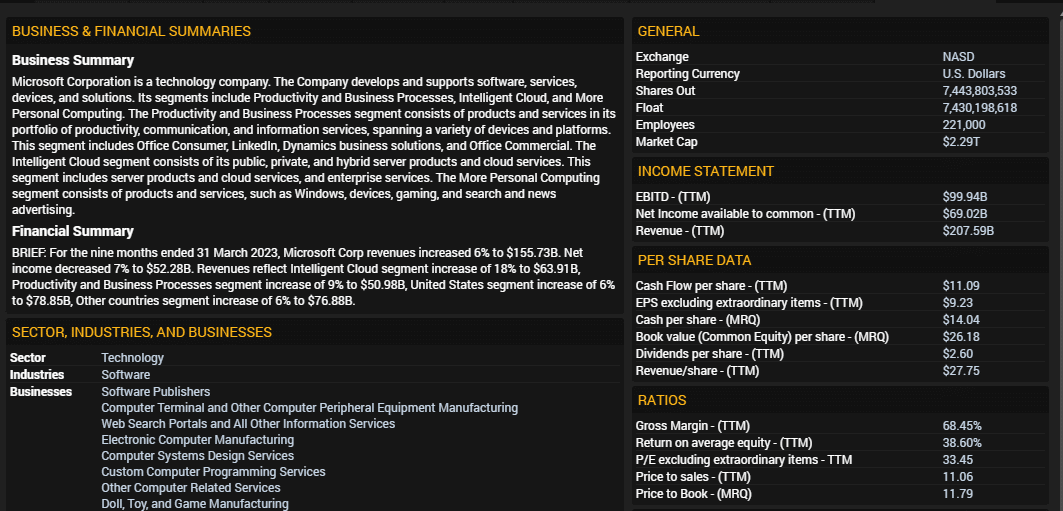
Fundamentals
Company fundamental data is not what LiveVol is strong on, but at least it got some of the key ratios:
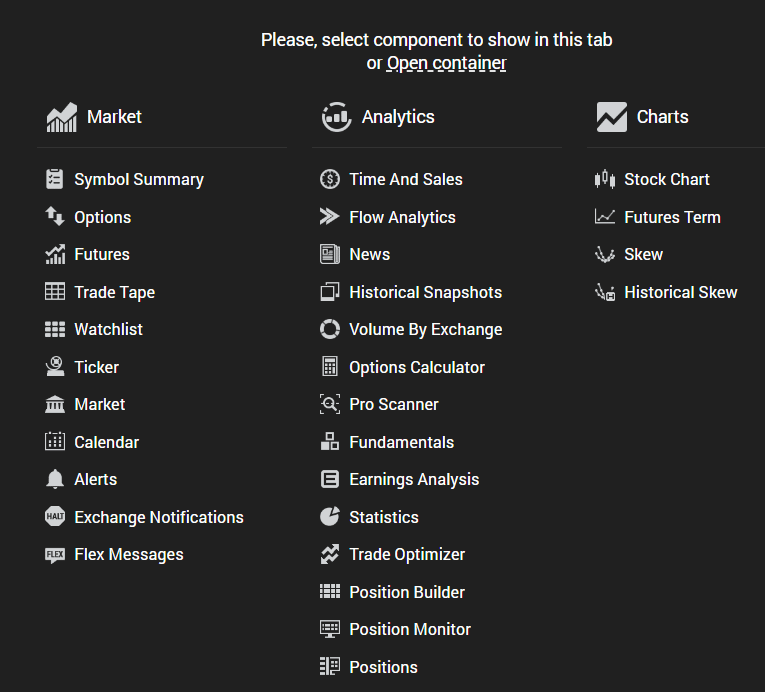
Many Available Panels
I’ve only touched on a few of the many possible panels available to choose from here:
Frequently Asked Questions
What is the best place to learn how to use LiveVol?
The video tutorials listed on LiveVol.com is a great place to start.
Then read the LiveVol user guide.
It’s well organized and has a lot of pictures.
Mark Sebastian, founder of OptionPit, has a good 30-minute walkthrough on YouTube.
Can I find some of the LiveVol data elsewhere that is free?
Some, but not all.
And certainly not all in one browser window like in LiveVol.
For example, marketChameleon has some volatility studies:
Conclusion
As its name implies, volatility data is where LiveVol specializes.
As a first-time user, LiveVol can be intimidating due to its numerous panels.
It is designed for the experienced option trader.
The beginning student will not need such complexity at the moment.
LiveVol has so much data and features that I would find it surprising if it doesn’t have what you are looking for.
We hope you enjoyed this LiveVol review.
If you have any questions, please send an email or leave a comment below.
Trade safe!
Disclaimer: The information above is for educational purposes only and should not be treated as investment advice. The strategy presented would not be suitable for investors who are not familiar with exchange traded options. Any readers interested in this strategy should do their own research and seek advice from a licensed financial adviser.


